Planning - OKI
Planning - OKI
Planning - OKI
- No tags were found...

You also want an ePaper? Increase the reach of your titles
YUMPU automatically turns print PDFs into web optimized ePapers that Google loves.
Community Choices:Warren County, OH
Today’s s Topics• Why <strong>OKI</strong> has to consider land use intransportation planning• <strong>OKI</strong>’s Strategic Regional Policy Plan• Regional and County Trends• Community Choices: Altering the Trend• Tools and Techniques• Questions
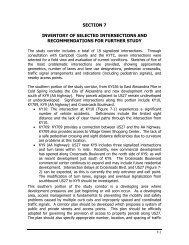
On the Horizon…Transportation Costs vs. RevenuesTransportation Needs ShortfallBillion $3.63.53.43.33.22010 2020 2030Long Range Plan Year
Federal Transportation Law• ISTEA• Intermodal Surface Transportation Efficiency Act• TEA-21• Transportation Equity Act for the 21st Century• SAFETEA-LU• Safe, Accountable, Flexible, and EfficientTransportation Equity Act: A Legacy for Users
Land Use Commission’sMission Statement• “Through open dialogue andcommunication with decision makersand the public, the <strong>OKI</strong> Commission onLand Use shall develop a strategicregional plan which encourages land usepatterns that promote multimodal traveland the efficient use of land, naturalresources, and public facilities andservices.”2010 Transportation Plan, <strong>OKI</strong>
Land Use CommissionResearchExisting Land Use Existing Zoning
Transportation andLand UseMaking the connection
Strategic Regional Policy PlanPurposeTo bring about more consistency betweenlocal land use planning and regionaltransportation planning, so that scarce taxdollars can be used for maximum benefit.
Two Reoccurring Themes• Recognizing the importance ofeffective local comprehensive plans.• We can’t t continue to afford thecurrent trends.
Trends
Population Change<strong>OKI</strong> Region,1970-2000Percent Population Change Between 1970 and 2000162.186.685.2<strong>OKI</strong> Counties47.156.717.0-0.1-8.7-20.0 0.0 20.0 40.0 60.0 80.0 100.0 120.0 140.0 160.0 180.0Hamilton County, OHPercent
Projected Projected Population Percent Change, Between <strong>OKI</strong> 2000 Region, and 2030 2000-20302030Boone County, KY119.4Warren County, OH113.6Clermont County, OH37.7Butler County, OH32.1Campbell County, KY21.9Dearborn County, IN17.8Kenton County, KY11.8Hamilton County, OH-13.6-30.0 -10.0 10.0 30.0 50.0 70.0 90.0 110.0 130.0Percent
Suburban Population vs. TotalPopulationPercent Population Increase1970-2000Percentage403017%20100Total Population IncreaseSource: U.S. Census Bureau30%Suburban PopulationIncreaseSource: U.S. Census Bureau
Population & Population ProjectionsPopulationWarren County, OHWarren County 1970-2030350,000300,000338,350250,000276,250200,000150,000158,383196,622215,020100,00050,00085,50599,276113,92701970 1980 1990 2000 2005 2010 2020 2030Total Population
Population Change 2000-20052005Warren County Cities-4%4%Loveland cityButlerville villagePleasant Plain village5%Harveysburg village9%Franklin cityCarlisle city9%Maineville village11%Waynesville villageMorrow village114%16%Lebanon cityCorwin villageSouth Lebanon village17%Mason city18%Springboro city24%25%31%32%-10% -5% 0% 5% 10% 15% 20% 25% 30% 35%
Population PyramidPopulation <strong>OKI</strong> Pyramid- Region 1980-2000& 2000Age Cohort85 years and over75 to 84 years65 to 74 years60 to 64 years55 to 59 years45 to 54 years35 to 44 years25 to 34 years20 to 24 years15 to 19 years10 to 14 years5 to 9 yearsUnder 5 years300,000 200,000 100,000 0 100,000 200,000 300,000 400,000PopulationCensus 2000Census 1980
Population PyramidWarren County 1980 & 2000Population PyramidWarren County 1980-2000Age Cohort85 years and over75 to 84 years65 to 74 years60 to 64 years55 to 59 years45 to 54 years35 to 44 years25 to 34 years20 to 24 years15 to 19 years35,000 25,000 15,000 5,000 5,000 15,000 25,000 35,000Population10 to 14 years5 to 9 yearsUnder 5 yearsCensus 2000Census 1980
Regional Development TrendSingle-FamilyDetachedHomes PreferredTrend has resulted ina 27% decrease inpopulation density
Residential Density – <strong>OKI</strong> CountiesDwelling Unit per AcreDwellingResidential DensityUnit- <strong>OKI</strong>perCountiesAcreDwelling per Acre1.601.401.201.00Per Acre0.800.600.400.20-HamiltonCountyKentonCountyButler CountyCampbellCountyCountyClermontCountyWarrenCountyBoone CountyDearbornCounty
Average Travel Time to Work By CountyAverage Travel Time to Work60.050.040.0Percent30.024.4 23.930.522.9 23.028.223.024.120.010.0-Boone County,KentuckyCampbellCounty,KentuckyKenton County,KentuckyDearbornCounty, IndianaButler County,OhioClermontCounty, OhioHamiltonCounty, OhioWarren County,OhioCountyMinutes per Person
Work Counties of Warren CountyResidents, 1970-2000
KI Residence Counties of WarrenCounty Workers, 1970-2000
Means of Transportation9%0%2%0%Means of Transportation to WorkWarren County, OH19902%9%1%0%1%Means of Transportation to WorkWarren County, OH20003%Drove aloneCarpooledPublic transportation:Bicycled or WalkedOther meansWorked at homeDrove aloneCarpooledPublic TransportationWalked or BicycledOther meansWorked at home87%86%
Annual Hours of Delay per TravelerAnnual Hours of Delay per Traveler30 3030252018Hours15104501982 1993 2002 2003YearHours
Public Facilities and Services• The construction of publicfacilities can facilitatepremature or poorlyplanned development• Are public facilitiesnecessary to maintainadequate levels ofservice available whenthe impacts ofdevelopment occur?• The timing, location andcost of water, sewer androad facilities have asignificant impact on landuse patterns• The density and intensityof land development isinfluenced by theavailability and adequacyof these services.• It costs more to retrofit orexpand infrastructurethan to provide it for wellplanned neighborhoodsas they develop.
Employment by Industry25000Warren County 1970-2000200001500010000500001970 1980 1990 2000Finance, insurance, and real estate Government and government enterprises Manufacturing Retail trade Services
The Big Picture(s)Existing Land Use Existing Zoning
Community Choices…helping communities decide
Altering the TrendTools and Techniques
Recent <strong>Planning</strong> Activities• Comprehensive Planupdates• Growth ManagementStrategies• Warren County 2020 LandUse Plan & Goals andObjectives• Zoning Code Updates
<strong>Planning</strong> Issues• Long Range <strong>Planning</strong>• Linking plans to capital budgeting– funding for infrastructure• Economic development• The role of government indevelopment• Living at the scale of theregion
SuccessfulComprehensive Plans“If you don't know where you aregoing, you will wind up somewhereelse.”~Yogi Berra
Value of a Comprehensive Plan:• Provides for residential densities & commercialintensities.• Provides for timing and location of development &redevelopment - Timing matters!• Helps avoid lawsuits by providing a basis forzoning.• Vehicle for intergovernmental coordination.• Helps determine local infrastructure deficiencies &future needs – is a vehicle to track various levelsof service.• Ties planning to capital budgeting.• Can save money for jurisdiction and region.• Potential for five points in <strong>OKI</strong> transportationprioritization process.
Comprehensive Plan Contents• Transportation Element• Housing Element• Public Facilities and Services Element• Natural Systems Element• Economic Development Element• Intergovernmental Coordination Element• Capital Improvements Element• Future Land Use Element
Process DesignData Collection/Inventory“Nothing isparticularly hardif you divide itinto small jobs.”~Henry FordAnalysis of TrendsLevel of Service, as approp.Goals, Objectives, PoliciesPublic InputImplementationMonitoring and Evaluation
Level of Service Standards• Vital component of different elements• Establishes a mechanism to ensure that publicfacilities are in place when impact of futuredevelopment occurs• Conditions development orders or permitsupon the availability of public facilities• Phase developments or phase construction ofpublic facilities
Goals, Objectives and Policies• Goals: long term vision• Objectives: intermediate qualitativedirection• Policies: measurable short-term term actions
Intergovernmental CoordinationElement• Identifies adjacent governments,school boards, independent specialdistricts, regional planningagencies, state agencies andothers and methods forcoordination.• Identifies incompatibilities withadjacent governments’ or regionaland state agency plans.• Strengthen coordination efforts withneighboring governments andagencies.
Capital ImprovementsElement• Links planning to capitalbudgeting• Identifies future capitalprojects based on identifiedneeds of othercomprehensive planelements• Addresses what, where,when, and cost
Land Use Element• Identifies the trends,deficiencies, andfuture needs• Brings together thegoals, objectives andpolicies of the otherplan elements• Depicts them on amap
Model Plan Guidelines• Elements of an EffectiveLocal Comprehensive Plan• Minimum Elements of aLocal Comprehensive Plan(Summary)• Making the Most of LimitedTaxpayer Dollars
<strong>OKI</strong>’s s Transportation PrioritizationProcess• The Transportation Improvement Program isthe short-range range portion of the region’s s LongRange Transportation Plan.• The TIP is a program of publicly fundedtransportation improvements for the <strong>OKI</strong>region.• <strong>OKI</strong> produces the TIP on a biennial basis,each edition covers a period of four years.
Evaluation Process• Projects separated—Highway & transit• Projects scored for Transportation Factors(separate highway & transit factors)• Projects scored for <strong>Planning</strong> Factors• Transportation Factors & <strong>Planning</strong> Factorstotaled; rudimentary Benefit/Cost Analysiscompleted.• Considered factors also include safety, LOS,environmental justice, matching local funds,travel modes and now…
<strong>OKI</strong>’s s Transportation PrioritizationProcess• A New Land Use Conformance Factor• Is the project consistent with (further andimplement) the jurisdictions comprehensiveplan?• 5 points - Land Use Consistent--comprehensiveplan complete & current• 3 points - Conformance Consistent--comprehensive plan needs improvement• 0 points - Inconsistent--no comprehensive plan
Sample Ordinances& Resource Documents• Access Management• Concurrency• ConservationSubdivisions• Design Standards• Floodplains• Fiscal Impacts• Forestry• Green Building• Live-Work Development• Low Impact Development• Traditional NeighborhoodDevelopment• Mixed Income Housing• Transit• Workforce Housing• Freight• First Suburbs• Farmland• Stormwater Management…and more
Community Choices: ExampleOrdinances• Adequate Public Facilities• Infill• Connectivity• Transit Friendly Development• Bicycle and Pedestrian Connections• Corridor Redevelopment• Mixed Use Development• Large Scale Retail
Fiscal Impact Analysis Model• Measure the fiscal impact of adevelopment or a land use scenario on thecosts and revenues of the governmentalunit(s) serving the development.• Useful for analyzing the financialimplications of alternative land use plans,small area plans, large annexations, build-out scenarios, large rezoning and plannedunit developments.
Fiscal Impact Analysis Model• Florida’s s model• Compares fiscal implications of alternativeland use scenarios.• Estimates cost/revenue associated with landuse decisions.• Focuses on a variety of public facilities andservices.• Is location-sensitive.• Provides linkage between land use decisionmaking and local budgets.
Summary of Tools• Transportation Prioritization Process –Land Use Conformance Factor• Model Plan Guidelines• Sample Ordinances & ResourceDocuments• Example Ordinances• Fiscal Impact Analysis Model
Analysis Models• Other Scenario Models• CITYgreen• iTree• CommunityViz• INDEX• ArcGIS Network Analyst• <strong>OKI</strong> Visualization• GIS/3D FlyThrough• 3D Visualization• Traffic Simulation