71 - OKI
71 - OKI
71 - OKI
- No tags were found...
You also want an ePaper? Increase the reach of your titles
YUMPU automatically turns print PDFs into web optimized ePapers that Google loves.
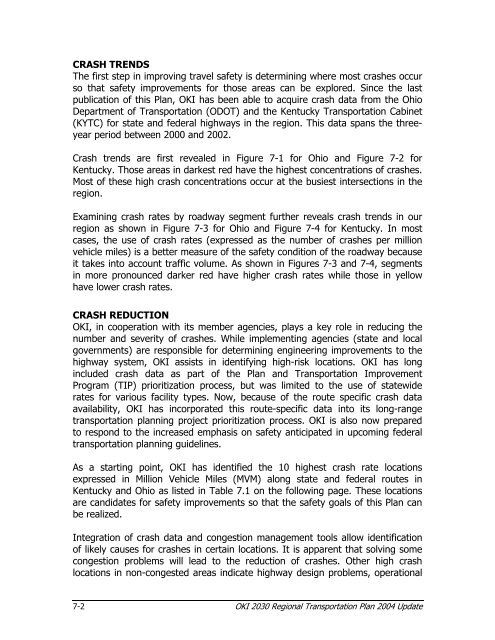
CRASH TRENDSThe first step in improving travel safety is determining where most crashes occurso that safety improvements for those areas can be explored. Since the lastpublication of this Plan, <strong>OKI</strong> has been able to acquire crash data from the OhioDepartment of Transportation (ODOT) and the Kentucky Transportation Cabinet(KYTC) for state and federal highways in the region. This data spans the threeyearperiod between 2000 and 2002.Crash trends are first revealed in Figure 7-1 for Ohio and Figure 7-2 forKentucky. Those areas in darkest red have the highest concentrations of crashes.Most of these high crash concentrations occur at the busiest intersections in theregion.Examining crash rates by roadway segment further reveals crash trends in ourregion as shown in Figure 7-3 for Ohio and Figure 7-4 for Kentucky. In mostcases, the use of crash rates (expressed as the number of crashes per millionvehicle miles) is a better measure of the safety condition of the roadway becauseit takes into account traffic volume. As shown in Figures 7-3 and 7-4, segmentsin more pronounced darker red have higher crash rates while those in yellowhave lower crash rates.CRASH REDUCTION<strong>OKI</strong>, in cooperation with its member agencies, plays a key role in reducing thenumber and severity of crashes. While implementing agencies (state and localgovernments) are responsible for determining engineering improvements to thehighway system, <strong>OKI</strong> assists in identifying high-risk locations. <strong>OKI</strong> has longincluded crash data as part of the Plan and Transportation ImprovementProgram (TIP) prioritization process, but was limited to the use of statewiderates for various facility types. Now, because of the route specific crash dataavailability, <strong>OKI</strong> has incorporated this route-specific data into its long-rangetransportation planning project prioritization process. <strong>OKI</strong> is also now preparedto respond to the increased emphasis on safety anticipated in upcoming federaltransportation planning guidelines.As a starting point, <strong>OKI</strong> has identified the 10 highest crash rate locationsexpressed in Million Vehicle Miles (MVM) along state and federal routes inKentucky and Ohio as listed in Table 7.1 on the following page. These locationsare candidates for safety improvements so that the safety goals of this Plan canbe realized.Integration of crash data and congestion management tools allow identificationof likely causes for crashes in certain locations. It is apparent that solving somecongestion problems will lead to the reduction of crashes. Other high crashlocations in non-congested areas indicate highway design problems, operational7-2 <strong>OKI</strong> 2030 Regional Transportation Plan 2004 Update


