CHAPTER 2 BARRIER WARRANTS
CHAPTER 2 BARRIER WARRANTS
CHAPTER 2 BARRIER WARRANTS

You also want an ePaper? Increase the reach of your titles
YUMPU automatically turns print PDFs into web optimized ePapers that Google loves.
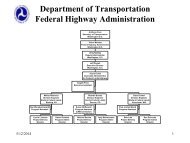
Barrier Warrants ________ November 2005<strong>CHAPTER</strong> 2<strong>BARRIER</strong> <strong>WARRANTS</strong>2.1 THE WARRANTING PROCESSWarranting of roadside barriers is difficult to quantify. It is more a process to ensure thatall important issues are addressed rather than a “cookbook” approach. This process issummarized in Figure 2.1:Figure 2.1: Barrier Warranting Process1. Determine the needed clear zone.2. Identify potential hazards.3. Analyze strategies.4. Evaluate roadside barriers.Each of these steps is addressed in this chapter. This process is designed to identifyonly the most severe hazards close to the roadway that are appropriate for shielding bybarriers. It takes into account both the cost of a barrier and the expected crashes intothat barrier. Local conditions, policies and resources are also considered in thisprocess.________________________________________________________________________The Warranting Process 2-1
Barrier Warrants ________ November 20052.2 DETERMINE THE NEEDED CLEAR ZONE2.2.1 The Clear ZoneThe area adjacent to the edge of a traveled way available for the safe recovery of anerrant vehicle is known as the clear zone. If adequate clear zone distance is available,there is a reasonable expectation that most drivers of vehicles that leave the roadwaywill have enough room to regain control and return to the pavement without a seriouscrash occurring. The desirable clear zones used for barrier design and evaluationpurposes will not provide sufficient space for all vehicle departures. Some degree of riskis acceptable in the interest of economy. The first step in the warranting process is todetermine the required clear zone because it is normally not necessary to shield hazardslocated outside the clear zone.2.2.2 Clear Zone TableChapter 3 of the AASHTO Roadside Design Guide (RDG) contains charts and tablessuggesting that the needed clear zone is a function of design speed (see the ProjectDevelopment and Design Manual for a discussion of design speed), side slopes andhorizontal curvature: all conditions that may work against the driver’s attempts to regaincontrol of the vehicle. Additional modifications are made for low traffic volume as aneconomic consideration, recognizing that low volumes result in a lower crash probability.The RDG clear zone recommendations provide limited information for low speedconditions. Table 2.1 is an extension of the RDG table to account for speeds below 60km/h (40 mph).Table 2.1 is intended as an aid in determining what potential hazards should beconsidered for barrier warrants. Although it may be useful as suggested minimum clearzones for geometric design, Table 2.1 is not a design standard. Appropriate referencesfor designing slopes are in Chapter 9 of the Project Development and Design Manualand the RDG. In general, slopes should be designed to avoid the need for barriers.Although foreslopes as steep as 1V: 3H are traversable, slopes steeper than 1V: 4H arenot recoverable and are difficult to maintain. They should be considered marginal from asafety perspective. Ideally, foreslopes should be 1V: 4H or flatter. If that objectivecannot be met, a combination (or “barn roof”) slope should be provided, with the topslope 1V: 4H or flatter then breaking to a steeper slope.________________________________________________________________________2-2 Determine the Needed Clear Zone
Barrier Warrants ________ November 2005Table 2.1: Clear Zone Distances from Edge of Through Traveled WayDESIGNSPEEDDESIGNADT20 mph Under 750750 - 15001500 - 6000over 600025 - 30mphUnder 750750 - 15001500 - 6000over 600035 mph Under 750750 - 15001500 - 6000over 6000(Continued) (U.S. Customary Units)FORESLOPES1V: 6H 1V: 5H 1V: 3H 1V: 3H 1V: 5Hor flatter toto1V: 4H1V: 4H2 - 63 - 75 - 87 - 103 - 75 - 87 - 107 - 105 - 87 - 1010 - 1212 - 143 – 75 - 86 - 107 - 105 – 86 - 107 - 1010 - 126 – 107 - 1212 - 1414 - 16******2 - 62 - 63 - 75 - 82 - 63 - 75 - 87 - 103 - 75 - 87 - 1010 - 12BACKSLOPES2 - 62 - 63 - 75 - 82 - 63 - 75 - 87 - 103 - 75 - 87 - 1010 - 121V: 6Hor flatter3 - 73 - 75 - 87 - 103 - 75 - 87 - 107 - 105 - 87 - 1010 - 1212 - 14* See the AASHTO Roadside Design Guide for design speeds 40 mph and higher.** Foreslopes between 1V: 4H and 1V: 3H are traversable but non-recoverable. Since vehicleswill not reduce speed or change direction on these slopes the needed clear zone is determinedby the slopes above and below the non-recoverable slope and extended by the width of the nonrecoverableslope. See Chapter 3 of the RDG for more information on this procedure.Foreslopes steeper than 1V: 3H are considered hazards.2.2.3 Horizontal Curve AdjustmentOn the outside of horizontal curves errant vehicles are likely to leave the roadwaytangent to the curve. Consequently, additional clear zone is needed for recovery. Table3.2 of the RDG suggests multipliers for adjusting clear zones on the outside of horizontalcurves. The RDG recommends that this adjustment be used where there is reason toexpect the curve to be a concern. A crash history, inadequate superelevation andserious hazards within the adjusted clear zone may be reasons to consider using anadjusted clear zone. Since roadside crashes are more likely to occur on the outside ofhorizontal curves, the use of these adjustments should always be considered.Adjustments on the inside of horizontal curves are not appropriate. Table 2.2 expandsthe RDG table to account for lower speeds.________________________________________________________________________2-4 Determine the Needed Clear Zone
Barrier Warrants ________ November 2005Table 2.2: Horizontal Curve AdjustmentsKCZ (Curve Adjustment Factor) (Metric Units)RADIUS (m) DESIGN SPEED (km/h)30 40 50 55350 1.2300 1.2 1.2250 1.2 1.2 1.2200 1.2 1.2 1.3150 1.3 1.3 1.4100 1.4 1.4 1.5KCZ (Curve Adjustment Factor) (U.S. Customary Units)RADIUS (ft) DESIGN SPEED (mph)20 25 30 351150 1.2950 1.2 1.2820 1.2 1.2 1.2720 1.2 1.2 1.3640 1.2 1.3 1.3570 1.3 1.3 1.4380 1.4 1.4 1.5Note: The clear zone correction factor is applied to the outside of curves only. Curveswith a radius greater than 350 M (1,150 ft) do not require an adjusted clear zone.2.2.4 Opposing Traffic Clear ZoneFor opposing traffic on a two-lane/two-way road, it is valid to consider the centerline asthe edge of the travel way, so the near side lane is part of the opposing traffic clearzone. Therefore, the 1V: 6H or flatter foreslope column should be used in determiningopposing traffic clear zones. For most low volume, low speed conditions hazards will beoutside the opposing traffic clear zone except, possibly, on the outside of horizontalcurves.2.2.5 Effects of Curbs on the Clear ZoneCurbs offer little or no redirection for vehicles departing the roadway. Although generallya lower speed impact with a curb results in more redirection, crash tests and crashanalyses find that curbs are frequently mounted by an impacting vehicle even at very lowspeeds. It is inappropriate to construct curbs for the purpose of avoiding or minimizingclear zone requirements. The decision to place curbs should be based on other factorsincluding drainage, available right of way and land-use characteristics. The followingguidance is for determining clear zone requirements if curbs are already present:________________________________________________________________________Determine the Needed Clear Zone 2-5
Barrier Warrants ________ November 2005At speeds of 40 km/h (25 mph) or lower, right-of-way is usually very restricted androadside safety issues may not be a major design priority. In these cases it may beappropriate to eliminate or minimize the need for a clear zone if a vertical curb with aheight of 150 mm (6 in) or higher is present. A minimum horizontal clearance of 0.5m (1.5 ft) should be provided beyond the back of the curb.At speeds of 50 km/h (30 mph) to 70 km/h (45 mph), the presence of curbs may be aconsideration for using the minimum clear zones in the ranges shown in Table 2.1 ofthis guide.At speeds of 80 km/h (50 mph) or higher, curbs will vault a vehicle causing it tobecome airborne. The severity of the vaulting is a function of the height of the curband the slope of the face. If curbs with a height of 150 mm (6 in) or higher arepresent, the higher end of the clear zone range should be selected.2.2.6 Application of the Clear ZoneThe following list includes some helpful considerations for the selection of the clearzone:The RDG clear zone recommendations are based on limited research, along withengineering judgment and experience. The clear zones as recommended in theRDG and in Table 2.1 of this guide are approximate ranges and are not precise. Thedesigner must also consider site-specific conditions, operating speeds, location andpracticality.At very low volumes (under 400 ADT), it is common that rights-of-way are restricted,there are an overwhelming number of hazards and very little funds are available forcorrective actions. Thus clear zones may appear impractical. Nevertheless, in thesecases the clear zone concept can be used to make the roadway as safe as possible.As a minimum, a traversable consistent shoulder should be provided. As much aspossible of the recommended clear zone (which is relatively small for low volumeconditions) found in Table 2.1 should be provided. Figure 2.2 illustrates a lowvolume road with minimum clear zones. The use of the warranting process for theconditions discussed in this chapter helps identify the most serious hazards close tothe roadway that may justify corrective actions. The barrier warranting proceduretakes very low ADT conditions into account.The approximate center of the range is suggested for average conditions. The highend of the range is appropriate for sites with higher risk conditions and the low endfor less severe conditions.Vehicles can and will encroach beyond the recommended clear zones. If severehazards exist beyond these clear zones, they should be considered for protection. Design speed should be used to determine the clear zone. When the design speedis unknown, it may be appropriate to use the posted speed. If the operating speed isgreater than the design and posted speeds, it may be more appropriate to use theoperating speed.________________________________________________________________________2-6 Determine the Needed Clear Zone
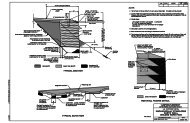
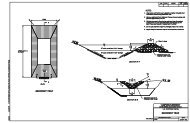
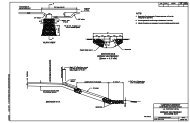
Barrier Warrants ________ November 2005If the roadway slopes vary, the slope conditions on the approach to the hazard areused rather than those at a cross section at the hazard to determine clear zone. Theapproach can be determined by using a 10-degree angle of departure from the edgeof pavement.See Section 3.3.4 and example problems F and G in the RDG for information on thecalculation of clear zones for combination slopes.Figure 2.2: Roadway with 2M (6 ft) to 2.4 M (8ft) Clear Zone________________________________________________________________________Determine the Needed Clear Zone 2-7
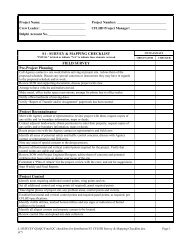
Barrier Warrants ________ November 20052.3 IDENTIFY POTENTIAL HAZARDS2.3.1 Potential HazardsOnce the desired clear zone is determined, fixed objects and roadside features that maybe hazards within the clear zone can be identified. There are many conditions thatpresent some degree of risk if struck but are not serious enough to consider shieldingwith a roadside barrier. Tables 2.3 through 2.6 list hazards and their potential severity.Severity increases from 1 to 3, with Group 3 being the more severe.Table 2.3: Fixed ObjectsPotential Hazard Group 1(Low Severity)Group 2(ModerateSeverity)Group 3(High Severity)Bridge piers, abutments and railing endsXBoulders, less than 0.3 m (1 ft) in diameterXBoulders, 0.3 m (1 ft) in diameter or largerXNon-breakaway sign and luminaire supportsXIndividual trees, greater than 100 mm (4 in) Xand less than 200 mm (8 in) diameterIndividual trees, greater than 200 mm (8 in)XdiameterGroups of trees, individually greater than 100Xmm (4 in) diameter*Utility polesX* Because of driver expectancy, a group of trees at a consistent offset for lengthy distances mayexperience lower encroachment rates, even though the offset may be within the clear zone. Insuch instances, it may be appropriate to consider the trees a Group 2 hazard.Figure 2.3: Unshielded Bridge Rail End________________________________________________________________________2-8 Identify Potential Hazards
Barrier Warrants ________ November 2005Table 2.4: Drainage FeaturesPotential Hazard Group 1(Low Severity)Group 2(ModerateSeverity)Group 3(High Severity)Cross Drain Culvert Ends:Exposed culvert ends with no headwalls, 1 m(36 in) in diameter or lessExposed culvert ends with no headwalls,greater than 1 m (36 in) in diameterSloped culvert ends, less than 1.2 m (4 ft) indiameterSloped culvert ends, greater than 1.2 m (4 ft)and less than 2.4 m (8 ft) in diameterSloped culvert ends, 2.4 m (8 ft) or greater indiameterVertical headwalls, less than 1.0 m (3 ft) inheightVertical headwalls, 1 m (3 ft) or higherHeadwalls with parallel sloped wingwalls, 0.6m (2 ft) or less heightHeadwalls with parallel sloped wingwalls,greater than 0.6 m (2 ft) heightHeadwalls with flared and sloped wing walls,1.0 m (3 ft) or less heightHeadwalls with flared and sloped wing walls,greater than 1.0 m (3 ft) heightCulvert end sections with crashworthy gratesXXXXXXXXXXXXParallel Drain Culvert Ends:Exposed culvert ends with no headwalls,less than 0.6 m (2 ft) in diameterExposed culvert ends with no headwalls, 0.6m (2 ft) and less than 1.2 m (4 ft) in diameterExposed culvert ends, 1.2 m (4 ft) or greaterin diameterMitered culvert ends, less than 1 m (3 ft) indiameterMitered culvert ends, 1 m (3 ft) or greater indiameterVertical headwalls, less than 1 m (3 ft) aboveditch sectionVertical headwalls, 1 m (3 ft) or higher aboveditch sectionXXXXXXX________________________________________________________________________Identify Potential Hazards 2-9
Barrier Warrants ________ November 2005Table 2.5: Grading FeaturesPotential Hazard Group 1(LowSeverity)Group 2(ModerateSeverity)Group 3(HighSeverity)Parallel Ditches:Ditches outside the preferred cross section onFigures 3.6 and 3.7 of the RDG and with foreslopeflatter than 1V: 3HDitches with foreslopes 1V: 3H or steeper (Deepditches should also meet the foreslope criteriabelow)XXSlopes1V: 3H foreslope less than 2 m (7 ft) high* X1V: 3H foreslope 2 m (7 ft) and higher* X1V: 2H to 1V: 1.5H foreslope less than 4 m (13 ft)Xhigh*1V: 2H to 1V: 1.5H foreslope 4 m (13 ft) high andhigherVertical foreslope or fill wall less than 2 m (7 ft) highXVertical foreslope or fill wall 2 m (7 ft) and higherBackslopes that are uneven, or with deep erosionXruts, large rocks, and treesVertical backslope with horizontal projections of 200 Xmm (4 in) or smallerVertical backslope with horizontal projections largerXthan 200 mm (4 in)Downward intersecting slope (transverse to travelway, such as a river bank) 1V: 4H or steeper,Xbetween than 0.5 (2 ft) high to 2 m (6 ft) highDownward intersecting slope (transverse to travelway, such as a river bank) 1V: 4H or steeper, 2 m(6 ft) or higherUpward intersecting slope (transverse to travel way,such as an overpass fill) 1V: 4H to flatter than 1V:X1.5H, greater than 0.3 m (1 ft) highUpward intersecting slope (transverse to travel way,such as an overpass fill) 1V: 1.5 H or steeper,greater than 0.3 m (1 ft) highXXXX* Slopes are assumed to be relatively smooth and free of obstacles. If slopes are uneven, havedeep erosion ruts, large rocks and trees or other vegetation that may cause a vehicle to beunstable, then the classification should be increased one category. Conditions at the bottom ofthese slopes must also be evaluated.________________________________________________________________________2-10 Identify Potential Hazards
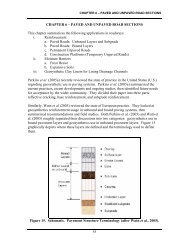
Barrier Warrants ________ November 2005Table 2.6: Other FeaturesPotential Hazard Group 1(LowSeverity)Group 2(ModerateSeverity)Group 3(High Severity)Parallel smooth retaining wall or cut slopeRetaining wall parallel or flared away fromapproaching traffic at flatter than 1:8Retaining wall flared away from approachingtraffic at 1:8 or steeperWater at a depth of 0.3 m (1 ft) to 1 m (3 ft)Water at a depth of 1 m (3 ft) or deeperXXXXXFigure 2.4: Vertical Drop and Boulders________________________________________________________________________Identify Potential Hazards 2-11
Barrier Warrants ________ November 20052.3.2 Crash HistoryCrash history, if available, can also be of assistance in identifying and evaluatinghazards. In order to identify significant patterns, a history of several years is needed.Three to five years is usually sufficient, but even longer periods are useful for lowvolume roads. There is a certain amount of randomness with roadside crashes.Therefore, a crash analysis should look for patterns of crashes at several sites thatshare common characteristics, such as roadway features and hazard types. Care mustbe taken to avoid overreacting to one severe crash at a specific site when there is noestablished pattern. Otherwise, an expensive corrective action may be constructed tocorrect a problem that may never recur.2.3.3 Innocent Bystander WarrantA final consideration is what is known as the innocent bystander warrant. In this casethe issue is not protecting the occupants of an errant vehicle, but protecting nonmotoristsor sensitive roadside conditions. Examples are a school playground that iswithin the needed clear zone, pedestrian facilities within the clear zone that will be usedfrequently by many pedestrians who may be inattentive to traffic or homes within theclear zone. Application of this warrant is difficult to quantify but it should follow the samegeneral process discussed in this chapter, evaluating both risks and costs of placing ornot placing barriers.________________________________________________________________________2-12 Identify Potential Hazards
Barrier Warrants ________ November 20052.4 ANALYZE STRATEGIES2.4.1 Probability and SeverityThe concepts of probability and severity must be understood to effectively evaluateroadside safety alternatives. The probability (or likely frequency) of a vehicle striking anyroadside object or condition (including barriers) is determined by a complex set ofvariables, including:Traffic volumeSpeedRoadway characteristics (number and width of lanes, shoulders, divided or not, etc)Horizontal curvatureGradeSize and offset of the hazard or barrierRate of encroachment (affected by familiarity of drivers, driver distractions, driverexpectancy and design consistency of the roadway)Severity is a measure of the consequences of crashes once a hazard or condition isstruck, regardless of probability. Severity is a function of speed and the relativeseriousness of crashes. Severity is measured by the mix of likely crash types: fatal,injury and property-damage-only. Severity can be measured by a severity index using a0 to 10 scale. Appendix A of the RDG defines this scale using proportions of crashtypes. For example, of all the crashes that might occur with a roadside featureevaluated as a Severity Index of 5.0, 15 percent will be property-damage-only, 77percent will be injury crashes and 8 percent will be fatal crashes.________________________________________________________________________Analyze Strategies 2-13
Barrier Warrants ________ November 20052.4.2 Strategies for Corrective ActionPossible strategies are summarized in Table 2.7.Table 2.7: Strategies for Corrective ActionsStrategyPossible Corrective ActionsReduce the probability of vehicles leaving Flatten horizontal curvesthe roadway Provide adequate superelevation Provide standard lane widths Pave with a skid-resistant surface Widen shoulders Pave shoulders Mark centerline and edge lines Delineate sharp curves Provide shoulder rumble stripsEliminate the hazard Remove the hazard Relocate the hazard to outside theclear zoneReduce the severity of the hazard Make the hazard crashworthy orbreakaway Shield with a barrierAccept the risk and leave the hazard Delineate the edge of traveled wayunprotected Install object markers on thehazard, if appropriateFigure 2.5: Delineation on a Horizontal Curve________________________________________________________________________2-14 Analyze Strategies
Barrier Warrants ________ November 20052.4.3 Strategies for Specific HazardsOf the severity groups discussed in Section 2.3.1, Group 1 hazards are estimated tohave a severity index of below 3.0 (fatalities are unlikely), Group 2 hazards have aseverity index of 3.0 to 4.9 (some possibility of serious injury and fatality, but probablyless severe than barriers) and Group 3 hazards have a severity index of 5.0 and higher(may be more severe than a crash into a barrier). Currently acceptable roadside barriersare estimated to have a severity index of 4.9. All these severity indices are estimated at100 km/h (62mph), but generally will have the same relative meaning at lower speeds.Group 2 hazards should be considered for the same corrective actions as Group 3hazards if they have crash histories or are located so that a vehicle could strike morethan one hazard in the same run-off-the-road event.The following strategies are generally appropriate for the severity groups identified inSection 2.3:Severity GroupGroup 1Possible Corrective ActionsAccepting the risk and leaving the hazard is usuallyappropriate. Avoid placing these conditions in theclear zone or take simple, low-cost correctiveactions if possible. Group 1 hazards commonly donot justify expenditure of substantial funds tocorrect.Group 2 Consider cost-effective strategies to reduceprobability, eliminate the hazard or reduce theseverity of the hazard. Because these hazardsgenerally do no warrant shielding with a roadsidebarrier, the cost of a corrective action should beless than the expected cost of a barrier. If a newroad, avoid placing Group 2 hazards in the clearzone.Group 3Evaluate for possible use of roadside barriers if it istoo expensive or impractical to eliminate either thehazard or make it crashworthy. If a barrier is foundnot to be warranted or if an alternate treatment isless expensive than a barrier, treat as a Group 2hazard.Solutions can include combinations of strategies. For instance, if a large cross drainculvert headwall is within the clear zone, a combination of effective corrective actionsmight be to improve the shoulders, add edge lines, extend the headwall to outside theclear zone, and remodel the headwall to make it more crashworthy.________________________________________________________________________Analyze Strategies 2-15
Barrier Warrants ________ November 20052.5 ANALYZE THE NEED FOR ROADSIDE <strong>BARRIER</strong>S2.5.1 Barrier ConsiderationsBarriers are not an ideal treatment for roadside hazards on low volume, low speed roadsfor a number of reasons, including the costs of installation, maintenance and repair aswell as possible environmental and aesthetic impacts. The frequency of crashes intobarriers will be larger than crashes into the hazard (simply because barriers are closer tothe travel way and longer than the condition being shielded). Crashes into barriers canbe serious events. For all these reasons, the alternate strategies and corrective actionsdiscussed in Section 2.4 should be carefully evaluated before deciding on a barrier.Barriers should be considered only when other strategies are too costly or impracticaland there is a reasonable expectation that the barrier will be a better choice than leavingthe hazard unprotected.The benefits, costs, impacts and risks of barriers should be considered, including:Cost of construction, maintenance, and repair when struck. These costs can beestimated with a fair degree of certainty.Probability and severity of striking the barrier compared to striking the hazard. Thisis more difficult to estimate because predicting potential outcomes is a verycomplicated evaluation considering many variables. Analytical tools that canquantify potential impacts on both the hazard and the corrective action are availableto assist in this analysis. Otherwise, judgment based on experience and trainingmust be applied.Aesthetic impacts of the barrier. In parks and similar settings the aesthetics of someroadside barriers may be a valid concern. One concern may be the barrier itself andanother may be view obstruction. Chapter 3 discusses both rustic-appearing barriersthat have been developed specifically to mitigate aesthetic concerns and barriersthat minimize view obstruction.Environmental impacts of the barrier. There are two types of environmental impactscommonly associated with the installation of roadside barriers. Widening of arelatively flat area beyond the shoulder is frequently necessary to accommodate thewidth of a barrier. That widening could create environmental concerns. Alsoconcrete and masonry barrier systems that are solid walls may restrict the movementof small animals. Environmental impacts that might be associated with barriers areusually quite small. Neither aesthetic nor environmental impacts can be quantifiedfor direct comparison with other factors, but they should be considered whenappropriate.________________________________________________________________________2-16 Analyze the Need for Roadside Barriers
Barrier Warrants ________ November 20052.5.2 Analytical ProceduresEconomic analysis is useful in evaluating the need for barriers. The computerizedRoadside Safety Analysis Program (RSAP) quantifies all the concerns discussed exceptaesthetics and environmental. RSAP evaluates the probabilities and severities ofroadside hazards and barriers, along with construction, maintenance and repair costs todetermine the benefit/cost ratio of a corrective action such as a roadside barrier.Although RSAP can provide a very site-specific analysis, there are problems with thesystem, particularity as applied to low volume roads. An alternative warranting processbased on RSAP analysis is presented in Appendix A. The application of this processensures consistent assumptions and does not require any knowledge of the RSAPsystem. It is designed to eliminate some of the concerns with RSAP.2.5.3 Subjective ProcedureIf either RSAP or the procedure discussed in Appendix A is not used, a subjectiveevaluation can be made by following these steps:1. Determine the needed clear zone.2. From Tables 2.3 through 2.6, identify hazards within the clear zone that may warrantbarriers. Hazards that may warrant barriers include those in Group 2 if there is aclear crash history or multiple hazards serve to increase the severity. All hazards inGroup 3 may warrant barriers.3. Evaluate the use of barriers using the considerations listed in Table 2.8. Althoughthis is a subjective analysis, it can lead to a reasonable decision concerning the useof roadside barriers.________________________________________________________________________Analyze the Need for Roadside Barriers 2-17
Barrier Warrants ________ November 2005Table 2.8: Barrier Warrant ConsiderationsConsiderationBarrier is morewarranted if:Barrier is lesswarranted if:Speed 70 km/h (45 mph) or higher 40 km/h (25 mph) or lowerHazard on outside ofhorizontal curve350 m (1,150 ft) or smallerradiusRadius larger than 400 m(1,430 ft)Hazard does not fit the Hazard is more severe Hazard is less severedescriptions in Tables2.3 through 2.6Size of hazard Very large Very smallTraffic volume Above 1,000 vpd Below 400 vpdHazard on inside ofhorizontal curve350 m (1,150 ft) or smallerradiusRadius larger than 400 m(1,430 ft)Hazard on a5 percent or greater Less than 3 percentdowngradeCrash history Clear crash pattern No crash patternAnticipated cost of Expected costs are low Expected costs are highbarriersRoadway cross Severe section elements Good section elementssectionMultiple hazards exist Many additional hazardsat the siteAesthetic impactsSerious concernsEnvironmental impactsSerious concernsTable 2.8 is intended as a guideline for barrier considerations. It is likely that specificsites will have some considerations identified in both columns and some in neithercolumn. The considerations are not necessarily equal in importance.Appendix A contains a more quantifiable procedure that is based on economic analysis.2.5.4 Bridge Rail EndsBridge rail ends on the right side of approaching traffic (near side) are rigid objects,frequently very near the traveled way. Because of their severity, they should never beconsidered “not warranted.” Even though the warranting tables in Appendix A mightindicate a bridge rail is not warranted, it should be considered “possibly warranted” andat least considered for shielding. The far side bridge rail will usually be outside the clearzone of opposing traffic for most low volume and low speed conditions. When the farside is outside the clear zone it still should be considered for shielding if any of thefollowing conditions exist:The travel lanes are 3 m (10 ft) or less.Passing is allowed and expected.There is a crash pattern.________________________________________________________________________2-18 Analyze the Need for Roadside Barriers
Barrier Warrants ________ November 20052.6 EXAMPLE PROBLEMSThe following are example applications of the warranting process described in thischapter. Appendix A includes the same example problems using the warrantingprocedures described in the appendix.Problem 1Roadway data:Traffic data:Hazard data:Other issues:A two-lane road, with 3.6 m (12 ft) lanes and 1.2 m (4 ft) pavedshoulders. There is a tangent section and a 46 m (150 ft)-longhorizontal curve on a 240 m (800 ft) radius. The whole section ison a 3 percent downward grade.400 present ADT with a 3 percent annual growth factor. Designspeed is 50 km/h (30 mph). On the tangent section actual speedsmay exceed the design speed.The hazard is a 1V: 2H foreslope 18 m (60 ft) high, offset 1.8 m(6 ft) from the edge of travel way on the outside of the horizontalcurve. The slope is 150 m (500 ft) parallel to the road, includingboth the horizontal curve and the tangent section. There aresome scattered trees and small boulders on the slope.Because of the remote location, barrier construction is expected tobe costly. There are no crash data available. There are noaesthetic or environmental issues.Solution:1. The hazard is at an offset of 1.2 m (6 ft). From Table 2.1, the clear zone range is 1.0- 2.0 m (3 - 7 ft). From Table 2.2, the horizontal curve adjustment factor is 1.2. Thehigher end of the range is selected as the desired clear zone because of theseriousness of the hazard. Therefore, the slope is within the clear zone in both thetangent and curved sections. The slope is outside the clear zone for opposing traffic.2. From Table 2.5, the slope is a Category 3 hazard so a barrier should be considered.3. From Table 2.8, the following considerations apply to the possible use of barriers:Reasons to Use Barriersa. The hazard is on the outside of a horizontal curve (for some of thesection)b. The hazard is more severe that the description in Table 2.4c. The hazard is larged. There are multiple hazards at the siteReasons Not to Use Barriers________________________________________________________________________Example Problems 2-19
Barrier Warrants ________ November 2005a. The hazard is on a tangent (on some of the section)b. The traffic volume is lowc. The downgrade is not very steepd. Costs of a barrier are expected to be highe. Roadway section elements are goodBecause of the hazardousness of the site, it appears that a barrier is warrantedat least on the horizontal curve section of this road. Barriers may be appropriateon the tangent, but the warrant is less clear.Problem 2Roadway data:Traffic data:Hazard data:Other issues:A two-lane road, with 3.6 m (11 ft) lanes and 0.6 m (2 ft) pavedshoulders. This is a flat and tangent section. The roadwayapproaches a bridge across a river. On the approach the roadleaves a cut section with a 1V; 6H foreslope to a ditch, and thenapproaches the bridge on a fill with 1V: 3H side slopes. The slopebreak for the fill is 0.6 m (2 ft) from the edge of the shoulder. Thefill is approximately 2.4 m (8 ft) high. On the far side a similar fillextends 60 m (200 ft) where the fill flattens to 1V: 4H. There areno pavement markings on the road or the bridge.1,100 present ADT with a 1 percent annual growth factor. Designspeed is 70 km/h (45 mph).An 8.5 m (28 ft) wide bridge crosses a river with water depths ofapproximately 1.5 m (5 ft). The bridge rail is a vertical concretewall.This roadway is in a park with serious aesthetic concerns.Solution:1. Table 2.1 shows the clear zone range is 4.5 - 5.0 m (14 - 16 ft). Assuming 3.3 M (11ft) lanes on the bridge, the bridge rail is located 1.0 m (3 ft) from the traveled wayand is in the clear zone. The bridge rail on the opposing traffic side is outside theclear zone. The 1V: 3H slope is traversable but not recoverable, so the approachclear zone is (using the mid-point of the range):CZ = 4.7 + (3 * 2.4) = 11.9 mOr, CZ = 15 + (3 * 8) = 39 ftThe river is also in the clear zone.2. Tables 2.3 and 2.6 indicate that both the bridge rail and the river are Category 3hazards so a barrier should be considered.________________________________________________________________________2-20 Example Problems
Barrier Warrants ________ November 20053. From Table 2.8, the following considerations apply to the possible use of barriers:Reasons to Use Barriersa. Speed is highb. The hazards are more severe that the description in Table 2.4c. Traffic volume is highd. There are multiple hazards at the siteReasons Not to Use Barriersa. The hazard is on a tangentb. There is no downgradec. There are aesthetic concernsBarriers are recommended for both approach sides to the bridge. Barriers are notneeded on the far sides because the bridge rails are outside the opposing traffic clearzones.________________________________________________________________________Example Problems 2-21