Activated Sludge Design, Startup, Operation, Monitoring and ...
Activated Sludge Design, Startup, Operation, Monitoring and ...
Activated Sludge Design, Startup, Operation, Monitoring and ...
- No tags were found...
You also want an ePaper? Increase the reach of your titles
YUMPU automatically turns print PDFs into web optimized ePapers that Google loves.
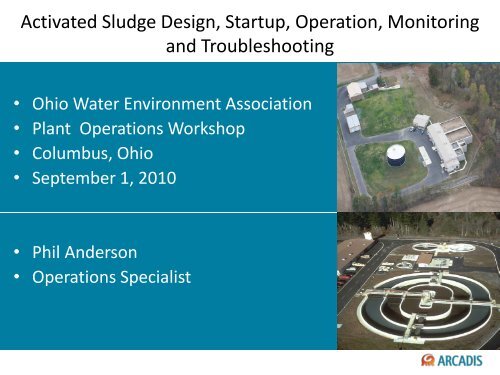
<strong>Activated</strong> <strong>Sludge</strong> <strong>Design</strong>, <strong>Startup</strong>, <strong>Operation</strong>, <strong>Monitoring</strong><strong>and</strong> Troubleshooting• Ohio Water Environment Association• Plant <strong>Operation</strong>s Workshop• Columbus, Ohio• September 1, 2010• Phil Anderson• <strong>Operation</strong>s Specialist
<strong>Design</strong> - <strong>Activated</strong> <strong>Sludge</strong>• <strong>Design</strong> Team• Treatment Goals• <strong>Activated</strong> <strong>Sludge</strong> Processes• Engineering St<strong>and</strong>ards• Preliminary Treatment• Tertiary Treatment
Treatment Goals• BOD Removal– Dissolved wastes are consumed as food by theactivated sludge microbes <strong>and</strong> converted to biomass,water, carbon dioxide, <strong>and</strong> other gases• Nitrification– The process through which ammonia is oxidized tonitrite <strong>and</strong> nitrate• Denitrification– A process by which nitrates <strong>and</strong> nitrites are convertedto gaseous end products, primarily nitrogen gas.
<strong>Activated</strong> <strong>Sludge</strong> ProcessesConventional – CBOD Removal• Plug or Step FeedSingle-Stage NitrificationOxidation Ditch - Vertical LoopReactorExtended AerationMBRBNR
Additional Processes• Preliminary Treatment–Screening–Grit Removal• Tertiary Treatment– Filters• Solids H<strong>and</strong>ling• Recycle Flows
<strong>Design</strong> – EngineeringSt<strong>and</strong>ards• <strong>Design</strong> of Municipal WastewaterTreatment Plants WEF Manual ofPractice No. 8• Wastewater Engineering, Treatment ,Disposal, ReuseMetcalf & Eddy
<strong>Design</strong> – Engineering St<strong>and</strong>ardsRecommended St<strong>and</strong>ards for Wastewater FacilitiesPolicies for the <strong>Design</strong>, Review, <strong>and</strong> Approval of Plans <strong>and</strong>Specifications for Wastewater Collection <strong>and</strong> TreatmentFacilitiesMEMBER STATES AND PROVINCEIllinois Indiana Iowa Michigan Minnesota MissouriNew York Ohio Ontario Pennsylvania WisconsinTen States St<strong>and</strong>ards
• PhysicalProcess <strong>Design</strong>–Aeration Tank Capacity - lbs.CBOD/1000 CF of Aeration–Temperature – Summer/Winter–Final Settling – Circular Center Feed orPeripheral Feed
Process <strong>Design</strong>Chemical–Ammonia Loading - Nitrification–Phosphorous Loading & Removal–pH & Alkalinity
Process <strong>Design</strong>• Biological–CBOD Loading – 15lbs – 40 lbs–D.O. in Aeration - 1.1 CBOD – 4.6 NH3–MLSS, MLVSS, RAS–F/M Ratio - 0.5 – 1.0 – 2.0–MCRT Days
NitrificationNH 3 NO 2-NO 3-• Nitrosomonas, Nitrobacter• Aerobic process (in the presence of DO)• 4.6 lbs O 2 required per lb ammonianitrogen• 7.14 lb alkalinity is consumed per poundof ammonia nitrogen• pH sensitive with optimal range between7.5 <strong>and</strong> 8.6
DenitrificationNO 3-NO 2-NO N 2 O N 2• Anoxic process (not in the presence of DO)• Nitrification can decrease pH• Denitrification recovers 3.57 lb alkalinity per lb ofnitrogen removed• DO is consumed by nitrification <strong>and</strong>denitrification recovers 2.9 lb per lb of nitrogenremoved
Plant <strong>Startup</strong>• Contractor – Wants to push to startup• What are Ohio EPA expectations?• Manufacturer Checkout• Operator Training – Are You Ready• What additional processes are available• Do you <strong>and</strong> your Engineer have a ProcessControl Plan• Are you seeding the aeration tanks?
Plant <strong>Operation</strong>• Summer/Winter• Dry Weather/Wet Weather• DO Control• RAS Rate - % 0f Influent Flow• Chemical Feed• Wasting <strong>Sludge</strong> – Biological & Chemical
Summer Verses WinterSummer•MCRT - 22.17 days•F/M Ratio - 0.13•BOD Loading Rate - 16.5lbs./1,000 cf•Required MCRT No.2 - 7.6 days•DT for BOD Oxidation - 13.20hours•DT for NH3 Oxidation - 2.64hours•Aeration Tanks Required - 4.0•MLSS - 3,000 mg/l•MLVSS - 2,100 mg/lWinter•MCRT - 35.47 days•F/M Ratio - 0.08•BOD Loading Rate - 16.5lbs./1,000 c.f.•Required MCRT No.2 - 13.7days•DT for BOD Oxidation - 13.15hours•DT for NH3 Oxidation = 2.71hours•Aeration Tanks Required - 4.0•MLSS - 4,800 mg/l•MLVSS - 3,360 mg/l
Plant <strong>Operation</strong>• Summer/Winter• Dry Weather/Wet Weather• DO Control• RAS Rate - % 0f Influent Flow• Chemical Feed• Wasting <strong>Sludge</strong> – Biological & Chemical
Plant <strong>Monitoring</strong>• Regular Rounds – Visual• Aeration Tanks & FST• Blowers/Aerators• RAS Pumps• Clarity of the Effluent
Plant <strong>Monitoring</strong>• SCADA – Trending Flow, DO, ORP, pH• Regular Rounds – Visual• Trending Instruments - Flow, DO,ORP, pH• Lab Data – MLSS, RAS, Settling• Microbiology
Troubleshooting• Foaming• Bulking• Solids Loss• Turbid Effluent• Odor• No CBOD or Ammonia Removal
Holy Crap!!
Observation of Settlometer Test
Characteristic <strong>Sludge</strong> Settling1000800SSV600400FastNormalSlow20000 30 60 90 120 150 180Time (minutes)
Length of Settleometer Test• Normal - 30 minutes to 2hours - until completecompaction• Extended - until thesludge begins to rise
Look Under the Microscope
The Bugs - Good/Bad/Ugly
Nocardia
Microthrix parvicella
Filaments 1851 <strong>and</strong> 0041
Filament Type 0092
Filament type 0092
WWTP: WWTPPhil Anderson - ARCADISp<strong>and</strong>erson@arcadisus.comBy:Summer Summary<strong>Operation</strong>: <strong>Activated</strong> <strong>Sludge</strong> Date:Summer 2009 3,000 MLSS, mg/l MCRT 7.30 days20.0 Degrees C F/M Ratio 0.24MEAN CELL RESIDENCE TIME (MCRT) 7.1 pH BOD Loading Rate 33.54lbs./1,000 c.f.5.0 D.O. Aeration Required MCRT No.1 3.61 days20.0 Influent Ammonia 1.7 Effluent Ammonia Required MCRT No.2 3.93 daysINPUT DATA: 6 Aeration Tanks On Line DT for BOD Oxidation 6.02hoursa 2.827 (MG) - Aeration tank volume (total) 0.471 Aeration Tank MG Each DT for NH3 Oxidation 1.49hoursb 2,250 (mg/l) - Mixed liquor VOLATILE suspended solids (MLVSS) Aeration Tank Vol Required 2.38MGc 0.033 (MGD) - Daily flowrate of waste activated sludge (WAS) [See below] Aeration Tanks Required 5.05d 10,000 (mg/l) - WAS suspended solids Aeration Tanks On Line 6.00e 7.600 (MGD) - Plant flow MLSS 3,000mg/lf 10 (mg/l) - Effluent suspended solids MLVSS 2,250 mg/lNitrifiers (8% of MLVSS)180 mg/lSUPPLEMENTAL CALCULATIONS (MLVSS):a 3,000 (mg/l) Assumed mixed liquor suspended solids (MLSS) EFF LIMITb 75.0 (%) - Assumed percent volatile CBOD Weekly 15 mg/l2,250 (mg/l) - MLVSS TSS Weekly 18 mg/lWASTE SLUDGE VOLUME:Fecal Weekly 2,000 (S Only)a 0.70 Assumed sludge yield (lb. SS generated/lb. BOD removed) Ammonia WK 1.7 mg/l (S Only)b 7.600 (MGD) - Plant flow Ammonia Winter WK NAc 200 (mg/l) - BOD concentration entering aeration tanks P Weekly 1.5 mg/ldefhi10 (mg/l) - BOD concentration following settling8,430 lbs. biological sludge/day10.0 (mg/l) - chemical sludges produced634 lbs. chemical (Fe/AL) sludge generated/day9,064 Total lbs. WAS/dayj 10,000 (mg/l) - Assumed WAS concentration (Note: 10,000 mg/l = 1.0%)k0.109 (MGD) - Waste activated sludge quantityMCRT 7.30 days F/M Ratio = 0.24BOD Loading Rate =33.5 lbs./1,000 c.f.
BOD Loading Rate =33.5 lbs./1,000 c.f.Phil Anderson - ARCADISWWTP: WWTP By: p<strong>and</strong>erson@arcadis-us.com Winter Summary<strong>Operation</strong>: <strong>Activated</strong> <strong>Sludge</strong> Date:Winter 4,500 MLSS, mg/l MCRT 10.95 days11.0 Degrees C F/M Ratio 0.16MEAN CELL RESIDENCE TIME (MCRT) 7.0 pH BOD Loading Rate 33.54lbs./1,000 c.f.4.0 D.O. Aeration Required MCRT No.1 12.00 days20.0 Influent Ammonia 4.0 Effluent Ammonia Required MCRT No.2 8.66 daysINPUT DATA: 6 Aeration Tanks On Line DT for BOD Oxidation 10.96hoursa 2.827 (MG) - Aeration tank volume (total) 0.471 Aeration Tank MG Each DT for NH3 Oxidation 2.13hoursb 3,375 (mg/l) - Mixed liquor VOLATILE suspended solids (MLVSS) Aeration Tank Vol Required 3.47MGc 0.109 (MGD) - Daily flowrate of waste activated sludge (WAS) [See below] Aeration Tanks Required 7.36d 10,000 (mg/l) - WAS suspended solids Aeration Tanks On Line 6.00e 7.600 (MGD) - Plant flow MLSS 4,500mg/lf 10 (mg/l) - Effluent suspended solids MLVSS 3,375 mg/lNitrifiers (8% of MLVSS)270 mg/lSUPPLEMENTAL CALCULATIONS (MLVSS):a 4,500 (mg/l) Assumed mixed liquor suspended solids (MLSS) EFFLUENT LIMITSb 75.0 (%) - Assumed percent volatile CBOD Weekly 15 mg/l3,375 (mg/l) - MLVSS TSS Weekly 18 mg/lFecal Weekly 2,000 (S Only)WASTE SLUDGE VOLUME:Ammonia WK 1.7 mg/l (S Only)a 0.70 Assumed sludge yield (lb. SS generated/lb. BOD removed) Ammonia Winter WK NAb 7.600 (MGD) - Plant flow P Weekly 1.5 mg/lcdefhi200 (mg/l) - BOD concentration entering aeration tanks10 (mg/l) - BOD concentration following settling8,430 lbs. biological sludge/day10.0 (mg/l) - chemical sludges produced634 lbs. chemical (Fe/AL) sludge generated/day9,064 Total lbs. WAS/dayj 10,000 (mg/l) - Assumed WAS concentration (Note: 10,000 mg/l = 1.0%)k0.109 (MGD) - Waste activated sludge quantityMCRT 10.95 days F/M Ratio = 0.16
Figure 1 Effect of MCRT On Nitrification10090807060Percent (%)504030201001 2 3 4 5 6 7 8 9 10 11 12 13 14 15 16 17 18 19 20 21 22 23 24 25 26 27 28 29 30MCRT (Days)Nitrification Efficiency %
Figure 2 Relationship Between MCRT <strong>and</strong> F/M Ratio0.600.500.40F/M Ratio0.300.200.100.001 2 3 4 5 6 7 8 9 10MCRT, DaysRatio
20Figure 3 Ammonia Removal vs Time181614Ammonnia, mg/l1210864201 2 3 4 5 6 7 8 9 10 11 12 13 14 15Time (in 1/4 Hours)Ammonia
100Figure 4 Effect of Temperature On Nitrification90807060Percent (%)504030201001 2 3 4 5 6 7 8 9 10 11 12 13 14 15 16 17 18 19 20 21 22 23 24 25 26 27 28 29 30Temperature (C)Removal Rate %
0.12Figure 5 Effect of D.O. on Nitrification0.100.08Lb.NH/Lb. MLSS/Day0.060.040.020.001 2 3 4 5 6Dissolved OxygenNH3 Oxidation Rate
Figure 6 Effect of pH on Nitrification10090807060Precent (%)504030201001 2 3 4 5 6 7 8 9 10pHMaximum Nitrification Rate (%)
400Figure 7 Alkalinity Used in Nitrification350300250Alkalinity mg/l2001501005001 2 3 4 5Influent Ammonia (mg/l x 10)Alkalinity Required mg/l
Maumee River WWTP
DO Probe
Single Stage Blower
Center Feed FST
Center Feed FST
Peripheral Feed FST
Peripheral Feed FST
Center Feed FST
QUESTIONS???PHIL.ANDERSON@ARCADIS-US.COM


