DIGESTER GAS ENERGY RECOVERY ALTERNATIVES
DIGESTER GAS ENERGY RECOVERY ALTERNATIVES
DIGESTER GAS ENERGY RECOVERY ALTERNATIVES

You also want an ePaper? Increase the reach of your titles
YUMPU automatically turns print PDFs into web optimized ePapers that Google loves.
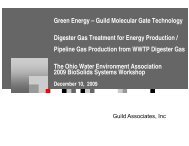
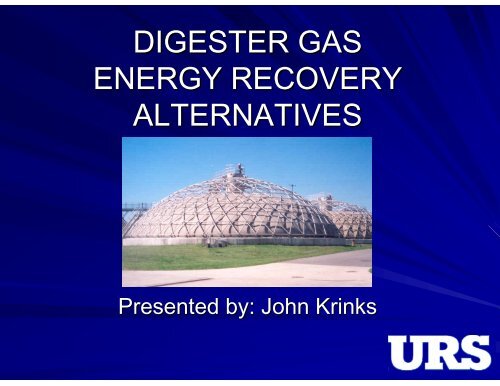
<strong>DIGESTER</strong> <strong>GAS</strong><strong>ENERGY</strong> <strong>RECOVERY</strong><strong>ALTERNATIVES</strong>Presented by: John Krinks
Presentation OverviewDigester Gas Production and CharacterizationGas Production Rates at JPWWTP & SWWTPProject-Specific Goals at JPWWTP & SWWTPDigester Gas Cleaning & Energy RecoveryAlternatives
Digester Gas ProductionAnaerobic digestion: 50 to 65% of VSS destroyedSRT (days) % Reduced30 65.520 6015 5610 5012 to 18 ft 3 digester gas produced per pound of VSSdestroyedRule of thumb: 9,000 to 12,000 ft 3 per day of digestergas per million gallons of plant capacity
JPWWTP Digester Gas ProductionAvg. Gas Production & Usage (Jan ‘07– Dec ‘07)2007 JPWWTP Gas UsageAverage Daily GasProduction (CFD)1,400,0001,200,0001,000,000800,000600,000400,000200,000Waste GasPlant BoilersSludge BoilersIncinerators0JanuaryFebruaryMarchAprilMayJuneJulyAugustSeptemberOctoberNovemberDecemberMonthTotal Gas: Monthly average range of 800,000 to 1,200,000 CFD“Waste Gas” Monthly average range of 57,000 to 790,000 CFD
SWWTP Digester Gas ProductionAt time of study, there was no anaerobic digestionat Southerly– S66 improvements incorporate two-stage acid-phasedigestionEstimated average gas production & usage:Gas UsageBoilersIncinerators“Waste” GasTotalGas Flow Rate(CFD)509,000158,000380,0001,046,000Gas Flow Rate(CFM)353109264726
Digester Gas CompositionMethane, CH 4 (55 to 70%)Carbon Dioxide, CO 2 (30 to 45%)Trace Amounts of the following:– Hydrogen Sulfide H 2 S– Siloxanes,Heating value of 530 to 675 BTU / ft 3
Digester Gas Trace ConstituentsHydrogen Sulfide– Up to 10,000 ppm H 2 S (typically 40 to 1,000 ppm)– Combustion in presence of water vapor results in H 2 SO 4– “Pipeline quality” requires < 4 ppm H 2 SSiloxanes– By-product of cosmetics and toiletries– Typically 2 to 4 ppm siloxanes– Damage to equipment can occur atlevels approaching 50 ppb
Digester Gas Cleaning Technologies
Hydrogen Sulfide RemovalSorption techniques– Activated Carbon, Iron SpongeChemical addition– Iron Salts (Ferric chloride)Scrubbing with liquid mediaPackaged SystemsSorption media columnsLiquid Scrubbers
Siloxane RemovalSorption Systems– Siloxane-specific mediaLiquid ScrubbingCondensationPackaged Systems
Carbon Dioxide RemovalGenerally not harmful for engine operation“Pipeline Gas” requires 2% maximum CO 2Removed with:– Liquid scrubbers– Membrane separation technologiesPackaged Systems available
Cleaning System CostsHydrogen Sulfide– Cleaning system: ~ $100,000 per 100 CFM– Operation ~ $7,000 per year per 100 CFMSiloxanes– Cleaning system ~ $190,000 per 100 CFM– Operation ~ $15,000 per year per 100 CFMCarbon Dioxide / Nitrogen Removal– Cleaning System: ~ $220,000 per 100 CFM– Operation: ~ $30,000 per 100 CFM
Levels of TreatmentPipeline Quality Gas On-Site Energy GenerationTreatment ATreatment BCarbon dioxide (< 2%)Hydrogen Sulfide (< 10 ppm)Water Vapor (< 7 lb/MMSCF) Siloxanes (< 50 ppb)Hydrogen Sulfide (< 4 ppm)Siloxanes (< 30 ppb)~ 98% MethaneTrace inert gases~ 55 to 65% Methane~ 35 to 45% Carbon DioxideReduced Constituents OtherInert Gases
Alternatives - CogenerationTypical electrical efficiency: 28 to 33% efficientPer 1 MGD of plant capacity*:– 500 to 600 kWh per day generated– $15,000 + per year in electricity savingsTypical thermal efficiency: 45 to 60% efficientPer 1 MGD of plant capacity*– 3 to 3.5 MMBTU per day in recoverable heat– $7,000 + per year in natural gas savings* Assuming no other usage of digester gas
Possible Implementation of ElectricityGenerating Engine at JPWWTP & SWWTPPlantAverage GasFlowEngineSizekWh perMonthGeneratedPlant MonthlyPower UsagePercent of PlantPower UsageJackson Pike 240,000 CFD 570 kW 411,000 kWh 4.51 MM kWh 9%Southerly 380,000 CFD 900 kW 651,000 kWh 5.03 MM kWh 13%JPWWTP: $390,000 per year in electrical savingsSWWTP: $625,000 per year in electrical savingsGE Jenbacher Engine– Approx $100,000 per 100 kW
Possible Implementation of Direct DriveEngine at JPWWTP & SWWTPJPWWTP: Operation of 400 HP fluidized bedincinerator blower– Electrical savings of ~ $210,000 / yearSWWTP: Operation of 700 HP center aeration blower– Electrical savings of ~ $365,000 / yearBrake Horsepower9008007006005004003002001000Brake Horsepower vs Digester Gas FlowSWWTP CENTER AERATIONBLOWERFLUIDIZED BED INCINERATORBLOWER0 50000 100000 150000 200000 250000Digester Gas Flow (CFD)Cost of approximately$30,000 per 100 HPcapacity
Alternatives – Clean Natural Gas SaleOption 1: Public / Private Partnership– Gas cleaning system ($1.5 million) provided by private company– City pays electrical costs– City and private company split revenue of gas saleJPWWTP Revenue from Pipeline Sale$25,000$20,000Monthly Income$15,000$10,000$5,000Income from SaleElectric Costs$0JanuaryFebruaryMarchAprilMayJuneJulyAugustSeptemberOctoberNovemberDecemberMonthJPWWTP (2007 data) net revenue of $95,000– $170,000 in gas sale (after 50 / 50 split)– $75,000 in annual electric cost
Alternatives – Clean Natural Gas SaleOption 2: Gas cleaning system owned by CityJPWWTP (2007 data) net revenue of $125,000– $340,000 in gas sale– $75,000 in annual electric cost– $115,000 in amortized annual payment– $25,000 in miscellaneous operation and maintenance
Alternatives – CNG VehiclesInstallation at SWACO (Green Energy Center)– Phase 1 ($4.5 Million) can process 430,000 CFD landfill gas– Cleaning system and microturbine in pre-engineered metal building– Compressor and storage (3,000 and 3,600 psi tanks) located outside– Filling stationsCNGstoragetanksCNG fillingstationCompressorFacilityBuilding
Alternatives – CNG VehiclesCost analysis for implementation at SWWTP, based on:– Sell gas not used for CNG to pipeline at $7.00 per MMBTU– Capital cost of $4,000,000 amortized at 4.5% interest– Electrical costs of 8 cents per kWh– Additional O&M expense of $25,000 per year– CNG demand of 100 GGE per dayCNG cost of approximately $1.60 per GGE for “break even”
Summary and ConclusionsElectrical and thermal energy savings– Electrical: $15,000 + per year per MGD of plant capacity– Heating: $7,000 + per year per MGD of plant capacityElectrical and thermal recovery system costs– Return on investments ~ 3 to 7 yearsClean natural gas and CNG– Public / private partnerships or facility-owned– Not profitable for smaller plantsVarying energy costs can have substantialimpact on the return on investment
Questions