Global Tuberculosis Report -- 2012.pdf
Global Tuberculosis Report -- 2012.pdf
Global Tuberculosis Report -- 2012.pdf

Create successful ePaper yourself
Turn your PDF publications into a flip-book with our unique Google optimized e-Paper software.
GLOBALTUBERCULOSISREPORT2012
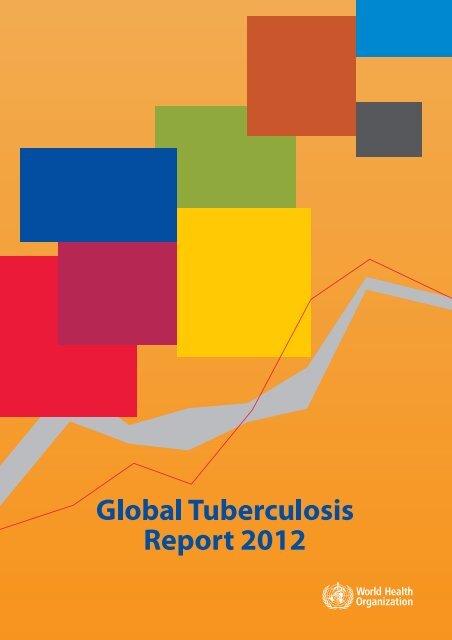
WHO Library Cataloguing-in-Publication Data<strong>Global</strong> tuberculosis report 2012.1.<strong>Tuberculosis</strong> – epidemiology. 2.<strong>Tuberculosis</strong>, Pulmonary – prevention and control.3.<strong>Tuberculosis</strong> – economics. 4.Directly observed therapy. 5.Treatment outcome. 6.National healthprograms – organization and administration. 7.Statistics. I.World Health Organization.ISBN 978 92 4 156450 2 (NLM classification: WF 300)© World Health Organization 2012All rights reserved. Publications of the World Health Organization are available on the WHO web site (www.who.int) or can be purchasedfrom WHO Press, World Health Organization, 20 Avenue Appia, 1211 Geneva 27, Switzerland (tel.: +41 22 791 3264; fax:+41 22 791 4857; e-mail: bookorders@who.int). Requests for permission to reproduce or translate WHO publications – whether forsale or for noncommercial distribution – should be addressed to WHO Press through the WHO web site (http://www.who.int/about/licensing/copyright_form/en/index.html).The designations employed and the presentation of the material in this publication do not imply the expression of any opinion whatsoeveron the part of the World Health Organization concerning the legal status of any country, territory, city or area or of its authorities,or concerning the delimitation of its frontiers or boundaries. Dotted lines on maps represent approximate border lines for whichthere may not yet be full agreement.The mention of specific companies or of certain manufacturers’ products does not imply that they are endorsed or recommended bythe World Health Organization in preference to others of a similar nature that are not mentioned. Errors and omissions excepted, thenames of proprietary products are distinguished by initial capital letters.All reasonable precautions have been taken by the World Health Organization to verify the information contained in this publication.However, the published material is being distributed without warranty of any kind, either expressed or implied. The responsibility forthe interpretation and use of the material lies with the reader. In no event shall the World Health Organization be liable for damagesarising from its use.Cover design by Tom Hiatt, Western Pacific Regional Office, WHO. The front cover illustrates the contribution of different sourcesof funding to TB care and control in low-income countries, highlighting the importance of international donor funding (colouredblocks) compared with domestic contributions (grey band) as well as the role of the <strong>Global</strong> Fund (red line) that is the leading sourceof international donor funding globally; see Figure 5.5. The back cover illustrates the impressive reduction in TB prevalence in Cambodia,a low-income and high-burden country, between 2002 (when a baseline national TB prevalence survey was implemented) and2011 (when a repeat national TB prevalence survey was implemented); see Box 2.7 in Chapter 2.Designed by minimum graphicsPrinted in FranceWHO/HTM/TB/2012.6
ContentsAbbreviationsivAcknowledgementsvExecutive summary 1Chapter 1. Introduction 3Chapter 2. The burden of disease caused by TB 8Chapter 3. TB case notifications and treatment outcomes 29Chapter 4. Drug-resistant TB 41Chapter 5. Financing TB care and control 52Chapter 6. Diagnostics and laboratory strengthening 66Chapter 7. Addressing the co-epidemics of TB and HIV 74Chapter 8. Research and development 82Annexes1. Methods used to estimate the global burden of disease caused by TB 912. Country profiles 1053. Regional profiles 1294. <strong>Global</strong>, regional and country-specific data for key indicators 137GLOBAL TUBERCULOSIS REPORT 2012iii
AbbreviationsAFBAFRAIDSAMRARIARTBCGBRICSCDRCPTCBCDOTDOTSDR-TBDRSDSTECDCEMREQAERREUEURFINDGDPGLIacid-fast bacilliWHO African Regionacquired immunodeficiency syndromeWHO Region of the Americasannual risk of infectionantiretroviral therapyBacille-Calmette-GuérinBrazil, Russian Federation, India,China, South Africacase detection rateco-trimoxazole preventive therapycommunity-based TB caredirectly observed treatmentthe basic package that underpins theStop TB Strategydrug-resistant tuberculosisdrug resistance surveillance or surveydrug susceptibility testingEuropean Centre for Disease Preventionand ControlWHO Eastern Mediterranean RegionExternal quality assuranceElectronic recording and reportingEuropean UnionWHO European RegionFoundation for Innovative NewDiagnosticsgross domestic product<strong>Global</strong> Laboratory Initiative<strong>Global</strong> Fund The <strong>Global</strong> Fund to fight AIDS,<strong>Tuberculosis</strong> and Malaria<strong>Global</strong> Plan <strong>Global</strong> Plan to Stop TB, 2011–2015GNI gross national incomeHBC high-burden country of which there are22 that account for approximately 80%of all new TB cases arising each yearHIV human immunodeficiency virusICD-10 International Classification of Diseases(tenth revision)IGRAIPTIRRLEDLPAMDGMDR-TBNGONTPPEPFARPOCPPMSEARSRLTBTB-TEAMTSTUNAIDSUNITAIDUSAIDVRWHAWHOWPRXDR-TBZNinterferon-gamma release assayisoniazid preventive therapyincidence rate ratioLight-emitting diodeLine-probe assayMillennium Development Goalmultidrug-resistant tuberculosis(resistance to, at least, isoniazid andrifampicin)nongovernmental organizationnational tuberculosis control programmeor equivalentUS President’s Emergency Plan for AIDSReliefpoint-of-carePublic–Private MixWHO South-East Asia Regionsupranational reference laboratorytuberculosis<strong>Tuberculosis</strong> Technical AssistanceMechanismtuberculin skin testJoint United Nations Programme on HIV/AIDSinternational facility for the purchase ofdiagnostics and drugs for diagnosis andtreatment of HIV/AIDS, malaria and TBUnited States Agency for InternationalDevelopmentVital registrationWorld Health AssemblyWorld Health OrganizationWHO Western Pacific RegionExtensively drug-resistant TB, definedas MDR-TB plus resistance to afluoroquinolone and at least one of threeinjectable second-line drugs (amikacin,kanamycin or capreomycin)Ziehl Neelseniv GLOBAL TUBERCULOSIS REPORT 2012
AcknowledgementsThis report on global tuberculosis care and control was produced by a core team of 13 people: Hannah Monica Dias,Dennis Falzon, Christopher Fitzpatrick, Katherine Floyd, Philippe Glaziou, Tom Hiatt, Christian Lienhardt, Linh Nguyen,Charalambos Sismanidis, Hazim Timimi, Mukund Uplekar, Wayne van Gemert and Matteo Zignol. The team wasled by Katherine Floyd. Overall guidance was provided by the Director of the Stop TB Department, Mario Raviglione.The data collection forms (long and short versions) were developed by Philippe Glaziou and Hazim Timimi, withinput from staff throughout the Stop TB Department. Hazim Timimi led and organized all aspects of data management.Christopher Fitzpatrick, Inés Garcia and Andrea Pantoja conducted all review and follow-up of financial data. Thereview and follow-up of all other data was done by a team of reviewers that included Annabel Baddeley, AnnemiekeBrands, Hannah Monica Dias, Dennis Falzon, Linh Nguyen, Hazim Timimi, Wayne van Gemert and Matteo Zignol inWHO headquarters, Tom Hiatt in the Western Pacific Regional Office, and Suman Jain, Sai Pothapregada and MohammedYassin from the <strong>Global</strong> Fund. Data for the European Region were collected and validated jointly by the WHORegional Office for Europe and the European Centre for Disease Prevention and Control (ECDC), an agency of theEuropean Union based in Stockholm, Sweden.Philippe Glaziou and Charalambos Sismanidis analysed surveillance and epidemiological data and prepared thefigures and tables on these topics, with assistance from Tom Hiatt. Tom Hiatt, Linh Nguyen and Annabel Baddeleyanalysed TB/HIV data and prepared the associated figures and tables. Dennis Falzon and Matteo Zignol analysed dataand prepared the figures and tables related to drug-resistant TB, with assistance from Shu-Hua Wang. ChristopherFitzpatrick analysed financial data, and prepared the associated figures and tables. Tom Hiatt and Wayne van Gemertprepared figures and tables on laboratory strengthening and the roll-out of new diagnostics. Christian Lienhardt andKarin Weyer prepared the figures on the pipelines for new TB drugs, diagnostics and vaccines, with input from therespective Working Groups of the Stop TB Partnership. Tom Hiatt checked and finalized all figures and tables in anappropriate format, ensuring that they were ready for layout and design according to schedule, and was the focal pointfor communications with the graphic designer.The writing of the main part of the report was led by Katherine Floyd, with contributions from the following people:Philippe Glaziou, Charalambos Sismanidis and Jinkou Zhao (Chapter 2); Hannah Monica Dias, Haileyesus Getahun,Thomas Joseph and Mukund Uplekar (Chapter 3); Christopher Fitzpatrick and Christian Gunneberg (Chapter 5); andAnnabel Baddeley, Haileyesus Getahun and Linh Nguyen (Chapter 7). Chapter 4, on drug-resistant TB, was preparedby Dennis Falzon and Matteo Zignol, with input from Katherine Floyd, Philippe Glaziou, Ernesto Jaramillo and CharalambosSismanidis. Chapter 6, on diagnostics and laboratory strengthening, was prepared by Wayne van Gemert, withinput from Christopher Gilpin, Fuad Mirzayev and Karin Weyer. Chapter 8, on research and development, was writtenby Christian Lienhardt, Karin Weyer and Katherine Floyd, with input and careful review by the chairs and secretariatsof the Working Groups of the Stop TB Partnership: particular thanks are due to Michael Brennan, Uli Fruth and JenniferWoolley (new vaccines); Daniella Cirillo, Philippe Jacon and Alessandra Varga (new diagnostics); and Cherise Scottand Mel Spigelman (new TB drugs). Karen Ciceri edited the entire report.Annex 1, which explains methods used to produce estimates of the burden of disease caused by TB, was writtenby Philippe Glaziou, Katherine Floyd and Charalambos Sismanidis; we thank Colin Mathers of WHO’s Mortality andBurden of Disease team for his careful review and helpful suggestions. The country profiles that appear in Annex 2 andthe regional profiles that appear in Annex 3 were prepared by Hazim Timimi. Annex 4, which contains a wealth ofglobal, regional and country-specific data from the global TB database, was prepared by Tom Hiatt and Hazim Timimi.We thank Pamela Baillie in the Stop TB Department’s TB monitoring and evaluation team for impeccable administrativesupport, Doris Ma Fat from WHO’s Mortality and Burden of Disease team for providing TB mortality dataextracted from the WHO Mortality Database, Michel Beusenberg, Kusha Davar, Chika Hyashi and Yves Souteyrandof WHO’s HIV department for the close collaboration that facilitated joint review and validation of TB/HIV data, andDiana Weil for reviewing and providing helpful comments on the entire report. We also thank Taavi Erkkola, LuisaFrescura and Peter Ghys from UNAIDS for providing TB/HIV data collected as part of the joint reporting process onUniversal Access in the Health Sector and <strong>Global</strong> AIDS Response Progress and for following up TB/HIV-related dataGLOBAL TUBERCULOSIS REPORT 2012v
queries with countries, and Peter Ghys and Karen Stanecki (UNAIDS) for providing epidemiological data that wereused to estimate HIV-associated TB mortality.We thank Sue Hobbs for her excellent work on the design and layout of this report; her contribution, as in previousyears, is greatly appreciated.The principal source of financial support for WHO’s work on monitoring and evaluation of TB control is the UnitedStates Agency for International Development (USAID), without which it would be impossible to produce this reporton global TB care and control. Data collection, validation, analysis, printing and dissemination were also supportedby funding from the governments of Japan and the Republic of Korea. We acknowledge with gratitude their support.In addition to the core report team and those mentioned above, the report benefited from the input of many staffworking in WHO’s regional and country offices and hundreds of people working for national TB programmes or withinnational surveillance systems who contributed to the reporting of data and to the review of report material prior to publication.These people are listed below, organized by WHO region. We thank them all for their invaluable contributionand collaboration, without which this report could not have been produced.Among the WHO staff listed below, we thank in particular Amal Bassili, Andrei Dadu, Tom Hiatt, Khurshid AlamHyder, Daniel Kibuga, Rafael López Olarte, André Ndongosieme, Wilfred Nkhoma, Nobuyuki Nishikiori, AngélicaSalomão, Ward Schrooten, Marithel Tesoro and Henriette Wembanyama for their major contribution to data collection,validation and review.WHO staff in regional and country officesWHO African RegionEsther Aceng, Harura Adamu, Boubacar Abdel Aziz, Inacio Alvarenga, Balde Amadou, Cornelia Atsyor, AyodeleAwe, Sanni Babatunde, Nayé Bah, Marie Barouan, Abera Bekele, Norbert Bidounga, Françoise Bigirimana, ChristineChakanyuka, Gaël Claquin, Peter Clement, Claudina Cruz, Olusoti Daniel, Noel Djemadji, Louisa Ganda, BoingotloGasennelwe, Joseph Imoko, Michael Jose, Joël Kangangi, Nzuzi Katondi, Samson Kefas, Bah Keita, Daniel Kibuga,Hillary Kipruto, Mwendaweli Maboshe, Leonard Mbam Mbam, Azmera Molla, Julie Mugabekazi, André Ndongosieme,Denise Nkezimana, Nicolas Nkiere, Wilfred Nkhoma, Ghislaine Nkone, Ishmael Nyasulu, Laurence Nyiramasarabwe,Samuel Ogiri, Sally Ohene, Amos Omoniyi, Chijioke Osakwe, Philips Patrobas, Angélica Salomão, Neema Simkoko,Desta Tiruneh, Henriette Wembanyama, Assefash Zehaie.WHO Region of the AmericasRoberto del Aguila, Monica Alonso, Arletta Anez, Miguel Aragón, Denise Arakaki, Adriana Bacelar, Eldonna Boisson,Gustavo Bretas, Luis Gerardo Castellanos, Maggie Clay, Rachel Eersel, Gerry Eijkemans, Marcos Espinal, YitadesGebre, Mirtha Del Granado, Mónica Guardo, Jorge Hadad, Rosalinda Hernández, Vidalia Lesmo, Rafael López, TamaraMancero, Wilmer Marquiño, Mario Martínez, Fatima Marinho, Humberto Montiel, Romeo Montoya, Roberto Montoya,José Moya, Kam Mung, Soledad Pérez, Jean Rwangabwoba, Hans Salas, Roberto Salvatella, Thais dos Santos,Ward Schrooten, Alfonso Tenorio, Enrique Vazquez, Jorge Victoria, Anna Volz, Victor Zamora.WHO Eastern Mediterranean RegionAli Akbar, Mohamed Abdel Aziz, Samiha Baghdadi, Amal Bassili, Najwa ElEmam, Sevil Huseynova, Rhida Jebeniani,Wasiq Khan, Hamida Khattabi, Nuzhat Leiluma, Aayid Munim, Ali Reza Aloudel, Karam Shah, Ireneaus Sindani,Bashir Suleiman, Rahim Taghizadeh, Martin Van Den Boom.WHO European RegionEvgeny Belilovsky, Andreea Cassandra Butu, Silvu Ciobanu, Pierpaolo de Colombani, Andrei Dadu, Irina Danilova,Masoud Dara, Alain Disu, Jamshid Gadoev, Gayane Ghukasyan, Ogtay Gozalov, Sayohat Hasanova, Saliya Karymbaeva,Kristin Kremer, Mehmet Kontas, Nikoloz Nasidze, Dmitry Pashkevich, Robertas Petkevicius, Valiantsin Rusovich,Javahir Suleymanova, Vadim Testov, Bogdana Shcherbak-Verlan, Melita Vujnovic.WHO South-East Asia RegionIyanthi Abeyewickreme, Mohammad Akhtar, Vikarunnesa Begum, Vineet Bhatia, Erwin Cooreman, Puneet Dewan,Md Khurshid Alam Hyder, Navaratnasingam Janakan, Rim Kwang Il, Kim Son Il, Franky Loprang, Jorge Luna, ParthaMandal, La Win Maung, Nigor Muzafarova, Ye Myint, Eva Nathanson, Patanjali Nayar, Rajesh Pandav, Razia Pendse,Sri Prihatini, K Rezwan, Ray Serrano, Mukta Sharma, Aminath Shenalin, Achuthan Sreenivas, Chawalit Tantinimitkul,Kim Tong Hyok, Namgyel Wangchuk, Supriya Warusavithana, Sidharta Yuwono.vi GLOBAL TUBERCULOSIS REPORT 2012
WHO Western Pacific RegionShalala Ahmadova, Nino Dayanghirang, Cornelia Hennig, Tom Hiatt, Narantuya Jadambaa, Sung Hye Kim, Woo-JinLew, Yuhong Liu, Giampaolo Mezzabotta, Nobuyuki Nishikiori, Khanh Pham, Fabio Scano, Jacques Sebert, MarithelTesoro, Xuejing Wang, Catharina van Weezenbeek, Rajendra-Prasad Yadav, Dongbao Yu.National respondents who contributed to reporting and verification of datavia the online global data collection systemWHO African RegionOumar Abdelhadi, Abdou-Salam Abderemane, Coulibaly Abdoul Karim, Jean Abena, Felix Afutu, Sofiane Alihalassa,Arlindo Amaral, Géneviève Angue Nguema, Claudina Augusto da Cruz, Fantchè Awokou, Swasilanne Bandeira,Adama Bangoura, Jorge Barreto, Frank Bonsu, Ballé Boubakar, Mahamat Bourhanadine, Miguel Camara, Ernest Cholopray,Nkem Chukwueme, Amadou Cissé, Catherine Cooper, Isaias Dambe, Serge Diagbouga, Aicha Diakité, AwaDiop, Themba Dlamini, S’celo Dlamini, Pierre-Marie Douzima, Said Egwaga, Juan Eyene, Mugabe Frank, Justin Freminot,Ndayikengurukiye Fulgence, Michel Gasana, Evariste Gasana, Ntahizaniye Gérard, Sandile Ginindza, MartinGninafon, Nii Hanson-Nortey, Adama Jallow, Nathan Kapata, Aristide Komangoya-Nzonzo, Patrick Konwloh, JacqueminKouakou, Egidio Langa, Bernard Langat, Gape Machao, Llang Maama-Maime, Jocelyn Mahoumbou, AngeloMakpenon, David Mametja, Farai Mavhunga, Frank Mba Bekolo, Adamou Moustapha, Youwaoga Moyenga, JamesMpunga, Clifford Munyandi, Lindiwe Mvusi, Anne Mwenye, Ronald Ncube, Thaddée Ndikumana, Biruck Negash,Antoine Ngoulou, Emmanuel Nkiligi, M Nkou, Joshua Obasanya, Davidson Ogunade, Hermann Ongouo, Jean Okiata,Maria Palma, Victor Pereira, Martin Rakotonjanahary, Sahondra Randriambeloson, Bakoliarisoa Ranivomahefa, ThatoRaleting, F Rujeedawa, Mohameden Salem, Charles Sandy, Marie Sarr-Diouf, Mineab Sebhatu, Mamie Shoma, JosephSitienei, Nicholas Siziba, Dawda Sowe, Kassim Traore, Abdallahi Traoré, Alie Wurie, Assefash Zehaie, Abbas Zezai, EricZoungranaWHO Region of the AmericasChristian Acosta, Sarita Aguirre, Shalauddin Ahmed, Valentina Alarcón, Xochil Alemán, Valeria Almanza, Raúl Alvarez,Mirian Alvarez, Alister Antoine, Chris Archibald, Carlos Ayala, Wiedjaiprekash Balesar, Draurio Barreira, PatriciaBartholomay, María Bermúdez, Jaime Bravo, Lynrod Brooks, Marta Calona, John Cann, Martín Castellanos, JorgeCastillo, Kenneth Castro, Roxana Céspedes, Gemma Chery, Diana Claxton-Carty, Sonia Copeland, Clara Cruz, Maríade Lourdes, Dy-Juan De Roza, Richard D’Meza, Roger Duncan, Mercedes España, Luis Fernando Fernandez, Hugo Fernandez,Clara Freile, Victor Gallant, Julio Garay, Jennifer George, Izzy Gerstenbluth, Perry Gómez, Silvino González,Lizbeth Guevara, Yaskara Halabi, Dorothea Hazel, Maria Henry, Josefina Heredia, Tania Herrera, Martin Huirse, AlinaJaime, Carla Jeffries, Kathryn Johnston, Ashok Kumar, Athelene Linton, María Llanes, Cecilia Lyons, Eugène Maduro,Marvin Maldonado, Francisco Maldonado, Andrea Maldonado, Marvin Manzanero, Belkys Marcelino, Ada Martínez,Celia Martínez de Cuellar, Zeidy Mata, Timothy McLaughlin-Munroe, Mary Mercedes, Jeetendra Mohanlall, ErnestoMoreno, Alice Neymour, Persaud Nordai, Michael Owen, Gisele Pinto, Tomasa Portillo, Irad Potter, Bob Pratt, EdwinQuinonez, Dottin Ramoutar, Anna Reyes, Leonarda Reyes, Paul Ricketts, Jorge Rodriguez, Adalberto Rodriguez, MariaRodriguez, Mirian Román, Katia Romero, Wilmer Salazar, Joan Simon, Manohar Singh, Sybil Smith, Jackurlyn Sutton,Clarita Torres, Maribelle Tromp, Christopher Trujillo, William Turner, Melisa Valdez, Reina Valerio, Daniel Vazquez,Nestor Vera, Juan Villeda, Asin Virginia, Eva de Weever, Michael Williams, Oritta Zachariah, Elsa Zerbini.WHO Eastern Mediterranean RegionSalama AbouZeid, Naila Abuljadayel, Khaled Abu Rumman, Nadia Abu Sabra, Khadiga Adam, Shahnaz Ahmadi,Amin Al-Absi, Samia Alagab, Abdulbary AlHammadi, Abdul Latif Al-Khal, Mohamed Al Lawati, Saeed Alsaffar, FatmaAl Saidi, Kifah Alshaqeldi, Salah Ben Mansour, Kenza Bennani, Kinaz Cheikh, Walid Daoud, Mohamed Elfurjani,Kamal Elneel, Rachid Fourati, Mohammed Gaafar, Amal Galal, Dhikrayet Gamara, Hawa Guessod, Dhafer Hashim,Kalthoom Hassan, Basharat Javed, Hiba Kamal, Joseph Lasu, Syed Mahmoudi, Alaa Mokhtar, Alaa Mokhtar, MahshidNasehi, Onwar Otien, Ejaz Qadeer, Mulham Saleh, Mohammad Seddiq, Khaled Sediq, Mohammed Sghiar, MohemmedTabena, Hiam Yaacoub.WHO European RegionTleukhan Abildaev, Ibrahim Abubakar, Natavan Alikhanova, Avtandil Alisherov, Ekkehardt Altpeter, Laura Anderson,Delphine Antoine, Gordana Radosavljevic Asic, Andrei Astrovko, Yana Besstraschnova, Oktam Bobokhojaev, OliveraBojovic, Bonita Brodhun, Claire Cameron, Noa Cedar, Daniel Chemtob, Domnica Chiotan, Ana Ciobanu, Nico Cioran,GLOBAL TUBERCULOSIS REPORT 2012vii
Andra Cirule, Thierry Comolet, Radmila Curcic, Manfred Danilovitš, Edita Davidavicene, Hayk Davtyan, Gerard deVries, Mladen Duronjuic, Connie Erkens, Jennifer Fernández, Viktor Gasimov, Lárus Guðmundsson, Walter Haas,Hasan Hafizi, Eugene Hanyukov, Armen Hayrapetyan, Peter Helbling, Gennady Hurevich, Jahongir Ismoilov, MamukaJaparidze, Jerker Jonsson, Maria Korzeniewska-Kosela, Aynura Koshoeva, Mitja Košnik, Gabor Kovacs, Rukije Mehmeti,Donika Mema, Vladimir Milanov, Seher Musaonbasioglu, Joan O’Donnell, Analita Pace-Asciak, Clara Palma, ElenaPavlenko, Gilda Popescu, Bozidarka Rakocevic, Vija Riekstina, Jerome Robert, Elena Rodríguez-Valín, Kazimierz Roszkowski,Petri Ruutu, Roland Salmon, Gerard Scheiden, Brian Smyth, Ivan Solovic, Petra Sorli, Stefan Talevski, OdorinaTello-Anchuela, Mirzogolib Tilleashahov, Dilrabo Ulmasova, Gulnoz Uzakova, Piret Viiklepp, Pierre Weicherding,Aysegul Yildirim, Maja Zakoska, Hasan Zutic.WHO South-East Asia RegionImesha Abeysekara, Aminath Aroosha, Si Thu Aung, Tashi Dendup, Nuruzzaman Haque, Emdadul Hoque, Suksont Jittimanee,Jang Yong Hui, Kashi Kant Jha, Badri Nath Jnawali, Niraj Kulshrestha, Ashok Kumar, Dyah Erti Mustikawati,Costantino Lopes, Thandar Lwin, Chawetsan Namwat, Nirupa Pallewatte, Kiran Rade, Chewang Rinzin, Sudath Samaraweera,Yuwono Sidharta, Choe Kum Song, Asik Surya.WHO Western Pacific RegionPaul Aia, Cecilia Arciaga, Christina Barry, Iobi Batio, Risa Bukbuk, Nou Chanly, Phonenaly Chittamany, Henry Daiwo,Jiloris Dony, Jane Dowabobo, Saen Fanai, Rangiau Fariu, Ludovic Floury, Celina Garfin, Shakti Gounder, XaysangkhomInsisiengmay, Noel Itogo, Nese Conway, Mao Tan Eang, Mayleen Ekiek, Suzana Mohd Hashim, Chou Kuok Hei,Cho En Hi, Nguyen Binh Hoa, Tom Jack, Seiya Kato, Pengiran Ismail, Daniel Lamar, Morisse Laurent, Wang Lixia, LizaLopez, Henri-Pierre Mallet, Khin Mar Kyi Win, Serafi Moa, Johana Ngiruchelbad, Batbayar Ochirbat, Connie Olikong,Sosaia Penitani, Saia Penitani, Faimanifo Peseta, Nukutau Pokura, Waimanu Pulu, Marcelina Rabauliman, BerekaReiher, Bernard Rouchon, Temilo Seono, Cheng Shiming, Sang-sook Shin, Tokuaki Shobayashi, Tieng Sivanna, GrantStorey, Dinh Ngoc Sy, Phannasinh Sylavanh, Kenneth Tabutoa, Markleen Tagaro, Cheuk-ming Tam, Wang Yee Tang,Faafetai Teo-Yandall, Kyaw Thu, Kazuhiro Uchimura, Rosalind Vianzon, Du Xin, Dai Yoshizawa.viii GLOBAL TUBERCULOSIS REPORT 2012
Executive SummaryThe World Health Organization (WHO) <strong>Global</strong> <strong>Tuberculosis</strong><strong>Report</strong> 2012 provides the latest information and analysisabout the tuberculosis (TB) epidemic and progress in TBcare and control at global, regional and country levels. Itis based primarily on data reported by WHO’s MemberStates in annual rounds of global TB data collection. In2012, 182 Member States and a total of 204 countries andterritories that collectively have more than 99% of theworld’s TB cases reported data.Key findings● Progress towards global targets for reductions inTB cases and deaths continues. The MillenniumDevelopment Goal (MDG) target to halt and reversethe TB epidemic by 2015 has already been achieved.New cases of TB have been falling for several years andfell at a rate of 2.2% between 2010 and 2011. The TBmortality rate has decreased 41% since 1990 and theworld is on track to achieve the global target of a 50%reduction by 2015. Mortality and incidence rates arealso falling in all of WHO’s six regions and in mostof the 22 high-burden countries that account for over80% of the world’s TB cases. At country level, Cambodiademonstrates what can be achieved in a lowincomeand high-burden country: new data show a45% decrease in TB prevalence since 2002.● However, the global burden of TB remains enormous.In 2011, there were an estimated 8.7 millionnew cases of TB (13% co-infected with HIV) and 1.4million people died from TB, including almost onemillion deaths among HIV-negative individuals and430 000 among people who were HIV-positive. TB isone of the top killers of women, with 300 000 deathsamong HIV-negative women and 200 000 deathsamong HIV-positive women in 2011. <strong>Global</strong> progressalso conceals regional variations: the African andEuropean regions are not on track to halve 1990 levelsof mortality by 2015.● Access to TB care has expanded substantiallysince the mid-1990s, when WHO launched a new globalTB strategy and began systematically monitoringprogress. Between 1995 and 2011, 51 million peoplewere successfully treated for TB in countries that hadadopted the WHO strategy, saving 20 million lives.● Progress in responding to multidrug-resistantTB (MDR-TB) remains slow. While the number ofcases of MDR-TB notified in the 27 high MDR-TB burdencountries is increasing and reached almost 60 000worldwide in 2011, this is only one in five (19%) of thenotified TB patients estimated to have MDR-TB. In thetwo countries with the largest number of cases, Indiaand China, the figure is less than one in ten; scale-upis expected in these countries in the next three years.● There has been further progress in implementingcollaborative TB/HIV activities (first recommendedby WHO in 2004). These saved an estimated1.3 million lives between 2005 and the end of 2011.In 2011, 69% of TB patients were tested for HIV in theAfrican Region, up from 3% in 2004. <strong>Global</strong>ly, 48% ofthe TB patients known to be living with HIV in 2011were started on antiretroviral therapy (ART); coverageneeds to double to meet WHO’s recommendation thatall TB patients living with HIV are promptly started onART. Kenya and Rwanda are top performers in HIVtesting and provision of ART.● Innovations in diagnostics are being implemented.The roll-out of Xpert MTB/RIF, a rapid moleculartest that can diagnose TB and rifampicin resistancewithin 100 minutes, has been impressive. Betweenits endorsement by WHO in December 2010 and theend of June 2012, 1.1 million tests had been purchasedby 67 low- and middle-income countries; South Africa(37% of purchased tests) is the leading adopter. A41% price reduction (from US$ 16.86 to US$ 9.98) inAugust 2012 should accelerate uptake.● The development of new drugs and new vaccinesis also progressing. New or re-purposed TB drugsand novel TB regimens to treat drug-sensitive or drugresistantTB are advancing in clinical trials and regulatoryreview. Eleven vaccines to prevent TB are movingthrough development stages.● There are critical funding gaps for TB care andcontrol. Between 2013 and 2015 up to US$ 8 billionper year is needed in low- and middle-income countries,with a funding gap of up to US$ 3 billion peryear. International donor funding is especially criticalto sustain recent gains and make further progress in35 low-income countries (25 in Africa), where donorsprovide more than 60% of current funding.● There are also critical funding gaps for researchand development. US$ 2 billion per year is needed;the funding gap was US$ 1.4 billion in 2010.GLOBAL TUBERCULOSIS REPORT 2012 1
Additional highlights by topicBurden of diseaseGeographically, the burden of TB is highest in Asia andAfrica. India and China together account for almost 40%of the world’s TB cases. About 60% of cases are in theSouth-East Asia and Western Pacific regions. The AfricanRegion has 24% of the world’s cases, and the highest ratesof cases and deaths per capita.Worldwide, 3.7% of new cases and 20% of previouslytreated cases were estimated to have MDR-TB.India, China, the Russian Federation and South Africahave almost 60% of the world’s cases of MDR-TB. Thehighest proportions of TB patients with MDR-TB are ineastern Europe and central Asia.Almost 80% of TB cases among people living with HIVreside in Africa.Estimating the burden of TB in children (aged less than15) is difficult; estimates are included in the report for thefirst time. There were an estimated 0.5 million cases and64 000 deaths among children in 2011.Case notifications and treatment successIn 2011, 5.8 million newly diagnosed cases were notifiedto national TB control programmes (NTPs) and reportedto WHO, up from 3.4 million in 1995 but still only twothirdsof the estimated total of 8.7 million people who fellill with TB in 2011.Notifications of TB cases have stagnated in recent years.New policy measures, including mandatory case notificationby all care providers via an electronic web-basedsystem in India, could have a global impact on the numberof TB cases notified in future years. Intensified effortsby NTPs to engage the full range of care providers usingpublic-private mix (PPM) initiatives are also important;in most of the 21 countries that provided data, 10–40% ofnotifications were from non-NTP care providers.<strong>Global</strong>ly, treatment success rates have been maintainedat high levels for several years. In 2010 (the latestyear for which treatment outcome data are available), thetreatment success rate among all newly-diagnosed caseswas 85% and 87% among patients with smear-positivepulmonary TB (the most infectious cases).Responding to drug-resistant TBMeasurement of drug resistance has improved considerably.Data are available for 135 countries worldwide (70%of WHO’s 194 Member States) and by the end of 2012 willbe available from all 36 countries with a high burden ofTB or MDR-TB.Extensively drug-resistant TB, or XDR-TB, has beenreported by 84 countries; the average proportion of MDR-TB cases with XDR-TB is 9.0%.The target treatment success rate of 75% or higher forpatients with MDR-TB was reached by only 30 of 107countries that reported treatment outcomes.Scaling up TB-HIV collaboration<strong>Global</strong>ly, 40% of TB patients had a documented HIV testresult and 79% of those living with HIV were providedwith co-trimoxazole preventive therapy in 2011.Interventions to detect TB promptly and to preventTB among people living with HIV, that are usually theresponsibility of HIV programmes and general primaryhealth-care services, include regular screening for TBand isoniazid preventive therapy (IPT) for those withoutactive TB. The number of people in HIV care who werescreened for TB increased 39% (2.3 million to 3.2 million)between 2010 and 2011. Nearly half a million peoplewithout active TB were provided with IPT, more thandouble the number started in 2010 and mostly the resultof progress in South Africa.Research and development to accelerate progressResearch to develop a point-of-care diagnostic test for TBand MDR-TB continues, and other diagnostic tests are inthe pipeline.Today, standard treatment for TB patients lasts sixmonths and the regimen for most patients with drugresistantTB takes 20 months. Treatment for MDR-TB iscostly and can have serious side-effects. Of the 11 anti-TBdrugs in clinical trials, two new drugs are being evaluatedto boost the effectiveness of MDR-TB regimens. A novelregimen that could be used to treat both drug-sensitiveTB and MDR-TB and shorten treatment duration hasshown encouraging results in clinical trials.There is no effective vaccine to prevent TB in adults.Progress in the past decade means that it is possible that atleast one new vaccine could be licensed by 2020.Financing for TB care and controlAbout US$ 1 billion per year of international donor fundingis needed for TB care and control (excluding TB/HIVinterventions) in low and middle-income countries from2013 to 2015, double existing levels. Up to an additionalUS$ 1 billion per year is needed for TB/HIV interventions,mostly for ART for HIV-positive TB patients.National contributions provide the bulk of financingfor TB care and control in Brazil, the Russian Federation,India, China and South Africa (BRICS). However, theyremain insufficient for scaling up the diagnosis and treatmentof MDR-TB; BRICS account for about 60% of theworld’s estimated cases of MDR-TB.The <strong>Global</strong> Fund provides almost 90% of internationaldonor funding for TB.2 GLOBAL TUBERCULOSIS REPORT 2012
CHAPTER 1IntroductionBOX 1.1Basic facts about tuberculosis (TB)TB is an infectious disease caused by the bacillusMycobacterium tuberculosis. It typically affects thelungs (pulmonary TB) but can affect other sites as well(extrapulmonary TB). The disease is spread in the air whenpeople who are sick with pulmonary TB expel bacteria, forexample by coughing. In general, a relatively small proportionof people infected with Mycobacterium tuberculosis willdevelop TB disease; however, the probability of developingTB is much higher among people infected with the humanimmunodefi ciency virus (HIV). TB is also more commonamong men than women, and affects mostly adults in theeconomically productive age groups.Without treatment, mortality rates are high. In studies of thenatural history of the disease among sputum smear-positiveand HIV-negative cases of pulmonary TB, around 70% diedwithin 10 years; among culture-positive (but smear-negative)cases, 20% died within 10 years. 1The most common method for dia gnosing TB worldwide issputum smear microscopy (developed more than 100 yearsago), in which bacteria are observed in sputum samplesexamined under a microscope. Following recent developmentsin TB diagnostics, the use of rapid molecular tests for thediagnosis of TB and drug-resistant TB is increasing, as highlightedin Chapter 6 of this report. In countries with moredeveloped laboratory capacity, cases of TB are also diagnosedvia culture methods (the current reference standard).Treatment for new cases of drug-susceptible TB consists of a6-month regimen of four fi rst-line drugs: isoniazid, rifampicin,ethambutol and pyrazinamide. Treatment for multidrugresistantTB (MDR-TB), defi ned as resistance to isoniazid andrifampicin (the two most powerful anti-TB drugs) is longer, andrequires more expensive and toxic drugs. For most patientswith MDR-TB, the current regimens recommended by WHO last20 months.1Tiemersma EW et al. Natural history of tuberculosis: durationand fatality of untreated pulmonary tuberculosis in HIV-negativepatients: A systematic review. PLoS ONE 2011 6(4): e17601.<strong>Tuberculosis</strong> (TB) remains a major global health problem.It causes ill-health among millions of people each yearand ranks as the second leading cause of death from aninfectious disease worldwide, after the human immunodeficiencyvirus (HIV). The latest estimates included inthis report are that there were almost 9 million new casesin 2011 and 1.4 million TB deaths (990 000 among HIVnegativepeople and 430 000 HIV-associated TB deaths).This is despite the availability of treatment that will curemost cases of TB. Short-course regimens of first-linedrugs that can cure around 90% of cases have been availablesince the 1980s.The World Health Organization (WHO) declared TB aglobal public health emergency in 1993. Starting in themid-1990s, efforts to improve TB care and control intensifiedat national and international levels. WHO developedthe DOTS strategy, a five-component package comprisingpolitical commitment, diagnosis using sputum smearmicroscopy, a regular supply of first-line anti-TB drugs,short-course chemotherapy and a standard system forrecording and reporting the number of cases detectedby national TB control programmes (NTPs) and the outcomesof treatment. Within a decade, almost all countrieshad adopted the strategy and there was considerableprogress towards global targets established for 2005: thedetection of 70% of the estimated number of smear-positivepulmonary cases (the most infectious cases) and thesuccessful treatment of 85% of these cases. In 2005, thenumbers of cases reported by NTPs grew to over 5 millionand treatment success rates reached 85%.WHO’s currently-recommended approach to TB careand control is the Stop TB Strategy, launched in 2006 (Box1.2). This strategy was linked to new global targets forreductions in TB cases and deaths that were set for 2015(Box 1.3) as part of the Millennium Development Goals(MDGs) and by the Stop TB Partnership. The targets arethat TB incidence should be falling by 2015 (MDG Target6.c) and that prevalence and death rates should be halvedcompared with their levels in 1990.The scale at which interventions included in the StopTB Strategy need to be implemented to achieve the2015 targets for reductions in disease burden has beendescribed in <strong>Global</strong> Plans developed by the Stop TB Partnership.The latest plan covers the period 2011–2015 andGLOBAL TUBERCULOSIS REPORT 2012 3
BOX 1.2The Stop TB Strategy at a glanceTHE STOP TB STRATEGYVISIONA TB-free worldGOALTo dramatically reduce the global burden of TB by 2015 in line with the Millennium Development Goals (MDGs)and the Stop TB Partnership targetsOBJECTIVES ■ Achieve universal access to high-quality care for all people with TB■ Reduce the human suffering and socioeconomic burden associated with TB■ Protect vulnerable populations from TB, TB/HIV and drug-resistant TB■ Support development of new tools and enable their timely and effective use■ Protect and promote human rights in TB prevention, care and controlTARGETS ■ MDG 6, Target 6.c: Halt and begin to reverse the incidence of TB by 2015COMPONENTS■ Targets linked to the MDGs and endorsed by the Stop TB Partnership:– 2015: reduce prevalence of and deaths due to TB by 50% compared with a baseline of 1990– 2050: eliminate TB as a public health problem1. Pursue high-quality DOTS expansion and enhancementa. Secure political commitment, with adequate and sustained fi nancingb. Ensure early case detection, and diagnosis through quality-assured bacteriologyc. Provide standardized treatment with supervision, and patient supportd. Ensure effective drug supply and managemente. Monitor and evaluate performance and impact2. Address TB/HIV, MDR-TB, and the needs of poor and vulnerable populationsa. Scale-up collaborative TB/HIV activitiesb. Scale-up prevention and management of multidrug-resistant TB (MDR-TB)c. Address the needs of TB contacts, and of poor and vulnerable populations3. Contribute to health system strengthening based on primary health carea. Help improve health policies, human resource development, fi nancing, supplies, service delivery and informationb. Strengthen infection control in health services, other congregate settings and householdsc. Upgrade laboratory networks, and implement the Practical Approach to Lung Healthd. Adapt successful approaches from other fi elds and sectors, and foster action on the social determinants of health4. Engage all care providersa. Involve all public, voluntary, corporate and private providers through public–private mix approachesb. Promote use of the International Standards for <strong>Tuberculosis</strong> Care5. Empower people with TB, and communities through partnershipa. Pursue advocacy, communication and social mobilizationb. Foster community participation in TB care, prevention and health promotionc. Promote use of the Patients’ Charter for <strong>Tuberculosis</strong> Care6. Enable and promote researcha. Conduct programme-based operational researchb. Advocate for and participate in research to develop new diagnostics, drugs and vaccines4 GLOBAL TUBERCULOSIS REPORT 2012
TABLE 1.1 Targets for the scale-up of interventions for TB care and control set in the <strong>Global</strong> Plan to Stop TB 2011–2015PLAN COMPONENT AND INDICATORS2015 TARGETDiagnosis and treatment of drug-susceptible TBNumber of cases diagnosed, notifi ed and treated according to the DOTS approach (per year)6.9 millionTreatment success rate (in annual cohort) 90%Number of countries with ≥1 laboratory with sputum-smear microscopy services per 100 000 population 149Diagnosis and treatment of drug-resistant TBPercentage of previously treated TB patients tested for MDR-TB 100%Percentage of new bacteriologically-positive TB patients tested for MDR-TB 20%Number of countries among the 22 HBCs and 27 high MDR-TB burden countries with ≥1 culture laboratory per 5 million population 36Percentage of confi rmed cases of MDR-TB enrolled on treatment according to international guidelines 100%Number of confi rmed cases of MDR-TB enrolled on treatment according to international guidelines ∼270 000Treatment success rate among confi rmed cases of MDR-TB ≥75%Collaborative TB/HIV activitiesPercentage of TB patients tested for HIV 100%Percentage of HIV-positive TB patients treated with CPT 100%Percentage of HIV-positive TB patients treated with ART 100%Percentage of people living with HIV attending HIV care services who were screened for TB at their last visit 100%Percentage of people living with HIV attending HIV care services who were enrolled on IPT, among those eligible 100%Laboratory strengthening (additional to those above)Percentage of national reference laboratories implementing a quality management system (QMS) according to international standards ≥50%ART, antiretroviral therapy; CPT, co-trimoxazole preventive therapy; HBC, high TB burden country; HIV, human immunodefi ciency virus; IPT, isoniazid preventive therapy;MDR-TB, multidrug-resistant tuberculosiscomes with a price tag of US$ 47 billion. 1 The main indicatorsand associated targets for 2015 are summarized inTable 1.1.WHO has published a global report on TB every yearsince 1997 (Figure 1.1). The main aim of the report is toprovide a comprehensive and up-to-date assessment ofthe TB epidemic and progress made in prevention, careand control of the disease at global, regional and countrylevels, in the context of global targets and WHO’s recommendedstrategy for achieving these targets. This 2012edition – the 17th in the series – continues the tradition.It is based primarily on data compiled in annual rounds ofglobal TB data collection in which countries are requestedto report a standard set of data to WHO (Box 1.4). In2012, a total of 204 countries and territories that accountfor over 99% of the world’s estimated cases of TB reporteddata (Table 1.2).The report is structured in seven major chapters. Eachchapter is intended to stand alone, but links to otherchapters are highlighted where appropriate.Chapter 2 contains the latest estimates of the burden ofdisease caused by TB and assessment of progress towardsthe 2015 targets at global, regional and country levels.The chapter puts the spotlight on Cambodia as a new successstory in TB control at country level and for the firstBOX 1.3Goals, targets and indicators for TB controlMillennium Development Goals set for 2015■ Goal 6: Combat HIV/AIDS, malaria andother diseasesTarget 6c: Halt and begin to reverse the incidence of malariaand other major diseasesIndicator 6.9: Incidence, prevalence and death ratesassociated with TBIndicator 6.10: Proportion of TB cases detected and curedunder DOTSStop TB Partnership targets set for 2015 and 2050By 2015: Reduce prevalence and death rates by 50%,compared with their levels in 1990By 2050: Reduce the global incidence of active TB cases to
FIGURE 1.1 Sixteen annual WHO reports on TB in 15 years, 1997–20111997: First report:epidemiology andsurveillance2002: Added fi nancing andstrategy for 22 high-burdencountries (HBCs)2003: Financingand strategy(all countries)July 2009: Online data collection introducedDecember 2009: Short update to 2009 report in transitionto earlier reporting of data and report publicationBOX 1.4Data collected in WHO’s 2012 round of global TB data collectionData were requested on the following topics: TB case notifi cations and treatment outcomes, including breakdowns by case type, age, sex,HIV status and drug resistance status; an overview of services for the diagnosis and treatment of TB; laboratory diagnostic services; drugmanagement; monitoring and evaluation; surveillance and surveys of drug-resistant TB; management of drug-resistant TB; collaborativeTB/HIV activities; TB infection control; engagement of all care providers in TB control; the budgets of national TB control programmes(NTPs) in 2012 and 2013; utilization of general health services (hospitalization and outpatient visits) during treatment; and NTPexpenditures in 2011. A shortened version of the online questionnaire was used for high-income countries (that is, countries with a grossnational income per capita of ≥US$ 12 475 in 2011, as defi ned by the World Bank) 1 and/or low-incidence countries (defi ned as countrieswith an incidence rate of
TABLE 1.2 <strong>Report</strong>ing of data in the 2012 round of global TB data collectionCOUNTRIES AND TERRITORIESMEMBER STATESWHO REGION OR SET OF COUNTRIESNUMBER NUMBER THAT REPORTED DATA NUMBER NUMBER THAT REPORTED DATAAfrican Region 46 46 46 46Eastern Mediterranean Region 23 23 22 22European Region a 54 42 53 41Region of the Americas 46 46 35 35South-East Asia Region 11 11 11 11Western Pacifi c Region 36 36 27 27High-burden countries (HBCs) b 22 22 22 22WORLD 216 204 194 182aCountries that did not report by the deadlines were mostly low-incidence countries in Western Europe.bThe HBCs are Afghanistan, Bangladesh, Brazil, Cambodia, China, the Democratic Republic of the Congo, Ethiopia, India, Indonesia, Kenya, Mozambique, Myanmar, Nigeria,Pakistan, the Philippines, the Russian Federation, South Africa, Thailand, Uganda, the United Republic of Tanzania, Viet Nam and Zimbabwe.Chapter 6, on TB diagnostics and laboratory strengthening,summarizes recent policy development and analyseslaboratory capacity in 2011. The development oflaboratory capacity through the EXPAND-TB project andthe latest data on progress in rolling out Xpert MTB/RIFsince endorsement of this rapid molecular test in 2010 aregiven particular attention.Chapter 7 contains the most recent data on progressin implementing collaborative TB/HIV activities to jointlyaddress the epidemics of TB and HIV. The lives saved bythese interventions since WHO policy was issued in 2004and the need to further increase the coverage of antiretroviraltherapy for TB patients living with HIV are highlighted.Chapter 8 discusses research and development for newTB diagnostics, drugs and vaccines. After years of stagnation,considerable progress has occurred in the lastdecade and the development pipelines as of mid-2012 aredescribed and discussed.The report also has four annexes. Annex 1 explainsthe methods used to produce estimates of the burden ofdisease caused by TB. Annex 2 contains country profilesfor the 22 high-burden countries (HBCs) that collectivelyaccount for about 80% of the world’s TB cases (profilesfor all countries are available online 1 ). Annex 3 containsregional profiles. Annex 4 consists of summary tables thatprovide data on key indicators for the world, WHO’s sixregions and individual countries.1www.who.int/tb/dataGLOBAL TUBERCULOSIS REPORT 2012 7
CHAPTER 2The burden of disease caused by TBKEY FACTS AND MESSAGES There has been major progress in reducing TB cases anddeaths in the past two decades. The 2015 MDG target of halting and reversing TBincidence has been achieved, with TB incidence fallingglobally for several years and declining at a rate of 2.2%between 2010 and 2011. <strong>Global</strong>ly, the TB mortality ratehas fallen by 41% since 1990 and the world is on trackto reach the global target of a 50% reduction by 2015. Mortality and incidence rates are falling in all of WHO’ssix regions and in most of the 22 HBCs that account forover 80% of the world’s TB cases. Cambodia provides an important new success story forTB control in a HBC: a national population-based surveycompleted in 2011 showed that TB prevalence hadfallen 45% since a baseline survey in 2002. Despite this encouraging progress, the global burdenof TB remains enormous. There were an estimated8.7 million incident cases of TB in 2011 (13%co-infected with HIV). There were also 1.4 milliondeaths from TB (990 000 deaths among HIV-negativeindividuals and 430 000 among people who wereHIV-positive). These deaths included 0.5 million amongwomen, making TB one of the top killers of womenworldwide. Geographically, the burden of TB is highest in Asia andAfrica. India and China combined have almost 40% ofthe world’s TB cases; the South-East Asia and WesternPacifi c Regions of which they are a part account for60%. The African Region has approximately one quarterof the world’s cases, and the highest rates of cases anddeaths relative to population. <strong>Global</strong>ly, 3.7% of new cases and 20% of previouslytreated cases are estimated to have MDR-TB. Estimates of the burden of disease caused by TB arebeing continuously improved at country level, supportedby WHO’s <strong>Global</strong> Task Force on TB Impact Measurement.The burden of disease caused by TB can be measured interms of incidence (defined as the number of new andrelapse cases of TB arising in a given time period, usuallyone year), prevalence (defined as the number of cases ofTB at a given point in time) and mortality (defined as thenumber of deaths caused by TB in a given time period,usually one year).This chapter presents estimates of TB incidence,prevalence and mortality (absolute numbers and rates)between 1990 and 2011 and (for prevalence and mortality)forecasts up to 2015 (in sections 2.1–2.3). These dataare used to assess progress towards achieving the globaltargets for TB control set for 2015: that incidence shouldbe falling (MDG Target 6.c) and that prevalence anddeath rates should be halved by 2015 compared with 1990(Box 1.3 in Chapter 1). Key aspects of the methods usedto produce the estimates are provided at the beginning ofeach section. 1 Section 2.4 contains estimates of the numberof prevalent cases of multidrug-resistant TB (MDR-TB) in 2011, and estimates of the proportion of MDR-TBcases globally, regionally and in high TB-burden countries(HBCs). 2In response to increasing demand and global attention,this 2012 global report is the first to feature estimates ofthe number of TB cases and deaths among children andthe first to include estimates of TB mortality among womenthat include HIV-associated TB deaths. 3 The chapteralso puts the spotlight on Cambodia, which providesa new success story for TB control at country level. Anational survey in 2011 showed that TB prevalence hadfallen by 45% in the 9 years since a baseline survey in2002.There is uncertainty in all estimates of the burdenof disease caused by TB. Section 2.5 profiles efforts toimprove measurement of the burden of the disease underthe umbrella of the WHO <strong>Global</strong> Task Force on TB ImpactMeasurement. These include efforts to strengthen surveillanceof cases and deaths via notification and vitalregistration (VR) systems, and national surveys of theprevalence of TB disease in global focus countries.1A detailed description is provided in Annex 1.2Chapter 4 includes a much fuller discussion of the MDR-TBepidemic and the latest data on progress in the diagnosis andtreatment of MDR-TB.3In previous reports, estimates were restricted to the number ofTB deaths among women who were HIV-negative.8 GLOBAL TUBERCULOSIS REPORT 2012
BOX 2.1Uncertainty in estimates of TB incidence, prevalence and mortalityMeasuring the incidence of TB at national level has never been done because it would require long-term studies among large cohortsof people (hundreds of thousands) at high cost and with challenging logistics. In countries with a high burden of TB, prevalence canbe directly measured in nationwide surveys using sample sizes of around 50 000 people; costs range from US$ 1 to US$ 4 million persurvey. 1 Between 2009 and 2015, an unprecedented number of national TB prevalence surveys are being conducted in countries whereTB is endemic. In low and medium-burden countries, sample sizes and costs become prohibitively large. TB mortality among HIV-negativepeople can be directly measured if national vital registration (VR) systems of high coverage – in which causes of death are accuratelycoded according to the latest revision of the international classifi cation of diseases (ICD-10) – are in place. Sample VR systems coveringrepresentative areas of the country (as in China) provide an interim solution. Mortality surveys can also be used to directly measure deathscaused by TB. In 2011, most countries with a high burden of TB lacked national or sample VR systems and few had conducted mortalitysurveys. TB mortality among HIV-positive people is hard to measure even when VR systems are in place because deaths among HIVpositivepeople are coded as HIV deaths and contributory causes (such as TB) are often not reliably recorded.For all these reasons, the estimates of TB incidence, prevalence and mortality included in this chapter are presented with uncertaintyintervals. The methods used to produce best estimates and uncertainty intervals are described in detail in Annex 1.1TB prevalence surveys: a handbook. Geneva, World Health Organization, 2011 (WHO/HTM/TB/2010.17).2.1 IncidenceThe incidence of TB cannot be measured directly (Box2.1). For 96 countries that account for 89% of the world’sTB cases, estimates were revised between 2009 and 2012in regional or country workshops (Figure 2.1) using aframework (Figure 2.2) and associated tools developedby the WHO <strong>Global</strong> Task Force on TB Impact Measurement.In-depth analyses of the available surveillance,survey and programmatic data were undertaken, andexpert opinion about the fraction of cases diagnosed butnot reported, or not diagnosed at all, was documented.Reliance on expert opinion is one of the reasons why estimatesare uncertain (Box 2.1); strengthening surveillanceand better quantifying the extent of under-reporting (i.e.the number of cases that are missed by surveillance systems)are needed to reduce this uncertainty (efforts to doso are discussed in Section 2.5). For countries not coveredin workshops, estimates are based on extending previoustime-series or on updates using mortality data from VRsystems combined with evidence about the case fatalityrate (see Annex 1 for details).In 2011, there were an estimated 8.7 million incidentcases of TB (range, 8.3 million–9.0 million) globally,equivalent to 125 cases per 100 000 population(Table 2.1, Table 2.2, Figure 2.3, Figure 2.4, Figure 2.5).Most of the estimated number of cases in 2011 occurredin Asia (59%) and Africa (26%); 1 smaller proportionsof cases occurred in the Eastern Mediterranean Region(7.7%), the European Region (4.3%) and the Region ofthe Americas (3%). The 22 HBCs that have been givenhighest priority at the global level since 2000 (listed inTable 2.1 and Table 2.2) accounted for 82% of all estimat-FIGURE 2.1Progress in applying the Task Forceframework for assessment of TB surveillancedata, as of July 2012 aaAll countries shown in orange participated in regional workshops held fromApril 2009 to June 2010, with the exception of the United Republic of Tanzaniawhere a country mission was undertaken in October 2009 and India where threecountry missions were undertaken between April and July 2011. As follow-up tothe regional workshop held for countries in the Western Pacifi c Region in June2010, national workshops were also held in China in June 2011, in India in July2011 and July 2012, in Cambodia in February 2012 and in Indonesia in March2012. Further details about these workshops are provided in ANNEX 1.1Asia refers to the WHO regions of South-East Asia and theWestern Pacific. Africa means the WHO African Region.GLOBAL TUBERCULOSIS REPORT 2012 9
FIGURE 2.2Framework for assessment of TB surveillance data (notification and vital registration data)DATA QUALITYTRENDSDo surveillance datarefl ect trends in incidenceand mortality?ARE ALL CASES ANDDEATHS CAPTURED INSURVEILLANCE DATA?• Completeness• No duplications, no misclassifi cations• Internal and external consistency• Analyse time-changes in notifi cations and deathsalongside changes in e.g. case-fi nding, casedefi nitions, HIV prevalence and other determinants• “Onion” model• Inventory studies• Capture re-capture studies• Prevalence surveys• Innovative operational researchIMPROVE surveillance systemEVALUATE trends and impact of TB controlUPDATE estimates of TB incidence and mortalitynotifi cations ≈ incidenceVR mortality data ≈ deathsIf appropriate, CERTIFY TB surveillance data as adirect measure of TB incidence and mortalityTABLE 2.1 Estimated burden of disease caused by TB, 2011. Numbers in thousands. aPOPULATIONMORTALITY b PREVALENCE INCIDENCE HIV-POSITIVE INCIDENT TB CASESBEST c LOW HIGH BEST LOW HIGH BEST LOW HIGH BEST LOW HIGHAfghanistan 32 358 13 5.3 23 110 55 190 61 51 73 0.3 0.2 0.4Bangladesh 150 494 68 29 120 620 300 1 100 340 280 400 0.6 0.3 1.0Brazil 196 655 5.6 4.6 6.8 91 36 170 83 69 97 16 13 19Cambodia 14 305 9.1 4.2 16 120 99 140 61 52 70 3.1 2.6 3.6China 1 347 565 47 45 49 1 400 1 200 1 600 1 000 890 1 100 13 8.6 17DR Congo 67 758 36 16 65 350 180 570 220 190 250 34 27 41Ethiopia 84 734 15 11 20 200 160 240 220 160 280 38 28 49India d 1 241 492 300 190 430 3 100 2 100 4 300 2 200 2 000 2 500 94 72 120Indonesia 242 326 65 29 120 680 310 1 200 450 380 540 15 11 20Kenya 41 610 9.2 4.7 15 120 63 200 120 110 120 47 45 49Mozambique 23 930 11 4.0 22 120 56 200 130 91 180 83 58 110Myanmar 48 337 23 11 40 240 190 310 180 160 210 18 15 22Nigeria 162 471 27 6.1 64 280 71 620 190 90 330 50 23 86Pakistan 176 745 59 26 110 620 280 1 100 410 340 490 1.5 1.0 2.1Philippines 94 852 28 25 31 460 400 520 260 210 310 1.1 0.6 1.6Russian Federation 142 836 22 22 23 180 72 330 140 120 160 9.3 7.4 11South Africa 50 460 25 11 44 390 200 630 500 410 600 330 270 390Thailand 69 519 9.8 4.2 18 110 51 200 86 71 100 13 10 15Uganda 34 509 5.0 2.1 9.0 63 33 100 67 54 81 35 28 42UR Tanzania 46 218 6.4 3.3 11 82 43 130 78 73 83 30 28 32Viet Nam 88 792 30 12 55 290 130 500 180 140 220 14 11 18Zimbabwe 12 754 6.0 2.4 11 70 37 110 77 59 96 46 36 58High-burdencountries4 370 719 820 680 980 9 700 8 300 11 000 7 100 6 800 7 500 890 810 970AFR 857 382 220 180 270 2 500 2 100 3 000 2 300 2 100 2 400 870 800 950AMR 943 019 21 18 24 330 250 420 260 240 280 37 34 40EMR 608 628 99 61 150 1 000 660 1 500 660 590 740 8.7 7.6 9.9EUR 899 500 45 44 46 500 370 650 380 350 400 23 20 25SEAR 1 830 361 480 350 630 5 000 3 800 6 300 3 500 3 200 3 700 140 120 170WPR 1 808 797 130 100 150 2 500 2 200 2 800 1 700 1 500 1 800 36 31 42<strong>Global</strong> 6 947 687 990 840 1 100 12 000 10 000 13 000 8 700 8 300 9 000 1 100 1 000 1 200aNumbers for mortality, prevalence and incidence shown to two signifi cant fi gures. Totals (HBCs, regional and global) are computed prior to rounding.bMortality excludes deaths among HIV-positive TB cases. Deaths among HIV-positive TB cases are classifi ed as HIV deaths according to ICD-10.cBest, low and high indicate the point estimate and lower and upper bounds of the 95% uncertainty interval.dEstimates for India have not yet been offi cially approved by the Ministry of Health & Family Welfare, Government of India, and should therefore be considered provisional.10 GLOBAL TUBERCULOSIS REPORT 2012
TABLE 2.2 Estimated burden of disease caused by TB, 2011. Rates per 100 000 population except where indicated. aPOPULATION(THOUSANDS)MORTALITY a PREVALENCE INCIDENCEHIV PREVALENCE IN INCIDENTTB CASES (%)BEST b LOW HIGH BEST LOW HIGH BEST LOW HIGH BEST LOW HIGHAfghanistan 32 358 39 16 71 351 169 597 189 156 225 0.5 0.3 0.7Bangladesh 150 494 45 19 82 411 199 698 225 185 268 0.2 0.1 0.3Brazil 196 655 2.9 2.3 3.4 46 18 87 42 35 50 20 19 20Cambodia 14 305 63 29 111 817 690 954 424 364 489 5.1 4.8 5.3China 1 347 565 3.5 3.4 3.6 104 91 119 75 66 85 1.2 0.9 1.7DR Congo 67 758 54 24 96 512 263 842 327 282 375 15 13 17Ethiopia 84 734 18 14 24 237 191 288 258 191 335 17 17 18India c 1 241 492 24 15 35 249 168 346 181 163 199 4.2 3.3 5.2Indonesia 242 326 27 12 48 281 130 489 187 155 222 3.3 2.5 4.2Kenya 41 610 22 11 36 291 152 475 288 276 300 39 39 40Mozambique 23 930 47 17 91 490 235 837 548 380 747 63 63 64Myanmar 48 337 48 22 84 506 390 637 381 326 439 9.9 8.8 11Nigeria 162 471 17 3.7 40 171 44 382 118 56 204 26 25 26Pakistan 176 745 33 15 60 350 158 618 231 190 276 0.4 0.3 0.5Philippines 94 852 29 26 33 484 425 546 270 223 322 0.4 0.3 0.6Russian Federation 142 836 16 15 16 124 50 229 97 82 114 6.7 5.7 7.7South Africa 50 460 49 21 87 768 399 1 250 993 819 1 180 65 65 66Thailand 69 519 14 6.1 25 161 73 282 124 102 147 15 14 15Uganda 34 509 14 6.2 26 183 95 298 193 156 234 53 52 53UR Tanzania 46 218 14 7.1 23 177 93 286 169 159 180 38 38 39Viet Nam 88 792 33 14 62 323 148 563 199 153 250 8.0 7.8 8.2Zimbabwe 12 754 47 19 88 547 287 889 603 466 757 60 59 60High-burdencountries4 370 719 19 15 22 222 190 255 163 155 171 13 11 14AFR 857 382 26 21 31 293 243 347 262 242 283 39 37 41AMR 943 019 2.2 1.9 2.5 35 26 44 28 26 29 14 11 17EMR 608 628 16 10 24 170 108 246 109 97 122 1.5 0.9 2.1EUR 899 500 5.0 4.9 5.1 56 41 73 42 39 45 6.1 4.4 8.0SEAR 1 830 361 26 19 34 271 206 344 189 176 203 4.1 3.3 5.0WPR 1 808 797 6.9 5.7 8.3 138 123 154 92 84 100 2.2 1.4 3.1<strong>Global</strong> 6 947 687 14 12 17 170 150 192 125 120 130 13 12 14aMortality excludes deaths among HIV-positive TB cases. Deaths among HIV-positive TB cases are classifi ed as HIV deaths according to ICD-10.bBest, low and high indicate the point estimate and lower and upper bounds of the 95% uncertainty interval.cEstimates for India have not yet been offi cially approved by the Ministry of Health & Family Welfare, Government of India, and should therefore be considered provisional.ed incident cases worldwide. Of the 8.7 million incidentcases, an estimated 0.5 million were children (Box 2.2)and 2.9 million (range, 2.6–3.2 million) occurred amongwomen.The five countries with the largest number of incidentcases in 2011 were India (2.0 million–2.5 million), China(0.9 million–1.1 million), South Africa (0.4 million–0.6million), Indonesia (0.4 million–0.5 million) and Pakistan(0.3 million–0.5 million). India and China aloneaccounted for 26% and 12% of global cases, respectively.Of the 8.7 million incident cases in 2011, 1.0 million–1.2million (12–14%) were among people livingwith HIV, with a best estimate of 1.1 million (13%) (Table2.1). The proportion of TB cases coinfected with HIV washighest in countries in the African Region (Figure 2.6);overall, 39% of TB cases were estimated to be coinfectedwith HIV in this region, which accounted for 79% of TBcases among people living with HIV worldwide.<strong>Global</strong>ly, incidence rates were relatively stable from1990 up to around 2001, and then started to fall (Figure2.3). Between 2010 and 2011, the rate of decline was2.2%; if this trend is sustained, MDG Target 6.c will beachieved. The absolute number of incident cases is alsofalling, albeit slowly (Figure 2.4), as the decline in theincidence rate (per 100 000 population) exceeds the rateof growth in the world’s population.Incidence rates are declining in all of WHO’s six regions(Figure 2.7). The rate of decline between 2010 and 2011was 0.5% in the Eastern Mediterranean Region, 2.0% inthe South-East Asia Region, 2.3% in the Western PacificRegion, 3.1% in the African Region, 3.8% in the Regionof the Americas and 8.5% per year in the EuropeanGLOBAL TUBERCULOSIS REPORT 2012 11
FIGURE 2.3<strong>Global</strong> trends in estimated rates of TB incidence, prevalence and mortality. Left: <strong>Global</strong> trends in estimatedincidence rate including HIV-positive TB (green) and estimated incidence rate of HIV-positive TB (red). Centre andright: Trends in estimated TB prevalence and mortality rates 1990–2011 and forecast TB prevalence and mortality rates2012–2015. The horizontal dashed lines represent the Stop TB Partnership targets of a 50% reduction in prevalence andmortality rates by 2015 compared with 1990. Shaded areas represent uncertainty bands. Mortality excludes TB deathsamong HIV-positive people.Incidence Prevalence Mortality2003003025025Rate per 100 000 population150100502001501002015105050001990 1995 2000 2005 20111990 1995 2000 2005 2010 20151990 1995 2000 2005 2010 2015FIGURE 2.4 Estimated absolute numbers of TB cases and deaths (in millions), 1990–2011TB incidenceTB deathsAll TB cases2.081.5Millions64Millions1.0TB deaths amongHIV-negative people20.50HIV-positive TB cases0HIV-associatedTB deaths a1990 1995 2000 2005 20111990 1995 2000 2005 2011aHIV-associated TB deaths are classifi ed as HIV deaths according to ICD-10.Region. Incidence rates have been falling since the mid-1990s in the Eastern Mediterranean Region and sincearound 2000 in South-East Asia; they peaked at the endof the 1990s in the European Region and around 2002 inAfrica, and have been falling since 1990 in the Americasand the Western Pacific Region. The latest assessment forthe 22 HBCs suggests that incidence rates are falling inmost countries (Figure 2.8).2.2 PrevalenceThe prevalence of TB can be directly measured in nationwidepopulation-based surveys, and comprehensivetheoretical and practical guidance on how to design,implement, analyse and report such surveys is available. 1When repeat surveys are conducted, trends in TB prevalencecan be directly measured as well. The countries inwhich surveys have been implemented or are planned inthe near future are shown in Figure 2.9.If survey data are not available, prevalence can be indirectlyestimated as the product of incidence and the averageduration of disease, but with considerable uncertainty(Annex 1). Although the data available from prevalencesurveys allow for a robust assessment of trends in theWestern Pacific Region (especially in Cambodia, Chinaand the Philippines) and are becoming more widely avail-1TB prevalence surveys: a handbook. Geneva, World Health Organization,2011 (WHO/HTM/TB/2010.17).12 GLOBAL TUBERCULOSIS REPORT 2012
FIGURE 2.5 Estimated TB incidence rates, 2011Estimated newTB cases (all forms)per 100 000 population0–2425–4950–149150–299≥ 300No estimateNot applicableFIGURE 2.6 Estimated HIV prevalence in new TB cases, 2011HIV prevalence(%), all ages0–45–1920–49≥ 50No estimateNot applicableGLOBAL TUBERCULOSIS REPORT 2012 13
BOX 2.2The burden of TB disease among childrenFor many years, the prevention, diagnosis and treatment of TB amongchildren have been relatively neglected. Greatest attention has beengiven to the detection and treatment of infectious cases, most ofwhich occur in adults. The Stop TB Strategy launched by WHO in2006 includes case-fi nding in high-risk or vulnerable groups suchas children and prevention of TB in children who live in the samehousehold as newly detected TB cases. To help to address the burdenof TB in children (defi ned as those aged
FIGURE B2.2.1<strong>Report</strong>ing of notification data disaggregated by age, 2011Age disaggregationAll case types disaggregatedOnly smear-positive cases disaggregatedNo age disaggregationNot applicable70 000 people. The screening strategy includes chest X-rays anda symptom-based questionnaire for the entire survey population,followed by collection of sputum samples from all those with TB signsand symptoms for subsequent smear and culture examination.After careful weighing of the advantages and disadvantages byWHO’s <strong>Global</strong> Task Force on TB Impact Measurement (see Section2.5), the inclusion of children in national prevalence surveys has notbeen recommended. Major reasons are:■ Inclusion of children in a survey would not lead to a preciseestimate of TB prevalence among children, since only a fewbacteriologically-confi rmed cases would be found. Even existingsurveys of adults are not able to provide precise estimates fordifferent age groups.■ There are ethical considerations associated with the massscreening of all children, most of whom are healthy. Whileevidence exists that chest X-ray screening is safe for adults, similarevidence does not exist for children. Furthermore, there is nosimple and reliable tool that could be used to restrict the numberof children screened by X-ray: for example, there is no reliable testfor tuberculous infection.■ Among adults, use of broad criteria for considering an X-ray“abnormal” is encouraged to minimize the number of casesthat are missed during screening. Among children, use of testsfor tuberculous infection and broad criteria for considering anX-ray “abnormal” would lead to unnecessary efforts to obtainspecimens, which among young children requires invasive anduncomfortable gastric aspiration.■ Referral hospitals are needed for the follow-up and diagnosticconfi rmation of TB in children. These are often not available in therural areas that account for a large share of the clusters includedin national prevalence surveys.■ Inclusion of children would approximately double the sample sizeand associated costs. The additional logistical complications ofincluding children could also jeopardise the survey as a whole.Next steps to improve existing estimates of TB casesand deaths among childrenNext steps to improve the measurement and estimation of TBincidence among children include:■ Systematic literature reviews of existing data on incidentchildhood TB, under-reporting of TB in children and misdiagnosis;■ A global consultation to further develop analytical methods andto defi ne and prioritize actions needed to obtain new data;■ Promotion of case-based electronic recording and reportingsystems that would facilitate compilation and analysis of agedisaggregateddata (among other advantages – see Section2.5.1); and■ Nationwide inventory surveys to measure under-reporting ofchildhood TB.More contact-tracing and the integration of TB activities in maternal,newborn and child health services would also help to fi nd childrenwith TB that might otherwise not be diagnosed.To improve estimates of TB mortality among children, the mainactions required are:■ Collection of age-specifi c data from sample VR systems andmortality surveys in high-burden countries including China, Indiaand Indonesia;■ Advocacy for further development of and continued investment inVR systems.1This estimate is for TB deaths among HIV-negative children. TB deathsamong HIV-positive children are classifi ed as HIV deaths in ICD-10.WHO REPORT 2012 GLOBAL TUBERCULOSIS CONTROL 15
FIGURE 2.7Estimated TB incidence rates by WHO region, 1990–2011. Regional trends in estimated TB incidence rates (green)and estimated incidence rates of HIV-positive TB (red). Shaded areas represent uncertainty bands.400Africa80The Americas150Eastern Mediterranean30060100200401002050Rate per 100 000 population per year0Europe800250South−East Asia0200Western Pacific60200150150401001002050500001990 1995 2000 2005 20111990 1995 2000 2005 2011 1990 1995 2000 2005 2011able for countries with a high burden of TB (see Section2.5.2), TB prevalence can be estimated only indirectly inmost countries.There were an estimated 12 million prevalent cases(range, 10 million–13 million) of TB in 2011 (Table 2.1),equivalent to 170 cases per 100 000 population (Table 2.2).The prevalence rate has fallen by 36% globally since 1990.Current forecasts suggest that the Stop TB Partnership’starget of halving TB prevalence by 2015 comparedwith a baseline of 1990 will not be met worldwide (Figure2.3). Regionally, prevalence rates are declining in all ofWHO’s six regions (Figure 2.10). The Region of the Americashalved the 1990 level of TB prevalence by around2005, well in advance of the target year of 2015, andthe Western Pacific Region is close to doing so. Achievingthe 50% reduction target by 2015 appears feasible inthe European and South-East Asia regions, but not in theAfrican and Eastern Mediterranean regions.2.3 MortalityMortality caused by TB can be directly measured if anational VR system of high coverage with accurate codingof causes of death according to the latest revision ofthe international classification of diseases (ICD-10) is inplace. Sample VR systems can provide an interim solution,and mortality surveys can sometimes be used toobtain direct measurements of TB deaths in countrieswith no VR system. In the absence of VR systems ormortality surveys, TB mortality can be estimated as theproduct of TB incidence and the case fatality rate, or fromecological modelling based on mortality data from countrieswith VR systems.Until 2008, WHO estimates of TB mortality used VRdata for only three countries. This was substantiallyimproved to 89 countries in 2009, although most of thesecountries were in the European Region and the Region ofthe Americas, which account for only 8% of the world’sTB cases. The use of sample VR data from China and surveydata from India for the first time in 2011 enabled afurther major improvement to estimates of TB mortal-16 GLOBAL TUBERCULOSIS REPORT 2012
FIGURE 2.8Estimated TB incidence rates, 22 high-burden countries, 1990–2011. Trends in estimated TB incidence rates(green) and estimated incidence rates of HIV-positive TB (red). Shaded areas represent uncertainty bands.AfghanistanBangladeshBrazilCambodiaChina300200100300200100100508006004002002001501005000000DR Congo400300200100800600400200Ethiopia25020015010050India a30025020015010050Indonesia400300200100Kenya00000Rate per 100 000 population per yearMozambique120010008006004002000Russian Federation6005004003002001000MyanmarSouth Africa6004002000250NigeriaThailand30020010001200PakistanUganda6004002000300PhilippinesUR Tanzania1501005010005002001501005010008006004002002502001501005000000Viet Nam3002502001501001000800600400Zimbabwe1990 1995 2000 2005 2011 1990 1995 2000 2005 2011 1990 1995 2000 2005 20115001990 1995 2000 2005 201120001990 1995 2000 2005 2011aEstimates for India have not yet been offi cially approved by the Ministry of Health & FamilyWelfare, Government of India and should therefore be considered provisional.ity, with direct measurements available for 91 countriesin 2010. The estimates of TB mortality presented in thisreport are based on even more VR data. Use of VR datafor 119 countries and survey data from India mean thatdirect measurements of TB mortality were used for 120countries (shown in Figure 2.11) that collectively accountfor 46% of the estimated number of TB deaths globally.VR data are most limited in the African Region and partsof the South-East Asia Region. A current example of acountry that is building a sample VR system is Indonesia(Box 2.3).The best estimate of the number of TB deaths worldwidefell just below 1 million among HIV-negative peoplein 2011 (TB deaths among HIV-positive people are classifiedas AIDS deaths in ICD-10). 1 The best estimate for2011 is 990 000 deaths (Table 2.1), with an uncertaintyinterval of 0.84 million–1.1 million. This was equivalentto 14 deaths per 100 000 population. There were also anadditional 0.43 million HIV-associated deaths (range,0.40 million–0.46 million) i.e. deaths from TB amongpeople who were HIV-positive (data not shown). Thus atotal of approximately 1.4 million people (range, 1.3 million–1.6million) died of TB in 2011, of whom 0.5 millionwere women (Box 2.4).The number of TB deaths per 100 000 populationamong HIV-negative people plus the estimated numberof TB deaths among HIV-positive people equates to a bestestimate of 20 deaths per 100 000 population in 2011.<strong>Global</strong>ly, mortality rates (excluding deaths amongHIV-positive people) 2 have fallen by 41% since 1990;the current forecast suggests that the Stop TB Partnership’starget of a 50% reduction by 2015 compared witha baseline of 1990 will be achieved (Figure 2.3). Mortalityrates are also declining in all of WHO’s six regions(Figure 2.12). The 2015 target has already been surpassedin the Region of the Americas and the Western Pacific1International statistical classifi cation of diseases and related healthproblems, 10th revision (ICD-10), 2nd ed. Geneva, World HealthOrganization, 2007.2Trends in TB mortality rates are restricted to TB deaths amongHIV-negative people, given that TB deaths among HIV-positivepeople are classified as HIV deaths in ICD-10.GLOBAL TUBERCULOSIS REPORT 2012 17
FIGURE 2.9 Countries in which surveys of the prevalence of TB disease have been implemented since 1990or are planned in the near futurePrevalence surveyNo survey plannedSubnational surveycompletedNational surveyongoing orplannedOne national surveycompletedRepeat national surveyplanned≥ 1 repeat national survey completedNot applicableFIGURE 2.10 Trends in estimated TB prevalence rates 1990–2011 and forecast TB prevalence rates 2012–2015, by WHOregion. Shaded areas represent uncertainty bands. The horizontal dashed lines represent the Stop TB Partnership target ofa 50% reduction in the prevalence rate by 2015 compared with 1990. The other dashed lines show projections up to 2015.600AfricaThe AmericasEastern Mediterranean50040040010030030020050200Rate per 100 000 population1000150Europe0600500South-East Asia1000Western Pacific30025040020010030015050200100100500001990 1995 2000 2005 2010 2015 1990 1995 2000 2005 2010 2015 1990 1995 2000 2005 2010 201518 GLOBAL TUBERCULOSIS REPORT 2012
FIGURE 2.11 Countries (in blue) for which TB mortality is estimated directly using measurements from vital registrationsystems and/or mortality surveysRegion, and may have been reached in the Eastern MediterraneanRegion. Among the other three regions, theSouth-East Asia Region appears best placed to achievethe target.In 2012, considerably more VR data (dating back to1990) became available to estimate TB mortality in Europeancountries with a high burden of TB. The use of thesedata means that the regional trend for the EuropeanRegion has been updated; it indicates a sharp rise untilabout 1998, followed by a sharp fall back to 1990 levelsby 2011. This pattern is consistent across most individualcountries (Figure 2.13), and corresponds to the economic,social and political disruption following the breakupof the former Soviet Union, and subsequent rebuildingand economic development. The striking relationshipbetween TB mortality rates and national income per capitain Latvia is shown in Figure 2.14.Among the 22 HBCs, mortality rates appear to be fallingin most countries (Figure 2.15).2.4 Multidrug-resistant tuberculosisThis report, as in 2011, focuses on estimates of the numberof prevalent cases of MDR-TB. The reasons are thatMDR-TB is a chronic disease and without appropriatediagnosis and treatment for most of these cases manymore prevalent cases than incident cases are expected;calculations of the number of prevalent cases of MDR-TBare more readily understood compared with the complexBOX 2.3Building a sample vital registrationsystem in IndonesiaWith support from AusAID and technical assistance fromUniversity of Queensland, the Indonesian National Instituteof Health Research and Development (NIHRD) piloted asample vital registration system in selected sites (CentralJava, Lampung, West Kalimantan, Gorontalo and Papua)covering 2.5 million population from 2006 to 2008. The pilotwas named the Indonesian Mortality Registration SystemStrengthening Project (IMRSSP). The IMRSSP tested the verbalautopsy questionnaires, fi eld implementation, and proceduresand standards for calibration of causes of deaths. Resultsfrom the IMRSSP demonstrated that the measurement ofcause-specifi c mortality is feasible by strengthening the deathregistration system in Indonesia. The cost was approximatelyUS$ 0.5–1 per capita per year (in the areas covered by thesystem). After the pilot, the local Indonesian authoritiescontinued to implement vital registration in the same siteswith their own funding; data quality has yet to be assessed.With support from a <strong>Global</strong> Fund round 10 grant on healthsystem strengthening, a sample vital registration system isnow being introduced. The NIHRD randomly selected 128sub-districts across the country, covering a population of about5 million (2% of the country’s total). The 128 sub-districts donot include any of the IMRSSP pilot sites. By June 2013, allselected sub-districts will start to collect data on mortality,with preliminary results expected by December 2013. Ananalysis of the cost of implementing a sample vital registrationsystem with resources that ensure data quality is planned.GLOBAL TUBERCULOSIS REPORT 2012 19
BOX 2.4TB mortality among womenThis is the fi rst WHO report on global TB care and control to include estimates of the number of TB deaths among women 1 that includeHIV-associated TB deaths (classifi ed as HIV deaths in ICD-10) as well as TB deaths among HIV-negative people. In total, there were anestimated 0.5 million TB deaths among women. This includes 300 000 (range, 250 000–350 000) TB deaths among HIV-negative women(30% of all TB deaths among HIV-negative people) and 200 000 (range, 185 000–215 000) HIV-associated TB deaths (Table 2.4.1).TB is one of the top killers of women worldwide.Although globally the numbers of HIV-associated TB deaths were similar among men and women, there were regional variations(Figure B2.4.1). In the African Region, more deaths occurred among women than men, while in other regions more deaths were estimatedto occur among men. The male:female ratio of HIV-associated TB deaths ranged from 0.83 in the African Region to 3.1 in the WesternPacifi c Region.TABLE B2.4.1Number of HIV-associated TB deaths among womenin 2011, by WHO regionESTIMATED NUMBER OF DEATHSFIGURE B2.4.1The male:female ratio for HIV-associated TB deathsamong adults (aged ≥15 years), globally and forWHO regionsWHO REGIONBEST ESTIMATEUNCERTAINTY INTERVALAFR 169 000 155 000–184 000AMR 3 130 2 710–3 580EMR 1 290 1 100–1 500EUR 2 960 2 490–3 460SEAR 19 800 16 000–24 000WPR 3 680 2 810–4 660<strong>Global</strong> 200 000 185 000–215 000AFRAMREMREURSEARWPR●●●●●●<strong>Global</strong>●1.0 1.5 2.0 2.5 3.0 3.5 4.0Sex ratio (M:F)1Defi ned as females aged ≥15 years.calculations needed to estimate the incidence of MDR-TB;and the number of prevalent cases of MDR-TB directlyinfluences the active transmission of strains of MDR-TB.The number of prevalent cases of MDR-TB can be estimatedas the product of the estimated number of prevalentcases of TB and the best estimate of the proportionof notified TB patients 1 with MDR-TB (and in China adirect measurement is available from the 2010 nationalTB prevalence survey). <strong>Global</strong>ly in 2011, there were anestimated 630 000 cases of MDR-TB (range, 460 000–1This includes new and retreatment cases (see Chapter 3 fordefinitions).2Class A continuous surveillance refers to data from ongoingsurveillance of drug resistance that are representative of thecaseload of patients.3Guidelines for the surveillance of drug resistance in tuberculosis, 4thed. Geneva, World Health Organization, 2010 (WHO/HTM/TB/2009.422).4For further details, see Box 2.6 in the 2011 WHO report onglobal TB control.790 000) among the world’s 12 million prevalent cases ofTB. Estimates at country level are not presented for reasonsexplained in Annex 1. However, estimates of the proportionof new and retreatment cases that have MDR-TBare summarized in Table 2.3.A recurring and important question is whether thenumber of MDR-TB cases is increasing, decreasing or stable.A reliable assessment of trends in MDR-TB requiresdata from Class A continuous surveillance 2 or data fromperiodic surveys of drug resistance that are designed,implemented and analysed according to WHO guidelines.3 There has been substantial progress in the coverageof continuous surveillance and surveys of drug resistance(Figure 2.16). Unfortunately, progress is not yet sufficientto provide a definitive assessment of trends in MDR-TBglobally or regionally. 420 GLOBAL TUBERCULOSIS REPORT 2012
FIGURE 2.12 Trends in estimated TB mortality rates 1990–2011 and forecast TB mortality rates 2012–2015, by WHOregion. Estimated TB mortality excludes TB deaths among HIV-positive people. Shaded areas represent uncertaintybands. a The horizontal dashed lines represent the Stop TB Partnership target of a 50% reduction in the mortality rate by2015 compared with 1990. The other dashed lines show projections up to 2015.6040Africa86The Americas605040Eastern Mediterranean430Rate per 100 000 population per year2008Europe2060South-East Asia201002520Western Pacific640154220105001990 1995 2000 2005 2010 2015 1990 1995 2000 2005 2010 2015 1990 1995 2000 2005 2010 20150aThe width of an uncertainty band narrows as the proportion of regional mortality estimated using vital registration data increases or the quality and completeness of thevital registration data improves.2.5 Strengthening measurement of theburden of disease caused by TB: theWHO <strong>Global</strong> Task Force on TB ImpactMeasurementThe estimates of TB incidence, prevalence and mortalityand their trend presented in sections 2.1–2.4 are based onthe best available data and analytical methods. In 2009,methods were fully revised, and since April 2009 consultationshave been held with 96 countries accounting for89% of the world’s TB cases. Nonetheless, there is considerablescope for further improvement. This final sectionof the chapter describes the latest status of efforts toimprove measurement of the burden of disease caused byTB, under the umbrella of the WHO <strong>Global</strong> Task Force onTB Impact Measurement.Established in mid-2006, the mandate of the WHO<strong>Global</strong> Task Force on TB Impact Measurement is to ensurethe best possible assessment of whether the 2015 globaltargets for reductions in the burden of disease caused byTB are achieved, to report on progress in the years leadingup to 2015 and to strengthen capacity for monitoring andevaluation at the country level. The Task Force includesrepresentatives from leading technical and financial partnersand countries with a high burden of TB. 1At its second meeting in December 2007, the TaskForce defined three strategic areas of work: 2● strengthening surveillance towards the ultimate goalof direct measurement of incidence and mortality fromnotification and VR systems;● conducting surveys of the prevalence of TB disease ina set of global focus countries that met epidemiologicaland other relevant criteria; and● periodic revision of the methods used to translate surveillanceand survey data into estimates of TB incidence,prevalence and mortality.The third area of work is discussed in more detail inAnnex 1. The following sections focus on the first twostrategic areas of work. Full details of the Task Force’swork are available on its web site. 31Partners that are actively participating in the work of the TaskForce include the Centers for Disease Control and Preventionin the USA, the European Centre for Disease Prevention andControl, the <strong>Global</strong> Fund, the Health Protection Agency in theUK, the KNCV <strong>Tuberculosis</strong> Foundation, the London Schoolof Hygiene and Tropical Medicine in the UK, the ResearchInstitute for <strong>Tuberculosis</strong> in Japan, the Union and USAID.Many countries with a high burden of TB are engaged in thework of the Task Force.2TB impact measurement: policy and recommendations for how toassess the epidemiological burden of TB and the impact of TB control.Geneva, World Health Organization, 2009 (Stop TB policypaper no. 2; WHO/HTM/TB/2009.416).3www.who.int/tb/advisory_bodies/impact_measurement_taskforceGLOBAL TUBERCULOSIS REPORT 2012 21
FIGURE 2.13 Trends in TB mortality rates in Eastern European countries, 1990–2011. The solid orange line shows the bestestimate of the TB mortality rate and the orange band represents the uncertainty related to this estimate. a Uncertaintyis due to adjustments made to the mortality data from vital registration systems that were reported by countries (thereported data are represented by the “x” symbol). <strong>Report</strong>ed data were adjusted to account for incomplete coverage (deathswith no reported cause) and ill-defi ned causes, and the uncertainty range does not account for miscoding of causes ofdeaths (such as HIV deaths miscoded as TB deaths); further explanation of methods is provided in Annex 1.ArmeniaAzerbaijanBelarusBulgaria1086425201510510866543GeorgiaKazakhstanKyrgyzstanLatviaTB mortality rate per 100 000 population per year987654313121110987Lithuania4030201015105Republic of Moldova25201510121086Romania1210864201510Russian Federation252015105Tajikistan40353025201510Turkmenistan25201510Ukraine201510Uzbekistan1990 1995 2000 2005 20111990 1995 2000 2005 2011 1990 1995 2000 2005 2011 1990 1995 2000 2005 2011aThe width of an uncertainty band narrows as the quality and completeness of the vital registration data improves.FIGURE 2.14 Changes in TB mortality and gross nationalincome (GNI) per capita in Latvia, 1990–2011. The vertical dashed line shows the GNI percapita in 1990, prior to the economic crisis. Theeconomy shrank during the early 1990s and thelevel of 1990 was only recovered in 1999.TB mortality rate per 100 000 population per year1997 199819961999121995200019942001108619931992199119902002200320046000 8000 10000 12000 14000 16000GNI per capita (US$)2005200620102007200920082.5.1 Strengthening surveillanceIn 2008, the Task Force defined a conceptual frameworkto assess surveillance data as a basis for updatingestimates of the burden of disease caused by TB and fordefining recommendations for how surveillance needs tobe improved to reach the ultimate goal of direct measurementof TB cases and deaths from notification and VRdata (Figure 2.2). Tools to implement the framework werealso developed, and used in the 96 country consultationsillustrated in Figure 2.1. Major challenges in current estimatesof TB incidence include reliance on expert opinionabout the number of cases that are diagnosed but notreported to national surveillance systems and the numberof cases that are not diagnosed at all. Major challenges inestimating TB mortality include the lack of VR systems ofsufficient coverage and quality in many countries, notablyin Africa and parts of Asia (Figure 2.11).Since 2011, the Task Force’s three priorities have been:● developing and applying standards and benchmarksfor TB surveillance;● preparing a guide on inventory studies to measure TBunder-reporting;22 GLOBAL TUBERCULOSIS REPORT 2012
● producing and widely disseminating a guide on electronicrecording and reporting (ERR) for TB care andcontrol.These are discussed in more detail below.Standards and benchmarks for TB surveillanceThe long-term goal is direct measurement of the burdenof disease caused by TB from routine surveillance data,using notification data to measure TB incidence andVR data to measure TB mortality. Achieving this goalrequires strengthened surveillance in most countries.While the need to “strengthen surveillance” is difficultto dispute in many countries, putting it into practicerequires a clear understanding of what a “model” surveillancesystem should look like and a method for assessingthe current performance of TB surveillance. An assessmentof the performance of TB surveillance could thenbe used to identify which countries have surveillancesystems that already provide an accurate measure of thenumber of TB cases and deaths that occur each year, andto define the actions necessary to strengthen surveillancein countries in which gaps are identified. Countries inthe former category could be “certified” or “accredited” ashaving TB surveillance data that provide a direct measureof TB incidence and/or mortality.In 2011, the Task Force’s subgroup on TB surveillancebegan work on a TB surveillance checklist of standardsand benchmarks, the purpose of which is to:● assess a national surveillance system’s ability to accuratelymeasure TB cases and deaths; and● identify gaps in national surveillance systems thatneed to be addressed.The standards are general statements about the characteristicsthat define a high-performance TB surveillancesystem. For each standard, benchmarks define (in quantitativeterms wherever possible) the level of performancethat is considered good enough to meet the standard.A prototype checklist was developed in the first half of2011. Progress in piloting and refinement of the checklistaccelerated after June 2011 mainly due to intensifiedcollaboration between WHO and the Centers for DiseaseControl and Prevention in the United States of America(USA). By mid-2012, three rounds of testing had beencompleted with the checklist applied in Brazil, China,Egypt, Estonia, Japan, Kenya, the Netherlands, Thailand,Uganda, the United Kingdom (UK) and the USA;two global meetings to discuss findings and refine thechecklist had been held; and a close-to-final version ofthe checklist was available. The pre-final version contains9 standards related to measurement of TB cases and onestandard related to measurement of TB deaths. For standardsrelated to measurement of TB cases, one is specificto paper-based systems with aggregated data and oneis specific to electronic case-based systems. For a coun-TABLE 2.3 Estimated proportion of TB cases that haveMDR-TB, 27 high MDR-TB burden countries andWHO regionsESTIMATED% OF NEW TBCASES WITHMDR-TB aCONFIDENCEINTERVALESTIMATED% OFPREVIOUSLYTREATEDTB CASESWITH MDR-TB aCONFIDENCEINTERVALArmenia 9.4 7.1–12 43 38–49Azerbaijan 22 19–26 55 52–60Bangladesh 1.4 0.7–2.5 29 24–34Belarus 32 30–35 76 72–79Bulgaria 2.0 1.1–3.2 26 19–33China 5.7 4.6–7.1 26 22–30DR Congo 3.1 0.1–7.1 10 2.1–18Estonia 23 17–29 58 43–71Ethiopia 1.6 0.9–2.7 12 5.6–21Georgia 11 9.6–12 32 28–35India 2.1 1.5–2.7 15 13–17Indonesia 1.9 1.4–2.5 12 8.1–17Kazakhstan 30 29–32 51 50–53Kyrgyzstan 26 23–31 52 45–58Latvia 13 10–16 29 20–40Lithuania 11 9.2–13 49 44–54Myanmar 4.2 3.1–5.6 10 6.9–14Nigeria b 3.1 0.1–7.1 10 2.1–18Pakistan 3.4 0.1–11 29 2.6–56Philippines 4.0 2.9–5.5 21 14–29Republic of Moldova 19 17–22 64 60–67Russian Federation 20 18–22 46 41–52South Africa 1.8 1.4–2.3 6.7 5.5–8.1Tajikistan 13 9.8–16 54 48–59Ukraine 16 14–18 44 40–49Uzbekistan 23 18–30 62 53–71Viet Nam 2.7 2–3.6 19 14–25High MDR-TBburden countries4.3 2.1–6.4 21 12–30AFR 2.9 0.1–6.2 11 3.4–18AMR 2.0 0.8–3.3 11 4.5–18EMR 3.4 0.1–10 30 6.9–53EUR 15.1 10–20 44 40–49SEAR 2.1 1.8–2.5 16 12–19WPR 4.8 3.4–6.1 22 18–26<strong>Global</strong> 3.7 2.1–5.2 20 13–26aBest estimates are for the latest available year. Estimates in italics are based onregional data.bDirect measurements will be available shortly and are expected to be consistentwith the estimates provided in the table.GLOBAL TUBERCULOSIS REPORT 2012 23
FIGURE 2.15 Trends in estimated TB mortality rates 1990–2011 and forecast TB mortality rates 2012–2015, 22 highburdencountries. Estimated TB mortality excludes TB deaths among HIV-positive people. Shaded areas representuncertainty bands. The horizontal dashed lines represent the Stop TB Partnership target of a 50% reduction in themortality rate by 2015 compared with 1990. The other dashed lines show projections up to 2015.Rate per 100 000 population per yearAfghanistanBangladesh120100100808060604040202000DR CongoEthiopia6010040502000MozambiqueMyanmar250200200150150100100505000Russian FederationSouth Africa20100801560104052000Viet NamZimbabwe1008080606040402020001990 1995 2000 2005 2010 2015 1990 1995 2000 2005 2010 20156420504030201001005006050403020100BrazilIndia aNigeriaThailand300250200150100500120100806040200150100500100806040200CambodiaIndonesiaPakistanUganda201510505040302010060402006040200ChinaKenyaPhilippinesUR Tanzania1990 1995 2000 2005 2010 2015 1990 1995 2000 2005 2010 2015 1990 1995 2000 2005 2010 2015aEstimates for India have not yet been offi cially approved by the Ministry of Health & FamilyWelfare, Government of India and should therefore be considered provisional.try’s TB surveillance system to be certified as providing adirect measurement of TB cases, all of the standards needto be met. For a country’s surveillance system to providea direct measure of TB deaths, both of the two benchmarks(which are related to geographical coverage anddata quality) must be met.The checklist also includes a supplementary list ofthree standards and associated benchmarks that can beused to assess whether TB surveillance data provide adirect measure of the number of cases of MDR-TB, thenumber of HIV-positive cases of TB and TB in childrenspecifically.The TB surveillance checklist was discussed at meetingsof the Technical Evaluation Reference Group (TERG)of the <strong>Global</strong> Fund and the WHO <strong>Global</strong> Task Force on TBImpact Measurement held in May 2012. There was consensusthat use of the checklist should be integrated withinthe grant processes of the <strong>Global</strong> Fund, with resultsfrom the systematic assessments of existing TB surveillanceusing the checklist then used to develop an “investmentplan” to strengthen surveillance. With more than100 low-income and middle-income countries receivinggrants for TB care and control from the <strong>Global</strong> Fund, thisapproach has great potential to make a real difference toTB surveillance worldwide. As of July 2012, the aim wasto apply the checklist in three countries before the endof 2012, and in approximately 15 countries by mid-2014.Inventory studies to measure TB under-reportingInventory studies with record-linkage are used to quantifythe number of TB cases that are diagnosed but notrecorded in surveillance (notification) data. They allowa much better estimation of TB incidence because theyprovide concrete evidence of the gap between notifiedcases and diagnosed cases (which may be especiallybig in countries with a large private sector). Oneof the standards in the TB surveillance checklist is thatunderreporting of diagnosed TB cases is minimal, with abenchmark that in a national investigation less than 10%of diagnosed cases are missed by TB surveillance. Inventorystudies are needed to provide evidence of the level ofunder-reporting; if reporting is below acceptable levels,24 GLOBAL TUBERCULOSIS REPORT 2012
FIGURE 2.16 Progress in global coverage of data on drug resistance, 1994–2011Year of most recentrepresentative dataon anti-TB drugsurveillance1995–19992000–20042005–20092010–2011Ongoing 2012No dataSubnational data onlyNot applicablecorrective actions need to be identified and implemented.Inventory studies have been implemented in very fewcountries to date. Examples include the UK, the Netherlandsand several countries in the Eastern MediterraneanRegion (Egypt, Iraq, Yemen and, most recently, Pakistan).To facilitate and encourage inventory studies in morecountries, WHO and its partners (notably the Centers forDisease Control and Prevention in the USA and the UK’sHealth Protection Agency) initiated the development of aguide on how to design, implement, analyse and reporton inventory studies in 2011. As this report went to press,the guide was due to be published before the end of 2012.Electronic recording and reporting of dataAssessment of various aspects of data quality is the firstand most basic of the three major components of theTask Force’s framework for assessing surveillance data(Figure 2.2) and several of the standards in the TB surveillancechecklist are about data quality. In all of theregional and country workshops held between 2009 and2012, it was evident that it is much easier to assess thequality of TB surveillance data in countries with casebasedelectronic recording and reporting. In 2011, WHOand its partners produced a guide on electronic recordingand reporting for TB care and control, which was widelydisseminated in April 2012 (Box 2.5).2.5.2 Surveys of the prevalence of TB diseaseNationwide population-based surveys of the prevalenceof TB disease provide a direct measurement of the numberof TB cases; repeat surveys conducted several yearsapart can allow direct measurement of trends in diseaseburden. Surveys are most relevant in countries where theburden of TB is high (otherwise sample sizes and associatedcosts and logistics become prohibitive) and surveillancesystems are thought (or known) to miss a largefraction of cases.Before 2007, few countries had implemented prevalencesurveys (Figure 2.9, Figure 2.17). In the 1990s,national surveys were confined to China, Myanmar, thePhilippines and the Republic of Korea. Before 2009 andwith the exception of Eritrea in 2005, the last nationalsurveys in the African Region were undertaken between1957 and 1961. From 2002 to 2008, there was typicallyone survey per year. In 2007, WHO’s <strong>Global</strong> Task Forceon TB Impact Measurement identified 53 countries thatmet epidemiological and other criteria for implementing asurvey. A set of 22 global focus countries were selected toreceive particular support in the years leading up to 2015.Following five years of substantial efforts by countries,supported by the Task Force (Box 2.6), enormousprogress has been achieved (Figure 2.17). If surveys areimplemented according to schedule, around 20 surveyswill be implemented during 2011–2013, with a majorpeak in activity in 2012 and 2013. The number of surveysbeing implemented at the same time in 2012, at five,GLOBAL TUBERCULOSIS REPORT 2012 25
BOX 2.5New guidance on electronic recording and reporting for TB care and controlSurveillance systems depend on countries keeping good records of all TB cases notifi ed to national TB control programmes (NTPs) and ofTB treatment outcomes. This is a data-intensive activity that is increasingly moving away from paper-based to electronic recording andreporting (ERR).Advantages of ERR include:■ Better management of individual patients, for example by providing fast access to laboratory results;■ Better programme and resource management, by encouraging staff to use and act upon live data. This may help to prevent defaultingfrom treatment and assist with management of drug supplies (including avoidance of stockouts);■ Improved surveillance by making it easier for facilities not traditionally linked to the NTP, suchas hospitals, prisons and the private sector, to report TB cases, and by reducing the burden ofcompiling and submitting data through paper-based quarterly reports;■ Greater analysis and use of data, since data can be readily imported into statistical packages,results are available to decision-makers more quickly and it is possible to detect outbreakspromptly;■ Higher quality data, since automated data quality checks can be used and duplicate ormisclassifi ed notifi cations can be identifi ed and removed (which is very diffi cult or impossible to donationally with paper-based systems). It is also easier to introduce new data items.WHO coordinated the development of a guide on how to design and implement ERR according to bestpracticestandards in 2011. The guide was widely disseminated in April 2012 and is available atwww.who.int/tb/publications/electronic_recording_reportingFIGURE 2.17 <strong>Global</strong> progress in implementing national surveys of the prevalence of TB disease, actual (2002–2012)and expected (2013–2017)Number of surveys11109876543210Asia – GFC Africa – GFC Other<strong>Global</strong> focuscountries (GFC) selected byWHO <strong>Global</strong> Task Force onTB Impact MeasurementViet NamCambodia Malaysia Indonesia Eritrea Thailand Philippines Bangladesh Myanmar China Ethiopia UR Tanzania Indonesia Bangladesh2002 2003 2004 2005 2006 2007 2008 2009 2010 2011 2012 2013 2014–2017Lao PDRPakistanCambodiaRwandaThailandNigeriaGambiaSudanDPR KoreaNepalMongoliaSouth AfricaZambiaKenyaMalawiUgandaGhanaPhilippinesMyanmarViet Nam26 GLOBAL TUBERCULOSIS REPORT 2012
BOX 2.6Efforts by the Task Force to support TB prevalence surveys and build “AA” collaborationThe WHO <strong>Global</strong> Task Force on TB Impact Measurement has strongly recommended national TB prevalence surveys in 22 global focuscountries: 13 in Africa and 9 in Asia. The African countries are Ethiopia, Ghana, Kenya, Malawi, Mali, Mozambique, Nigeria, Rwanda,Sierra Leone, South Africa, Uganda, the United Republic of Tanzania and Zambia. The Asian countries are Bangladesh, Cambodia, China,Indonesia, Myanmar, Pakistan, the Philippines, Thailand and Viet Nam.Since 2008, the Task Force has made substantial efforts to support countries to design, implement, analyse and report on surveys. TheTask Force subgroup on TB prevalence surveys, led by WHO, has been very active and activities have included:■ close collaboration with the <strong>Global</strong> Fund to help secure full funding for surveys through reprogramming of grants (several surveys wereinitially under-budgeted);■ workshops to develop protocols and expert reviews of protocols by at least two Task Force partners not directly involved in the survey;■ production of a second edition of a WHO handbook on TB prevalence surveys (also known as “the lime book”), which providescomprehensive theoretical and practical guidance on all aspects of surveys. 1 The book was produced as a major collaborative effortinvolving 15 agencies and institutions and 50 authors in 2010, and was widely disseminated in 2011;■ training courses for survey coordinators without prior experience of survey implementation, including opportunities to observe fi e ldoperations in ongoing surveys;■ training courses to build a group of junior international consultants who can provide technicalassistance to countries;■ country missions by experts from the Task Force, mostly funded by the US government through theTB-TEAM mechanism (see Box 5.2 in Chapter 5).The concept of Asia–Asia, Asia–Africa and Africa–Africa (“AA”) collaboration has been stronglypromoted. This involves building collaboration among countries implementing surveys such that surveycoordinators and other staff can learn from and help each other, with the result that capacity toimplement prevalence surveys is built at country, regional and global levels. Examples of AA collaborationare survey coordinators from Asian countries providing guidance and support to those leading surveysin African countries where no recent experience exists; survey staff from Ethiopia providing support toAfrican countries planning surveys in 2012 and 2013; exchange visits and study tours; workshops toobserve central and fi eld operations hosted by Cambodia and Thailand; and mid-term reviews in whichsurvey coordinators visit other countries where survey operations are underway.Besides WHO, technical partners that are actively engaged in prevalence surveys include the Centers for Disease Control and Prevention,USA; the KNCV <strong>Tuberculosis</strong> Foundation in the Netherlands; the London School of Hygiene and Tropical Medicine, UK; and the ResearchInstitute for <strong>Tuberculosis</strong>, Japan.1TB prevalence surveys: a handbook. Geneva, World Health Organization, 2011 (WHO/HTM/TB/2010.17).www.who.int/tb/advisory_bodies/impact_measurement_taskforce/resources_documents/thelimebookis already unprecedented. As this report went to press,surveys were nearing completion in the Gambia, Nigeria,Rwanda, Thailand and the United Republic of Tanzania,with results expected in the first half of 2013.In late 2011 and early 2012, results from surveys completedin Ethiopia (June 2011) and Cambodia (September2011) were disseminated. The Ethiopian survey found alower prevalence of TB than was previously estimated,with most cases in young adults. As this report went topress, dissemination of results from surveys in the LaoPeople’s Democratic Republic and Pakistan was expectedby early 2013.Cambodia is only the third high-burden country toimple ment a repeat national prevalence survey in thepast 20 years (following China and the Philippines).The results provide an excellent example of the value ofnational TB prevalence surveys for measuring diseaseburden, evaluating the impact of TB control and identifyingways to improve TB care and control in future(Box 2.7).GLOBAL TUBERCULOSIS REPORT 2012 27
BOX 2.7Reducing the burden of TB disease: a success story from CambodiaFor the last two decades, Cambodia has been known to have one of the highest levels of TB burden (in terms of rates per 100 000population) in the world. TB control in Cambodia was reinstated in 1994 following decades of civil confl ict and economic hardship. TBservices were fi rst limited to provincial and district hospitals. Decentralization of TB control services to the health centre level was initiatedin the early 2000s, with nationwide expansion achieved in 2005, contributing to rapidly increasing case notifi cations (depicted with asolid black line in Figure B2.7.1).At the early stage of DOTS expansion to health centres, the National TB Programme decided to directly measure the burden of TB througha nationwide prevalence survey, completed in 2002. A total of 22 160 people aged ≥15 years participated in the survey, grouped in 42geographically determined clusters. The survey identifi ed 81 smear-positive TB cases (63% were symptomatic) and 190 smear-negativeculture-positive cases. After adjustment for unconfi rmed TB and forFIGURE B2.7.1Case notification and estimated incidence rates inCambodia, 1990–2011Rate per 100 000 population per year700600500400300200100Estimated incidence rateCase notification rate1990 1995 2000 2005 2010FIGURE B2.7.2Estimated TB prevalence (all forms) in Cambodia,1990–2011Rate per 100 000 population200015001000Survey 150% reduction target1990 1995 2000 2005 2010Survey 2childhood TB, the prevalence rate for all forms of TB was estimated at1511 (range 1244–1803) per 100 000 population, one of the highestprevalence rates observed in the world in recent history.A second nationally representative survey was conducted in 2011. Intotal, 39 680 people aged ≥15 years were sampled from 62 clusters.95 smear-positive TB cases (46% were symptomatic) and 218 smearnegativeculture-positive TB cases were identifi ed. After adjustmentfor unconfi rmed TB and for childhood TB, the prevalence rate for allforms of TB was estimated at 817 (range 690–954) per 100 000population, showing a statistically signifi cant reduction since the fi rstsurvey.Most bacteriologically-confi rmed prevalent cases did not reportsymptoms listed in the screening criteria. The proportion of peoplereporting TB symptoms listed in the screening criteria amongbacteriologically-confi rmed cases declined from 30% in 2002 to 22%in 2011. This highlights the need to revise criteria for TB screening inself-reporting patients, in favour of more sensitive criteria than thetraditional but insensitive criteria of a cough of ≥2weeks. There wasa signifi cant decline in prevalence rates for all age groups but thebiggest reduction was observed in younger age groups. The 2011survey also highlighted the need for more sensitive diagnostics thansputum smear microscopy.The repeat survey provides robust evidence of a decline in TBburden in Cambodia, following DOTS expansion in 2002 (FigureB2.7.2). Results indicate a 45% reduction in the prevalence ofbacteriologically-confi rmed cases since the fi rst national prevalencesurvey conducted in 2002, that is, over a period of only 9 years.The Cambodia results provide a major success story for TB control.28 GLOBAL TUBERCULOSIS REPORT 2012
CHAPTER 3TB case notificationsand treatment outcomesKEY FACTS AND MESSAGES In 2011, 6.2 million cases of TB were notifi ed bynational TB control programmes and reported to WHO:5.8 million were individuals newly diagnosed in 2011and 0.4 million were previously diagnosed TB patientswhose treatment regimen was changed. India and Chinaaccounted for 39% of notifi ed cases of TB worldwide in2011, Africa for 24% and the 22 HBCs for 81%. In 2010, the treatment success rate was 85% amongall new TB cases and 87% among new cases of sputumsmear-positive pulmonary TB (the most infectious cases).Improvement in treatment outcomes is needed in theEuropean Region, where the treatment success rate in2010 was 74% and 67% for new cases and new smearpositivecases respectively. The provision of diagnosis and treatment accordingto the DOTS/Stop TB Strategy has resulted in majorachievements in TB care and control. Between 1995and 2011, 51 million people were successfully treatedfor TB in countries that had adopted the DOTS/Stop TBStrategy, saving 20 million lives. Notifi cations of TB cases have stabilized in recentyears, and in 2011 represented 66% (range, 64–69%)of estimated incident cases. Major efforts are neededto ensure that all cases are detected, notifi ed tonational surveillance systems and treated accordingto international standards, for example through PPMinitiatives. In most of the 21 countries that reported data,PPM initiatives contributed about 10-40% of totalnotifi cations. In countries reporting age-disaggregated data, mostcases (88%) were aged 15–64 years. Children (aged
TABLE 3.1 TB case notifications, 2011TOTALNOTIFIEDSMEAR-POSITIVESMEAR-NEGATIVENEWSMEAR NOTDONEEXTRA-PULMONARYCASE TYPEUNKNOWNRELAPSERETREATMENTRETREATMENTEXCL. RELAPSENEW ANDRELAPSE(A)HISTORYUNKNOWNPERCENTNEW PULMO-NARY CASESSMEAR-POSITIVEAfghanistan 28 167 13 789 4 166 1 989 6 286 623 1 130 184 27 983 69Bangladesh 159 023 98 948 21 921 0 27 329 0 2 701 4 665 150 899 3 459 82Brazil 84 137 40 294 12 683 8 278 10 067 15 3 555 6 490 74 892 2 755 66Cambodia 39 670 15 812 7 686 0 14 690 0 367 1 115 38 555 0 67China 911 884 377 005 479 486 2 028 6 540 0 34 610 12 215 899 669 0 44DR Congo 114 290 71 321 13 471 21 579 3 761 4 158 110 132 84Ethiopia 159 017 49 594 52 967 2 530 49 305 0 2 143 2 478 156 539 0 47India 1 515 872 642 321 340 203 226 965 1 952 112 508 191 923 1 323 949 65Indonesia 321 308 197 797 101 750 14 054 5 348 2 359 318 949 66Kenya 103 981 37 085 30 394 9 416 17 069 0 3 356 6 661 97 320 0 48Mozambique 47 452 19 537 18 159 0 5 504 0 1 427 2 825 44 627 0 52Myanmar 143 140 42 324 62 038 27 769 4 606 6 403 136 737 41Nigeria 93 050 47 436 33 034 0 3 793 0 2 515 6 272 86 778 0 59Pakistan 270 394 105 733 103 824 0 45 537 0 5 947 5 460 261 041 3 893 50Philippines 202 033 90 876 95 297 2 202 0 3 190 10 468 191 565 0 49Russian Federation 159 479 29 191 63 917 1 189 10 023 8 590 46 569 112 910 31South Africa 389 974 129 770 70 341 77 925 47 285 0 18 394 27 521 343 715 18 738 47Thailand 67 676 33 169 20 726 10 014 0 1 915 1 852 65 824 0 62Uganda 49 016 25 614 12 830 1 559 5 001 1 302 2 710 46 306 64UR Tanzania 61 148 24 115 20 438 0 13 725 0 1 079 1 791 59 357 0 54Viet Nam 100 176 50 719 20 205 17 934 2 679 6 925 1 714 98 462 72Zimbabwe 41 305 12 596 15 303 3 869 5 192 0 1 444 2 901 38 404 0 40High-burdencountries5 062 192 2 155 046 1 600 839 108 783 587 863 5 269 226 813 348 734 4 684 613 28 845 56AFR 1 460 766 605 929 357 811 109 258 240 843 1 069 52 283 74 622 1 367 193 18 951 56AMR 231 880 121 130 36 371 14 254 33 757 1 315 10 004 11 613 216 831 3 436 71EMR 425 821 170 748 128 182 7 206 93 605 623 11 223 10 102 411 587 4 132 56EUR 356 670 79 831 121 362 6 896 42 489 3 191 22 838 73 296 275 872 7 502 38SEAR 2 358 127 1 067 367 598 800 0 333 993 2 878 135 650 215 554 2 138 688 3 885 64WPR 1 383 249 576 044 630 219 17 435 68 949 2 708 50 841 33 257 1 346 196 3 796 47<strong>Global</strong> 6 216 513 2 621 049 1 872 745 155 049 813 636 11 784 282 839 418 444 5 756 367 41 702 56Blank cells indicate data not reported.TB for the first time and 0.3 million were people who hada recurrent episode of TB after being previously cured ofthe disease. Besides a small number of cases whose historyof treatment was not recorded, the remaining 0.4 millionhad already been diagnosed with TB but their treatmentwas changed to a retreatment regimen (for definitions ofeach type of case, see Box 3.1).Among people who were diagnosed with TB for thefirst time (new cases), 2.6 million had sputum smear-positivepulmonary TB, 1.9 million had sputum smear-negativepulmonary TB, 0.2 million did not have a sputumsmear done and 0.8 million had extrapulmonary TB(Table 3.1). Of the new cases of pulmonary TB, 56% weresputum smear-positive.India and China accounted for 39% of the 5.8 millionnew and relapse cases of TB that were notified in2011 (23% and 16%, respectively); the South-East Asiaand Western Pacific regions of which these countries area part accounted for 60% of cases globally. African countriesaccounted for 24% (one quarter of these cases werefrom one country – South Africa). The WHO EasternMediterranean and European regions and the Region ofthe Americas accounted for 16% of new and relapse casesnotified in 2011 (7%, 5% and 4%, respectively). The 22HBCs accounted for 81%.Among the 22 HBCs, the percentage of new cases ofpulmonary TB that were sputum smear-positive was relativelylow in the Russian Federation (31%), Zimbabwe(40%), Myanmar (41%), South Africa (47%), Ethiopia(47%) and Kenya (48%). A comparatively high proportionof new cases of pulmonary TB were sputum smearpositivein Bangladesh (82%), the Democratic Republic ofthe Congo (84%) and Viet Nam (72%).Almost all (98%) of the notifications of new cases of30 GLOBAL TUBERCULOSIS REPORT 2012
BOX 3.1 1Definitions of TB casesDefinite case of TB A patient with Mycobacterium tuberculosis complex identifi ed from a clinical specimen, either by culture or bya newer method such as molecular line probe assay. In countries that lack laboratory capacity to routinely identify M. tuberculosis, apulmonary case with one or more initial sputum specimens positive for acid-fast bacilli (AFB) is also considered to be a “defi nite” case,provided that there is functional external quality assurance with blind rechecking.Case of TB A defi nite case of TB (defi ned above) or one in which a health worker (clinician or other medical practitioner) has diagnosedTB and decided to treat the patient with a full course of anti-TB treatment.Case of pulmonary TB A patient with TB disease involving the lung parenchyma.Smear-positive pulmonary case of TB A patient with one or more initial sputum smear examinations (direct smear microscopy) AFBpositive;or one sputum examination AFB-positive plus radiographic abnormalities consistent with active pulmonary TB as determined by aclinician. Smear-positive cases are the most infectious and thus of the highest priority from a public health perspective.Smear-negative pulmonary case of TB A patient with pulmonary TB who does not meet the above criteria for smear-positive disease.Diagnostic criteria should include: at least two AFB-negative sputum smear examinations; radiographic abnormalities consistent withactive pulmonary TB; no response to a course of broad-spectrum antibiotics (except in a patient for whom there is laboratory confi rmationor strong clinical evidence of HIV infection); and a decision by a clinician to treat with a full course of anti-TB chemotherapy. A patientwith positive culture but negative AFB sputum examinations is also a smear-negative case of pulmonary TB.Extrapulmonary case of TB A patient with TB of organs other than the lungs (e.g. pleura, lymph nodes, abdomen, genitourinary tract,skin, joints and bones, meninges). Diagnosis should be based on one culture-positive specimen, or histological or strong clinical evidenceconsistent with active extrapulmonary disease, followed by a decision by a clinician to treat with a full course of anti-TB chemotherapy. Apatient in whom both pulmonary and extrapulmonary TB has been diagnosed should be classifi ed as a pulmonary case.New case of TB A patient who has never had treatment for TB or who has taken anti-TB drugs for less than one month.Retreatment case of TB There are three types of retreatment case: (i) a patient previously treated for TB who is started on aretreatment regimen after previous treatment has failed (treatment after failure); (ii) a patient previously treated for TB who returns totreatment having previously defaulted; and (iii) a patient who was previously declared cured or treatment completed and is diagnosedwith bacteriologically-positive (sputum smear or culture) TB (relapse).Case of multidrug-resistant TB (MDR-TB) TB that is resistant to two fi rst-line drugs: isoniazid and rifampicin. For most patientsdiagnosed with MDR-TB, WHO recommends treatment for 20 months with a regimen that includes second-line anti-TB drugs.Note: New and relapse cases of TB are incident cases. Cases of TB started on a retreatment regimen following treatment failure or treatmentinterruption are prevalent cases.1See Treatment of tuberculosis guidelines, 4th ed. Geneva, World Health Organization, 2010 (WHO/HTM/STB/2009.420).BOX 3.2Achievements in global TB care and control, 1995–2011WHO began systematic monitoring of progress in TB control in 1995. Data compiled on an annual basis since then allow achievements inTB care and control to be assessed.Between 1995 and 2011, 51 million people were successfully treated for TB in countries that had adopted the DOTS/Stop TB Strategy(out of a total of 60 million treated). This saved approximately 20 million lives. 1The number of lives saved is based on the estimate that in the absence of treatment, approximately 40% of people with TB would dieof the disease. This estimate allows for differences in the mortality rates for smear-positive compared with other types of TB disease (seeChapter 1), and for differences in mortality rates between HIV-negative and HIV-positive people.1For estimates of the incremental number of lives saved by improvements in TB care associated with implementation of the DOTS and Stop TB Strategycompared with pre-1995 standards of care, see Glaziou P et al. Lives saved by tuberculosis control and prospects for achieving the 2015 global target forreducing tuberculosis mortality. Bulletin of the World Health Organization, 2011, 89:573–582.GLOBAL TUBERCULOSIS REPORT 2012 31
TABLE 3.2 Notifications of new cases of smear-positive pulmonary TB by age and sex, 20110–14 YEARS 15–44 YEARS 45–64 YEARS ≥65 YEARS % AGED < 15 YEARS MALE/FEMALE RATIOAfghanistan 669 8 574 3 319 1 227 5 0.51Bangladesh 932 53 585 30 877 13 554 < 1 1.9Brazil 692 25 270 11 080 3 211 2 2.2Cambodia 73 6 810 6 412 2 581 < 1 1.2China 1 378 173 523 128 585 73 519 < 1 2.6DR Congo 3 379 47 529 17 207 3 206 5 1.2Ethiopia 3 830 38 518 6 272 1 074 8 1.2India 12 985 388 447 187 705 53 174 2 2.2Indonesia 1 714 115 631 67 378 13 074 < 1 1.5Kenya 985 29 884 5 207 1 009 3 1.6Mozambique — —Myanmar 307 23 902 14 198 3 907 < 1 1.9Nigeria 1 107 34 559 9 604 2 167 2 1.6Pakistan 3 895 64 309 27 495 10 034 4 1.1Philippines 953 51 919 31 069 6 935 1 2.4Russian Federation 51 18 066 9 477 1 597 < 1 2.7South Africa 3 404 94 427 27 552 4 387 3 1.2Thailand 114 14 980 11 862 6 213 < 1 2.4Uganda 695 18 486 4 842 917 3 1.8UR Tanzania 411 17 149 5 047 1 508 2 1.8Viet Nam 95 23 404 18 271 8 949 < 1 3.0Zimbabwe 326 9 953 1 879 438 3 1.2High-burden countries 37 995 1 258 925 625 338 212 681 2 1.9AFR 19 183 427 731 114 303 23 574 3 1.4AMR 2 337 62 127 27 495 11 311 2 1.8EMR 5 763 105 833 42 736 16 303 3 1.2EUR 391 46 807 24 197 6 962 < 1 2.3SEAR 17 144 626 659 329 687 93 857 2 2.0WPR 2 880 272 434 196 490 104 444 < 1 2.4<strong>Global</strong> 47 698 1 541 591 734 908 256 451 2 1.9Blank cells indicate data not reported.— indicates values that cannot be calculated.smear-positive pulmonary TB were disaggregated by ageand sex (Table 3.2); 85% were aged 15–64 years and 2%were children (aged
TABLE 3.3 Contribution of public–private and public–public mix (PPM) to notifications of TB cases in 21 countries, 2011WHO REGION AND COUNTRYTYPES OF NON-NTP CARE PROVIDERS ENGAGEDNUMBER OF NEW TB CASESNOTIFIED IN 2011CONTRIBUTION TO TOTALNOTIFICATIONS OF NEW TBCASES IN 2011AFRICAN REGIONAngola Diverse private and public providers 13 989 28%Ethiopia Diverse private providers 15 052 9.5%Ghana Diverse private and public providers 1 781 11%Kenya Private clinics and hospitals and prisons 10 076 9.6%Nigeria Private clinics and hospitals 21 562 23%UR Tanzania Private facilities and faith-based organizations 13 067 21%REGION OF THE AMERICASEl Salvador Diverse private and public providers 581 30%Haiti Private practitioners, NGOs and prison services 5 170 36%EASTERN MEDITERRANEAN REGIONIran (Islamic Republic of) Diverse private and public providers 3 563 31%Iraq Diverse private and public providers 5 624 61%Pakistan a Private clinics and hospitals 21 117 20%Egypt Health insurance organizations, NGOs and other public providers 2 234 24%Sudan Diverse private and public providers 2 277 11%Syrian Arab Republic Diverse private and public providers 2 694 73%SOUTH-EAST ASIA REGIONBangladesh Diverse private, public and NGO providers 19 668 12%India b Diverse private, public and NGO providers 13 991 2.1%Indonesia Public and private hospitals 71 454 22%Myanmar Diverse private, public and NGO providers 31 838 22%WESTERN PACIFIC REGIONChina General public hospitals 389 112 43%Philippines Private clinics and hospitals 24 031 12%Republic of Korea Diverse private providers 44 684 89%aData are for smear-positive cases of pulmonary TB only.bData are for smear-positive cases of pulmonary TB in 14 cities where PPM surveillance is in place.gated data nationally. 1 Nonetheless, a growing numberof countries are systematically recording and reportingdata on the contribution of PPM initiatives to TB notifications(Table 3.3). In most of the 21 countries (including11 HBCs) for which data were reported, PPM initiativescontributed about 10% to 40% of total notifications.Approaches to engage non-NTP care providers varyaccording to the local context. For example, in the Philippines,the national health insurance organization hasdesigned a special TB package for providers that collaboratewith the NTP. India has incentive-based schemesfor individual and institutional providers. China usesan Internet-based system for mandatory reporting of TBcases by all providers. It is also noticeable that countrieshave prioritized different types of care providers. Theseinclude general public hospitals (in China), private clinicsand hospitals (in Nigeria and the Republic of Korea),1WHO recommends that the source of referral and the place oftreatment should be routinely recorded and reported.medical colleges (in India) and health insurance organizationsthat also provide health services (in Egypt). Socialsecurity organizations and prison health services are themain non-NTP providers in the Region of the Americasand in Eastern Europe, respectively.Comparisons with data reported by countries in previousyears show that the contribution of PPM to case notificationshas grown in some countries, including China,Indonesia, Myanmar and the Republic of Korea. Theunexplained variations in the data from other countriesindicate that their PPM initiatives, and the recording andreporting aspects in particular, need to be strengthened.In most countries, only a small proportion of targetedcare providers collaborate actively with NTPs and contributeto TB case notifications. Achieving early TB casedetection to minimize disease transmission will requiregreater involvement of front-line health workers such ascommunity-based informal providers, general practitionersand pharmacists – who are often the first point ofcontact for people with symptoms of TB. The need forGLOBAL TUBERCULOSIS REPORT 2012 33
BOX 3.3Engaging private providers in countries with a large private sectorData reported by countries indicate that NTPs mostly engage non-profi t and institutional care providers as part of their PPM programmes.Establishing collaborative links with these providers is relatively less demanding than engaging for-profi t private providers and, for agiven amount of effort, may yield a higher number of TB case notifi cations. However, engaging more seriously with for-profi t practitioners,especially in countries with a large private sector, is necessary to increase the number of people with TB who are diagnosed early, treatedaccording to international standards and reported to national TB control programmes. It is also required to reduce costs to TB patients,prevent the emergence and spread of drug-resistant TB and protect soon-to-be-available new anti-TB drugs.The extent of the sale and use of anti-TB drugs in the private sector in 10 countries that account for about 60% of estimated TB casesglobally was assessed in 2011. 1 The private markets in four Asian countries (India, Indonesia, Pakistan and the Philippines) had thelargest volumes of sales relative to estimated numbers of TB cases. Annual sales ranged from 65% to 117% of the drugs needed to treatthe estimated number of incident cases occurring each year with a standard 6–8 month regimen in these countries. The study authorsconcluded that expansion of PPM programmes was needed.Efforts to engage public and private health-care providers in TB care and control have been implemented for several years in India,Indonesia, Pakistan and the Philippines. Nonetheless, the reported data indicate that there is substantial scope for greater engagementof the private sector in these and other countries with a large private sector. Disaggregated data on the contribution of providers in theprivate sector to TB case notifi cations is not reported by most countries; among those that do report, the contribution of the large forprofit private sector is too small to be of any signifi cance. The recent decision by the Government of India to make notifi cation of TB casesmandatory by law is a welcome step in the right direction.1Wells WA et al. Size and usage patterns of private TB drug markets in the high burden countries. PLoS One, 2011, 6(5):e18964.FIGURE 3.1Rate per 100 000 population per year200150100500<strong>Global</strong> trends in case notification (black)and estimated TB incidence (green) rates,1990–20111990 1995 2000 2005 2011greater attention to collaboration with for-profit privateproviders, especially in countries where there is a largeprivate medical sector and anti-TB drugs are readily availablein private pharmacies, is highlighted in Box 3.3.A new initiative to engage nongovernmental organizationsin TB care and control, named ENGAGE-TB, isdescribed in Box 3.4.3.3 Trends in case notifications since 1990and estimates of the case detection rate<strong>Global</strong>ly, the number of TB cases diagnosed and notifiedper 100 000 population has stabilized since 2008,following a marked increase between 2001 and 2007(Figure 3.1). <strong>Global</strong>ly and in all WHO regions, a clear gapbetween the numbers of notified cases and the estimatednumbers of incident cases exists, although this is narrowing,particularly in the Western Pacific Region (mostlydriven by trends in China) and the Region of the Americas(Figure 3.2). Trends in the 22 HBCs are shown in Figure3.3, and for other countries are illustrated in countryprofiles that are available online. 1The case detection rate (CDR) 2 for TB is an indicatorthat is included within the Millennium DevelopmentGoals (Chapter 1). For a given country and year, the CDRis calculated as the number of new and relapse TB cases(see Box 3.1 for definitions) that were notified by NTPs(Table 3.1), divided by the estimated number of incident1www.who.int/tb/data2The CDR is actually a ratio rather than a rate, but the term“rate” has become standard terminology in the context of thisindicator.34 GLOBAL TUBERCULOSIS REPORT 2012
BOX 3.4Integrating community-based TB activities – ENGAGE-TBDuring the past fi ve years, the percentage of estimated cases of incident TB detected and reported to NTPs has stagnated at around60–70%. The “missing” cases are either diagnosed and treated by providers not reporting to the public health system or are not reachedby the current network of providers of TB care at all. Among notifi ed cases, diagnosis may be delayed. To reach the unreached and to fi ndpeople with TB earlier in the course of their illness, a wider range of stakeholders already involved in community-based activities needsto be engaged. These include non-governmental organizations (NGOs) and other civil society organizations that are active in communitybaseddevelopment, particularly in primary health care, maternal and child health and HIV prevention, treatment and care, but which havenot yet included TB in their activities.The ENGAGE-TB initiative seeks to integrate community-basedactivities to control TB in the ongoing work of such NGOs,aligned with national strategies and plans and supported bynew operational guidance developed by WHO. 1 The guidancerecommends the creation or strengthening of NGO coalitionsfor TB care and control, regular meetings between theleadership of such coalitions and NTP staff at various levels,and streamlining monitoring and evaluation through a singlerecording and reporting system. The guidance supports moreexplicit measurement of community-based contributions tocase notifi cations and treatment outcomes. The six componentsthrough which integration can be more systematicallyundertaken are shown in the fi gure opposite.Community-based activities are conducted outside the premisesof formal health facilities (hospitals, health centres and clinics)using community-based structures (such as schools, places ofworship and congregate settings) and homesteads. Examples include:CapacitybuildingMonitoringandevaluation■ creating awareness about TB, communication for behavioural change and community mobilization;■ efforts to reduce stigma and discrimination;■ screening and testing for TB and other TB related co-morbidities (e.g. through HIV counselling and testing, and screening for diabetes),including through home visits;■ facilitating access to diagnostic services, for example by providing transportation to health-care facilities;■ initiating and providing interventions to prevent TB, including isoniazid preventive therapy and TB infection control;■ referring community members for diagnosis of TB and other co-morbidities;■ initiating, providing and observing treatment for TB and other co-morbidities;■ supporting adherence to treatment through peer support, education and individual follow-up;■ supporting social and livelihood schemes, such as food supplementation and income generation;■ providing home-based palliative care for TB and other co-morbidities; and■ supporting community-led advocacy.1ENGAGE-TB: Integrating community-based TB activities into the work of NGOs and other CSOs (in press).SituationanalysisENGAGE-TBapproachTaskidentifi cationEnablingenvironmentGuidelinesand toolscases of TB that year. The CDR is expressed as a percentage;it gives an approximate 1 indication of the proportionof all incident TB cases that are actually diagnosed,reported to NTPs and started on treatment.The best estimate of the CDR for all forms of TB globallyin 2011 was 66% (range, 64–69%), up from 53–59%in 2005 and 38–43% in 1995 – the year in which theDOTS strategy began to be introduced and expanded(Table 3.4). The highest CDRs in 2011 were estimated1It is approximate because of uncertainty in the underlyingincidence of TB and because notified cases are not necessarilya subset of incident cases that occurred in the same year; seeChapter 2 for further discussion.to be in the Region of the Americas (best estimate 84%;range, 79–89%), the Western Pacific Region (best estimate81%; range, 75–89%) and the European Region(best estimate 73%; range, 69–78%). The other regionshad estimated CDRs in the range 55–70%, with best estimatesof around 60%. All regions have improved theirestimated CDRs since the mid-1990s, with improvementsparticularly evident since 2000. Among the 22 HBCs, thehighest rates of case detection in 2011 were estimated tobe in Brazil, China, Kenya, the Russian Federation andthe United Republic of Tanzania; the lowest rates were inAfghanistan, Bangladesh, Mozambique and Nigeria.To close the gap between notified cases and estimatedGLOBAL TUBERCULOSIS REPORT 2012 35
FIGURE 3.2Case notification and estimated TB incidence rates by WHO region, 1990–2011. Regional trends in casenotifi cation rates (new and relapse cases, all forms) (black) and estimated TB incidence rates (green). Shaded areasrepresent uncertainty bands.Africa40080The Americas150Eastern Mediterranean3006010020040Rate per 100 000 population per year1000Europe8060200South-East Asia250200500Western Pacific20015015040100100205050001990 1995 2000 2005 2011 1990 1995 2000 2005 2011 1990 1995 2000 2005 20110TB incidence, action is needed in three broad areas:● strengthening surveillance, to ensure that all casesdiagnosed with TB are reported and accounted for byroutine notification systems. Establishing links withthe full range of health-care providers through PPM,as well as stronger enforcement of legislation regardingnotification of cases (where this is mandated bylaw) can help to minimize the under-reporting of TBcases. Inventory studies (see Section 2.5.1 in Chapter2 for further details) can be used to help quantify theextent to which diagnosed cases are unreported (the“surveillance gap”).● improving diagnostic capacity, to ensure that peoplewith TB who seek care are actually diagnosed. Itmay require better laboratory capacity as well as moreknowledgeable and better trained staff, especially inperipheral-level health-care facilities. Details aboutcurrent progress in strengthening laboratories andintroducing new rapid diagnostics are provided inChapter 6.● increasing access to health care (in financial and/or geographical terms), for people with TB who do notseek care, and improved awareness of how to recognizethe signs and symptoms of TB.3.4 Treatment outcomes3.4.1 New cases of smear-positive pulmonary TBData on treatment outcomes for sputum smear-positivecases of pulmonary TB are shown in Table 3.5 (definitionsof the categories used to report treatment outcomes areprovided in Box 3.5). <strong>Global</strong>ly, the rate of treatment successfor the 2.7 million new cases of sputum smear-positivepulmonary TB who were treated in the 2010 cohortwas 87%. This was the fourth successive year that thetarget of 85% (first set by the World Health Assembly in1991) was met or exceeded globally. It is also impressivethat as the size of the global treatment cohort grew from1.0 million in 1995 to 2.7 million in 2010, the treatmentsuccess rate progressively improved.Among WHO’s six regions, three met or exceededthe 85% target: the Eastern Mediterranean Region, theSouth-East Asia Region and the Western Pacific Region.The treatment success rate was 82% in the African Region(where there has been steady improvement since 1999),77% in the Region of the Americas (where the rate hasbeen relatively stable since 2002) and 67% in the EuropeanRegion (where major efforts to increase treatmentsuccess rates are needed).Of the 22 HBCs, 15 reached or exceeded the 85% targetin 2010. The seven HBCs that reported lower rates oftreatment success were Brazil (74%), Ethiopia (83%),Nigeria (84%), the Russian Federation (53%), SouthAfrica (79%), Uganda (71%) and Zimbabwe (81%); allexcept Ethiopia and the Russian Federation made prog-36 GLOBAL TUBERCULOSIS REPORT 2012
TABLE 3.4 Estimates of the case detection rate for new and relapse cases (%), 1995–2011 a1995 2000 2005 2010 2011BEST b LOW HIGH BEST LOW HIGH BEST LOW HIGH BEST LOW HIGH BEST LOW HIGHAfghanistan — — — 16 14 20 42 35 51 47 40 57 46 38 55Bangladesh 21 18 26 26 22 32 39 32 48 46 39 56 45 37 54Brazil 79 66 97 74 62 91 84 71 100 88 75 110 91 77 110Cambodia 23 18 29 26 21 33 52 44 63 65 57 76 64 55 74China 33 28 40 33 28 39 74 65 85 87 77 99 89 79 100DR Congo 30 25 36 38 32 45 52 45 61 53 46 61 50 43 58Ethiopia 11 7.2 18 33 22 55 49 32 82 69 52 97 72 55 96India 58 51 67 49 44 54 49 44 54 59 54 65 59 54 65Indonesia 8.7 7.0 11 19 16 24 56 46 70 66 56 80 70 59 85Kenya 61 56 66 72 67 77 80 76 85 82 79 86 81 78 85Mozambique 23 11 73 23 13 51 31 20 54 34 25 49 34 25 49Myanmar 11 8.6 14 17 14 21 57 49 68 71 62 83 74 64 87Nigeria 8.8 2.7 160 12 3.9 170 26 9.4 190 40 24 83 45 26 96Pakistan 4.5 3.7 5.5 3.3 2.8 4.0 39 32 47 65 55 79 64 54 78Philippines 48 40 59 47 39 58 53 44 65 65 54 79 75 63 91Russian Federation 60 51 70 75 65 89 66 56 78 79 67 93 81 70 96South Africa 56 47 69 59 49 72 61 51 75 72 61 87 69 58 83Thailand 59 49 71 32 27 38 56 47 68 75 63 91 76 64 93Uganda 22 14 41 29 20 48 47 36 66 61 51 76 69 57 86UR Tanzania 59 51 69 68 60 77 74 69 80 77 72 82 76 71 81Viet Nam 37 29 49 56 44 73 56 44 74 54 43 70 56 44 73Zimbabwe 55 40 79 56 45 71 50 41 63 56 44 72 50 40 65High-burden countries 39 36 42 39 36 42 54 51 58 65 62 69 66 63 69AFR 31 26 38 39 33 47 52 44 61 61 56 66 61 56 66AMR 68 63 73 70 65 75 75 70 80 80 75 86 84 79 89EMR 23 21 26 25 22 28 47 42 54 63 56 71 62 55 70EUR 52 49 54 58 55 62 65 61 70 76 71 81 73 69 78SEAR 45 41 49 41 38 44 50 46 54 61 57 66 62 58 66WPR 37 33 43 39 35 43 69 63 76 79 72 86 81 75 89<strong>Global</strong> 40 38 43 41 39 44 56 53 59 66 63 68 66 64 69— indicates values that cannot be calculated.aEstimates for all years are recalculated as new information becomes available and techniques are refi ned, so they may differ from those published previously.bBest, low and high indicate best estimates followed by lower and upper bounds. The lower and upper bounds are defi ned as the 2.5th and 97.5th centiles of outcomedistributions produced in simulations.ress compared with 2010. In Brazil and Uganda, low ratesreflect a relatively high proportion of patients for whomthe outcome of treatment was not evaluated (10% and13%, respectively) and high default rates (11% in bothcountries). In the Russian Federation, treatment failurerates are high, possibly linked to MDR-TB.3.4.2 All new casesData on treatment outcomes for all new cases of TB areshown in Table 3.6. <strong>Global</strong>ly, the rate of treatment successwas 85% in 2010. Among WHO’s six regions, the highestrates were in the Eastern Mediterranean (88%), South-East Asia (89%) and Western Pacific (92%) regions. Thetreatment success rate was 73% in the African Region,74% in the Region of the Americas and 74% in theEuropean Region. The data for the African Region wereaffected by missing data for South Africa. Once these areavailable and reported, the treatment success rate will behigher.Of the 22 HBCs, 14 reached or exceeded a treatmentsuccess rate of 85% among all new cases in 2010. Theeight countries that reported lower rates of treatment successwere Brazil (72%), Ethiopia (77%), Nigeria (81%),the Russian Federation (66%), South Africa (53%), 1Thailand (83%), Uganda (68%) and Zimbabwe (76%).1The NTP in South Africa noted that data reported to WHOwere incomplete; the figure of 53% is thus an underestimate.GLOBAL TUBERCULOSIS REPORT 2012 37
FIGURE 3.3Case notification and estimated TB incidence rates, 22 high-burden countries, 1990–2011. Trends in casenotifi cation rates (new and relapse cases, all forms) (black) and estimated TB incidence rates (green). Shaded areasrepresent uncertainty bands.Afghanistan Bangladesh BrazilCambodiaChina3002001003002001001005080060040020020015010050Rate per 100 000 population per year040030020010001200100080060040020001501005003002502001501005001990 1995 2000 2005 2011 1990 1995 2000 2005 20110000DR Congo Ethiopia India8002506002004001501002005000Mozambique Myanmar NigeriaPakistanPhilippines6005006006003004004004003002002002001002001000000Russian Federation South Africa ThailandUgandaUR Tanzania250120030010005000Viet NamZimbabwe10008006004002000IndonesiaKenya3002504002003001502001005010000200100025015080020060015010040010050200500001990 1995 2000 2005 2011 1990 1995 2000 2005 2011 1990 1995 2000 2005 2011BOX 3.5Definitions of treatment outcomes for drug-susceptible TBCured A patient who was initially sputum smear-positive and who was sputum smear-negative in the last month of treatment and on atleast one previous occasion.Completed treatment A patient who completed treatment but did not meet the criteria for cure or failure. This defi nition applies tosputum smear-positive and sputum smear-negative patients with pulmonary TB and to patients with extrapulmonary disease.Died A patient who died from any cause during treatment.Failed A patient who was initially sputum smear-positive and who remained sputum smear-positive at month 5 or later during treatment.Defaulted A patient whose treatment was interrupted for 2 consecutive months or more.Not evaluated A patient whose treatment outcome is not known.Successfully treated A patient who was cured or who completed treatment.Cohort A group of patients in whom TB has been diagnosed, and who were registered for treatment during a specifi ed time period (e.g.the cohort of new sputum smear-positive cases registered in the calendar year 2010). This group forms the denominator for calculatingtreatment outcomes. The sum of the above treatment outcomes, plus any cases for whom no outcome is recorded (including those “stillon treatment” in the European Region) and “transferred out” cases should equal the number of cases registered. Some countries monitoroutcomes among cohorts defi ned by sputum smear and/or culture, and defi ne cure and failure according to the best laboratory evidenceavailable for each patient.38 GLOBAL TUBERCULOSIS REPORT 2012
TABLE 3.5 Treatment success for new smear-positive cases (%) and cohort size (thousands), 1995–2010a. Treatment success (%)1995 1996 1997 1998 1999 2000 2001 2002 2003 2004 2005 2006 2007 2008 2009 2010Afghanistan — — 45 33 86 85 84 87 86 89 90 84 87 88 86 90Bangladesh 71 63 73 77 79 81 83 84 85 90 91 92 92 91 92 92Brazil 17 20 27 40 78 71 55 80 77 76 76 73 72 71 72 74Cambodia 91 94 91 95 93 91 92 92 93 91 93 93 94 95 95 94China 93 94 95 95 95 93 95 92 93 94 94 94 94 94 95 96DR Congo 74 48 64 70 69 78 77 78 83 85 85 86 87 87 88 90Ethiopia 61 71 72 74 74 80 76 76 70 79 78 84 84 84 84 83India 25 21 18 27 21 34 54 60 76 82 86 86 87 87 88 88Indonesia 91 81 54 58 50 87 86 86 87 90 91 91 91 91 91 90Kenya 75 77 65 77 79 80 80 79 80 80 82 85 85 85 86 87Mozambique 39 55 65 — 71 75 78 78 76 77 79 83 79 84 85 85Myanmar 67 79 82 82 81 82 81 81 81 84 84 84 85 85 85 86Nigeria 49 32 73 73 75 79 79 79 78 73 75 76 82 78 83 84Pakistan 70 — 67 23 70 74 77 78 79 82 83 88 91 90 91 91Philippines 60 35 78 71 87 88 88 88 88 87 89 88 89 88 89 91Russian Federation 65 57 67 68 65 68 67 67 61 60 58 58 58 57 55 53South Africa 58 61 68 72 57 63 61 68 67 69 71 74 74 76 73 79Thailand 64 78 58 68 77 69 75 74 73 74 75 77 83 82 86 85Uganda 44 33 40 62 61 63 56 60 68 70 73 70 75 70 67 71UR Tanzania 73 76 77 76 78 78 81 80 81 81 82 85 88 88 88 90Viet Nam 89 89 85 92 92 92 93 92 92 93 92 93 92 92 92 92Zimbabwe 53 32 69 70 73 69 71 67 66 54 68 60 78 74 78 81High-burden countries 53 50 56 62 60 67 72 75 81 84 86 87 87 87 88 88AFR 60 56 64 70 68 71 70 73 73 74 76 75 80 80 80 82AMR 50 51 58 67 79 76 69 81 80 79 79 76 79 77 76 77EMR 79 66 73 57 79 81 82 84 82 83 83 86 88 88 88 88EUR 67 58 72 63 75 75 74 74 75 70 72 70 71 70 69 67SEAR 33 31 29 40 34 50 63 68 79 84 87 87 88 88 89 88WPR 80 72 91 92 91 90 91 90 91 91 92 92 92 92 93 93<strong>Global</strong> 57 54 60 64 64 69 73 76 80 83 85 84 86 86 86 87b. Cohort size (thousands)1995 1996 1997 1998 1999 2000 2001 2002 2003 2004 2005 2006 2007 2008 2009 2010Afghanistan 2.0 2.9 2.0 3.1 6.3 7.8 6.8 10 10 12 13 13 12 13Bangladesh 11 30 34 38 38 38 41 47 54 63 85 102 104 106 109 106Brazil 46 45 43 30 27 34 41 29 38 43 42 48 38 41 41 42Cambodia 4.4 9.1 12 13 16 15 14 17 19 19 21 19 19 20 18 17China 131 175 189 210 208 214 190 194 267 385 473 470 466 464 449 430DR Congo 16 25 26 33 35 36 41 45 54 62 65 63 66 66 72 73Ethiopia 5.1 11 12 15 21 30 32 37 40 41 39 37 38 41 45 47India 265 291 293 284 345 349 384 396 420 489 507 553 592 616 625 630Indonesia 3.0 12 21 40 46 52 54 76 93 129 159 175 161 166 169 183Kenya 6.5 13 19 22 27 28 31 31 34 41 40 39 38 37 37 36Mozambique 11 13 11 12 13 14 15 16 17 18 18 18 19 20 20Myanmar 7.9 9.7 9.2 10 12 17 21 24 27 31 37 40 43 41 42 42Nigeria 9.5 24 11 13 15 16 17 21 28 34 35 40 44 46 45 45Pakistan 0.8 2.8 29 3.0 4.1 6.3 15 20 32 48 66 89 100 102 104Philippines 90 126 27 21 37 50 55 59 68 78 81 86 87 85 89 89Russian Federation 0.05 43 0.7 0.7 1.5 3.6 4.1 5.2 6.3 26 26 31 32 32 32 30South Africa 28 45 55 37 81 86 101 99 114 127 135 140 143 144 139 134Thailand 20 0.1 3.7 8.0 14 23 20 27 28 28 30 29 30 33 28 30Uganda 15 15 18 13 14 14 17 19 20 21 21 20 21 23 23 23UR Tanzania 20 21 22 24 24 24 24 24 25 26 25 25 25 24 25 24Viet Nam 38 48 54 55 53 53 54 57 56 58 55 56 54 53 51 52Zimbabwe 9.7 12 12 13 13 14 17 16 14 15 13 16 11 10 10 12High-burden countries 739 967 879 912 1 044 1 119 1 186 1 260 1 450 1 776 1 965 2 087 2 132 2 181 2 184 2 185AFR 178 233 268 235 323 365 409 452 491 552 564 566 577 591 606 635AMR 129 134 125 111 110 111 102 105 110 121 119 132 116 109 123 123EMR 46 51 60 89 66 64 52 76 81 98 114 132 156 167 167 170EUR 34 94 24 48 22 41 50 54 60 75 81 98 108 114 105 84SEAR 318 360 376 399 473 512 550 604 661 780 856 938 974 1 011 1 022 1 045WPR 296 372 294 313 353 360 346 357 439 575 663 663 661 657 641 622<strong>Global</strong> 1 001 1 245 1 147 1 195 1 347 1 453 1 510 1 649 1 842 2 200 2 396 2 529 2 591 2 649 2 665 2 680Blank cells indicate data not reported.— indicates values that cannot be calculated.GLOBAL TUBERCULOSIS REPORT 2012 39
TABLE 3.6 Treatment success for all new cases (%) and cohort size (thousands), 1995–2010a. Treatment success (%)1995 1996 1997 1998 1999 2000 2001 2002 2003 2004 2005 2006 2007 2008 2009 2010Afghanistan — — 45 33 86 85 84 87 86 89 90 84 87 88 86 86Bangladesh 71 63 73 77 79 81 83 84 85 90 90 91 90 91 91 91Brazil 17 20 27 40 78 71 55 80 77 72 72 69 72 69 70 72Cambodia 91 94 91 95 93 91 92 92 93 91 91 92 93 94 94 89China 93 94 95 95 95 93 95 92 93 92 92 92 93 93 94 95DR Congo 74 48 64 70 69 78 77 78 83 85 85 60 86 86 88 89Ethiopia 61 71 72 74 74 80 76 76 70 79 78 84 84 80 81 77India 25 21 18 27 21 34 54 60 76 81 87 87 88 88 89 89Indonesia 91 81 54 58 50 87 86 86 87 87 89 90 90 90 89 89Kenya 75 77 65 77 79 80 80 79 80 77 81 83 83 84 84 86Mozambique 39 55 65 — 71 75 78 78 76 77 79 83 79 84 85 85Myanmar 67 79 82 82 81 82 81 81 81 82 83 83 84 84 84 88Nigeria 49 32 73 73 75 79 79 79 78 73 75 76 82 78 84 81Pakistan 70 — 67 23 70 74 77 78 79 80 82 86 90 89 91 90Philippines 60 35 78 71 87 88 88 88 88 78 89 88 88 84 85 90Russian Federation 65 57 67 68 65 68 67 67 61 65 67 69 69 69 68 66South Africa 58 61 68 72 57 63 61 68 67 65 69 70 71 73 68 53Thailand 64 78 58 68 77 69 75 74 73 71 71 75 81 80 84 83Uganda 44 33 40 62 61 63 56 60 68 70 73 68 72 67 64 68UR Tanzania 73 76 77 76 78 78 81 80 81 82 83 85 88 88 88 89Viet Nam 89 89 85 92 92 92 93 92 92 92 92 92 91 92 92 92Zimbabwe 53 32 69 70 73 69 71 67 66 48 66 67 78 70 75 76High-burden countries 53 50 56 62 60 67 72 75 81 82 85 85 87 87 86 86AFR 60 56 64 70 68 71 70 73 73 70 74 72 77 77 76 73AMR 50 51 58 67 79 76 69 81 80 76 75 73 78 73 73 74EMR 79 66 73 57 79 81 82 84 82 82 82 86 87 87 87 88EUR 67 58 72 63 75 75 74 74 75 75 77 75 76 76 75 74SEAR 33 31 29 40 34 50 63 68 79 83 87 87 88 88 89 89WPR 80 72 91 92 91 90 91 90 91 88 90 90 91 91 91 92<strong>Global</strong> 57 54 60 64 64 69 73 76 80 81 84 84 85 85 85 85b. Cohort size (thousands)1995 1996 1997 1998 1999 2000 2001 2002 2003 2004 2005 2006 2007 2008 2009 2010Afghanistan 2.0 2.9 2.0 3.1 6.3 7.8 6.8 10 10 12 13 13 12 26Bangladesh 11 30 34 38 38 38 41 47 54 63 119 141 144 106 156 150Brazil 46 45 43 30 27 34 41 29 38 81 78 81 47 73 75 78Cambodia 4.4 9.1 12 13 16 15 14 17 19 30 34 34 35 38 39 40China 131 175 189 210 208 214 190 194 267 644 788 847 889 932 923 877DR Congo 16 25 26 33 35 36 41 45 54 62 65 92 89 93 106 109Ethiopia 5.1 11 12 15 21 30 32 37 40 41 39 37 38 139 139 152India 265 291 293 284 345 349 384 396 420 1 066 1 071 1 137 1 199 1 226 1 244 1 229Indonesia 3.0 12 21 40 46 52 54 76 93 206 244 266 263 293 289 296Kenya 6.5 13 19 22 27 28 31 31 34 97 98 101 99 99 99 90Mozambique 11 13 11 12 13 14 15 16 17 18 18 18 19 20 20Myanmar 7.9 9.7 9.2 10 12 17 21 24 27 66 73 84 85 90 91 127Nigeria 9.5 24 11 13 15 16 17 21 28 34 35 40 44 46 86 78Pakistan 0.8 2.8 29 3.0 4.1 6.3 15 20 84 117 149 191 206 212 256Philippines 90 126 27 21 37 50 55 59 68 126 81 123 136 140 141 162Russian Federation 0.05 43 0.7 0.7 1.5 3.6 4.1 5.2 6.3 39 74 97 99 103 101 94South Africa 28 45 55 37 81 86 101 99 114 243 259 271 247 236 367 338Thailand 20 0.1 3.7 8.0 14 23 20 27 28 47 49 47 47 54 43 48Uganda 15 15 18 13 14 14 17 19 20 21 21 31 37 39 38 40UR Tanzania 20 21 22 24 24 24 24 24 25 61 59 58 25 59 60 59Viet Nam 38 48 54 55 53 53 54 57 56 92 55 91 91 91 88 88Zimbabwe 9.7 12 12 13 13 14 17 16 14 54 43 43 39 40 45 46High-burden countries 739 967 879 912 1 044 1 119 1 186 1 260 1 450 3 183 3 430 3 799 3 872 4 134 4 374 4 403AFR 178 233 268 235 323 365 409 452 491 846 886 940 930 1 087 1 297 1 251AMR 129 134 125 111 110 111 102 105 110 191 187 197 157 168 191 196EMR 46 51 60 89 66 64 52 76 81 178 226 259 307 320 331 391EUR 34 94 24 48 22 42 50 55 60 171 221 274 276 279 248 220SEAR 318 360 376 399 473 512 550 604 661 1 530 1 639 1 758 1 835 1 880 1 940 1 980WPR 296 372 294 313 353 360 346 357 439 963 1 030 1 163 1 216 1 261 1 259 1 240<strong>Global</strong> 1 001 1 245 1 147 1 195 1 347 1 453 1 511 1 649 1 843 3 879 4 188 4 592 4 720 4 995 5 267 5 278Blank cells indicate data not reported.— indicates values that cannot be calculated.40 GLOBAL TUBERCULOSIS REPORT 2012
CHAPTER 4Drug-resistant TBKEY FACTS AND MESSAGES By the end of 2012, representative surveillance data onlevels of MDR-TB will be available from all 27 high MDR-TB and 22 high TB burden countries, and from 135 of194 Member States. <strong>Global</strong>ly, 3.7% (2.1–5.2%) of newcases and 20% (13–26%) of previously treated casesare estimated to have MDR-TB. There were an estimated 310 000 (range, 220 000–400 000) MDR-TB cases among notifi ed TB patientswith pulmonary TB in 2011. Almost 60% of these caseswere in India, China and the Russian Federation. Extensively drug-resistant TB, or XDR-TB, has beenidentifi ed in 84 countries; the average proportion ofMDR-TB cases with XDR-TB is 9.0% (6.7–11.2%). Levels of MDR-TB remain worryingly high in some partsof the world, notably countries in eastern Europe andcentral Asia. In several of these countries, 9–32% of newcases have MDR-TB and more than 50% of previouslytreated cases have MDR-TB. There has been progress in the detection and treatmentof MDR-TB in the last two years. <strong>Global</strong>ly, almost 60 000cases of MDR-TB were notifi ed to WHO in 2011, mostlyby European countries and South Africa. The number ofcases reported by the 27 high MDR-TB burden countriesalmost doubled between 2009 and 2011. Despite progress, the number of MDR-TB cases notifi edin 2011 represented only 19% of the estimated 310 000cases of MDR-TB among reported TB patients withpulmonary TB, and less than 10% in the two countrieswith the largest number of cases, China and India.Achieving universal access to treatment requires a boldand concerted drive on many fronts of TB care, andincreased fi nancing. Major efforts are needed to improve treatment successrates among patients with MDR-TB. The <strong>Global</strong> Plantarget of ≥75% by 2015 was reached by only 30 of 107countries that reported treatment outcome data forpatients with MDR-TB.Drug-resistant TB (DR-TB) threatens global TB controland is a major public health concern in several countries.The first part of this chapter summarizes the latest statusof progress in global surveillance of anti-TB drug resistance,using the most recent data on multidrug-resistantTB (MDR-TB), extensively drug-resistant TB (XDR-TB)and resistance to fluoroquinolones gathered from specialsurveys and continuous surveillance (Section 4.1). Thesecond part of the chapter (Section 4.2) assesses nationalprogress in diagnosing and treating MDR-TB, using dataon diagnostic testing for DR-TB, enrolment on treatmentwith second-line drugs for those found to have MDR-TBand treatment outcomes.4.1 Surveillance of drug-resistant TB4.1.1 Progress in the coverage of drug resistancesurveillanceSince the launch of the <strong>Global</strong> Project on Anti-tuberculosisDrug Resistance Surveillance in 1994, data on drugresistance have been systematically collected and analysedfrom 135 countries worldwide (70% of WHO’s 194Member States). This includes 63 countries that have continuoussurveillance systems based on routine diagnosticdrug susceptibility testing (DST) of all TB patients and72 countries that rely on special surveys of representativesamples of patients.During the past 4 years, most of the 27 high MDR-TBand 22 high TB burden countries (a total of 36 countries)have expanded coverage of surveillance of drug resistanceto obtain more accurate estimates of the burden of MDR-TB (Figure 4.1). In 2008, 16 of these 36 countries had nonationally representative drug resistance surveillancedata (including 8 countries with data only from subnationalareas) and only 3 countries (the Baltic States) hada nationwide routine surveillance system for monitoringdrug resistance. By the end of 2012 when the survey concludesin Pakistan, baseline representative informationabout the burden of drug resistance will be available fromall 27 high MDR-TB and 22 high TB burden countries.Countries such as Afghanistan (Central region), Bangladesh,Belarus, Bulgaria, Nigeria, Uganda and thecentral Asian republics of Kyrgyzstan, Tajikistan andUzbekistan, which previously had no or very limitedinformation on drug resistance, concluded surveys in2010–2011. Data for Afghanistan could not be disaggregatedby history of treatment (% of MDR among all formsGLOBAL TUBERCULOSIS REPORT 2012 41
FIGURE 4.1Progress in implementing surveys foranti-TB drug-resistance in the 27 highMDR-TB and 22 high-TB burden countries2008 2012Afghanistan No data Completed in 2010Bangladesh No data Completed in 2011Belarus No data Completed in 2011Bulgaria No data Completed in 2010Kyrgyzstan No data Completed in 2011Nigeria No data Completed in 2011Pakistan No data OngoingTajikistan No data Completed in 2011DR Congo 1999 No more recent dataIndia 9 States 1 additional StateIndonesia 2 Provinces1 additional Provincein 2010Russian Federation 4 Oblasts 17 additional OblastsAzerbaijan 2007 Planned for 2013Uganda 1997 Completed in 2011Ukraine 2006 Planned for 2013Uzbekistan 2005 Completed in 2011Brazil 1996 OngoingCambodia 2007 No more recent dataChina 2007 Planned for 2013Ethiopia 2005 OngoingKenya 1995 OngoingMozambique 2007 No more recent dataMyanmar 2007 Planned for 2013Philippines 2004 OngoingSouth Africa 2002 OngoingThailand 2006 No more recent dataUR Tanzania 2007 No more recent dataViet Nam 2006 OngoingZimbabwe 1995 Planned for 2013Armenia 2007Moving towardsroutine surveillanceGeorgia 2007 Routine surveillanceKazakhstan 2001 Routine surveillanceRepublic of Moldova 2006 Routine surveillanceEstonia Routine surveillance Routine surveillanceLatvia Routine surveillance Routine surveillanceLithuania Routine surveillance Routine surveillanceSurvey/surveillance at subnational levelNationwide surveyNationwide routine surveillanceof TB: 6.3%; range 3.7–10.0). Six countries (Azerbaijan,the Democratic Republic of the Congo, India, Indonesia,the Russian Federation and Ukraine) still rely on drugresistance surveillance data gathered from limited subnationalareas. In the Democratic Republic of the Congo,logistic issues have prevented the implementation of anationwide survey. In Indonesia, after two surveys at provinciallevel, the national TB control programme (NTP)has opted to work towards establishing a nationwide sentinelsystem to monitor drug resistance. Concrete plansexist in Azerbaijan and Ukraine to start nationwide surveysin 2012. Drug resistance surveys are ongoing inBrazil, Ethiopia, Kenya, Pakistan, the Philippines, SouthAfrica and Viet Nam.By the end of 2011, India and the Russian Federation,which combined with China contribute to almost 60%of the estimated global burden of MDR-TB, had producedreliable data only at subnational level. These countriesshould consider conducting nationwide drug resistancesurveys in the short term to better understand the burdenof MDR-TB and properly plan diagnostic and treatmentservices.Routine surveillance represents the best approach formeasuring drug resistance and monitoring trends. Amongthe 27 high MDR-TB and 22 high TB burden countries,Georgia, Kazakhstan, the Republic of Moldova and theBaltic States now have proper routine surveillance systemsto monitor drug resistance.A group of countries – Benin, Bolivia, Chile, Colombia,El Salvador, Lebanon, Sri Lanka, Mongolia, Nicaraguaand Rwanda – that relied on special surveys to monitordrug resistance have established a routine surveillancesystem for all previously treated cases. This is the firststep towards routine drug susceptibility testing for all TBpatients.Central and Francophone Africa remain the regionswhere drug resistance surveillance data are most lacking,largely as a result of the scarce laboratory infrastructure.4.1.2 Percentage of new and previously treated TBcases that have MDR-TB<strong>Global</strong>ly, 3.7% (2.1–5.2%) of new cases and 20% (13–26%) of previously treated cases are estimated to haveMDR-TB (Chapter 2).The proportions of new TB cases with MDR-TB at countrylevel are shown in Figure 4.2. Proportions ranged from0% to 32.3% and were highest in Belarus (32.3%), Estonia(22.9%), Kazakhstan (30.3%), Kyrgyzstan (26.4%;preliminary results), the Republic of Moldova (19.4%)and Uzbekistan (23.2%). Although the average proportionof patients with MDR-TB in the Russian Federationis lower than in these countries, the proportion is high inseveral oblasts (with Arkhangelsk Oblast at the highestlevel: 35.1% in 2010).The proportion of previously treated TB cases with42 GLOBAL TUBERCULOSIS REPORT 2012
FIGURE 4.2 Percentage of new TB cases with MDR-TB a Percentageof cases0–2.93–5.96–11.912–17.9≥ 18No dataSubnational data onlyNot applicableaFigures are based on the most recent year for which data have been reported, which varies among countries.FIGURE 4.3 Percentage of previously treated TB cases with MDR-TB a PercentageaFigures are based on the most recent year for which data have been reported, which varies among countries.of cases0–5.96–11.912–29.930–49.9≥ 50No dataSubnational data onlyNot applicableGLOBAL TUBERCULOSIS REPORT 2012 43
FIGURE 4.4 Countries that had notified at least one case of XDR-TB by the end of 2011At least one case reportedNo cases reportedNot applicableMDR-TB at country level ranged from 0% to 65.1% (Figure4.3). Countries or subnational areas with the highestreported proportions were Azerbaijan (Baku city, 55.8%in 2007), Belarus (75.6% in 2011), Estonia (57.7% in2011), Kazakhstan (51.3% in 2011), Kyrgyzstan (51.6%in 2011; preliminary results), the Republic of Moldova(63.5% in 2011), Tajikistan (53.6% in 2011; preliminaryresults) and Uzbekistan (62.0% in 2011). In the RussianFederation, even if the average proportion of cases withMDR-TB does not exceed 50%, the proportion is above50% in several oblasts (with Arkhangelsk Oblast at thehighest level: 58.8% in 2008).These data confirm that eastern European and centralAsian countries continue to represent hot spots forMDR-TB, with nearly one third of new and two thirds ofpreviously treated TB cases affected by MDR-TB in somesettings.4.1.3 XDR-TB and resistance to second-lineanti-TB drugsExtensively drug-resistant TB (XDR-TB) has been identifiedin 84 countries globally (Figure 4.4). A total of 65countries and 3 territories reported representative datafrom continuous surveillance or special surveys on theproportion of XDR-TB among MDR-TB cases. Combiningtheir data, the proportion of MDR-TB cases with XDR-TBwas 9.0% (95% confidence interval, 6.7%–11.2%). Since2007, only 13 out of 68 (19.1%) countries and territorieshave reported more than 10 XDR-TB cases in a singleyear. Among them, the proportion of MDR-TB cases withXDR-TB was highest in Azerbaijan (Baku city, 12.7%),Belarus (11.9%), Estonia (18.7%), Latvia (12.6%), Lithuania(16.5%) and Tajikistan (Dushanbe city and Rudakidistrict, 21.0%).The levels of resistance to fluoroquinolones in patientswith MDR-TB are described in Box 4.1.4.2 Management of drug-resistant TB4.2.1 Coverage of drug susceptibility testing (DST)The diagnosis of DR-TB requires that TB patients are testedfor susceptibility to drugs. The <strong>Global</strong> Plan to Stop TB2011–2015 (Chapter 1) includes targets that by 2015 allnew cases of TB considered at high risk of MDR-TB (estimatedat about 20% of all new bacteriologically-positivecases globally) and all previously treated cases shouldundergo DST. Likewise, all patients with MDR-TB needto be tested for XDR-TB.With the exception of the European Region, DST forfirst-line drugs was done for a small proportion of casesin 2011 (Table 4.1); just over 50% of countries reporteddata. Coverage of DST in new cases has remained stablein recent years and is below that envisaged by the <strong>Global</strong>Plan for 2011 (Figure 4.5). <strong>Global</strong>ly, less than 4% ofnew bacteriologically-positive cases and 6% of previouslytreated cases were tested for MDR-TB in 2011, with particularlylow levels of testing in the African and South-East Asia regions. In the European Region, 56% of newcases and 27% of previously treated cases were tested forMDR-TB. Among the 27 high MDR-TB burden countries– which account for 86% of estimated MDR-TB cases in44 GLOBAL TUBERCULOSIS REPORT 2012
BOX 4.1Frequencies of resistance to fluoroquinolones among MDR-TB casesFluoroquinolones represent the most powerful class of bactericidal second-line drugs for the treatment of MDR-TB. Patients with MDR-TBand additional resistance to fl uoroquinolones have a more serious form of disease compared with those with MDR-TB alone. Their diseaseis more diffi cult to treat, and risks evolving into XDR-TB and acquiring resistance to any of the second-line injectable agents.Monitoring resistance to fl uoroquinolones in MDR-TB patients is critical to predict the effi cacy of second-line treatment and possiblymodify the composition of the treatment regimen. Since 2007, WHO has collected surveillance data on cases of MDR-TB with additionalresistance to fl uoroquinolones. In most cases, only the compound most commonly used in the country is tested for susceptibility, usuallyofl oxacin, moxifl oxacin or levofl oxacin.A total of 62 countries and 3 territories reported representative data on the proportion of MDR-TB cases that had additional resistance tofl uoroquinolones. Combining their data, the proportion of MDR-TB cases with additional resistance to fl uoroquinolones was 14.5% (95%confi dence interval 11.6–17.4%), inclusive of cases with XDR-TB.FIGURE 4.5DST coverage among new cases and enrolment on MDR-TB treatment, compared with the targets in the<strong>Global</strong> Plan to Stop TB, 2011–2015. Lines indicate the planned targets, blue squares show the situation in 2009–2011and green circles the projected enrolments 2012–2015.25a. DST coverage among new bacteriologically-positive cases300 000b. Enrolment on MDR-TB treatment20250 000Percentage of cases1510Number of patients200 000150 000100 000550 00002009 2010 2011 2012 2013 2014 201502009 2010 2011 2012 2013 2014 20154.2.2 Notification of MDR-TB cases and enrolment ontreatmentThe suboptimal levels of coverage of DST in many countriesare one of the main reasons why the number ofpeople who are diagnosed with MDR-TB remains low.<strong>Global</strong>ly, just under 60 000 cases of MDR-TB were notifiedto WHO in 2011, mostly by European countries andSouth Africa (Table 4.2). This represented 19% of the310 000 (range, 220 000–400 000) cases of MDR-TB estimatedto exist among patients with pulmonary TB whowere notified in 2011. An additional 4500 rifampicintheworld – the proportion of cases tested was higher than20% among new cases in 10 of the 12 European countriesreporting data, and exceeded 50% among previouslytreated cases in six European countries. While data onDST were not available for new and previously treatedcases separately, overall 13% of TB cases were tested fordrug resistance in South Africa. Among non-Europeanhigh MDR-TB burden countries, testing for MDR-TBamong new cases was highest in China (2.6%); amongpreviously treated cases testing coverage was higherand reached 17% in the Philippines. India, the countryestimated to have the highest number of MDR-TB casesamong notified TB patients (Figure 4.6), reported no data.Among TB patients who were notified and confirmedto have MDR-TB in 2011, 23% were reported to havesecond-line DST for both fluoroquinolones and secondlineinjectable drugs, and coverage exceeded 90% inArmenia, Estonia, Georgia, Lithuania and Pakistan.South Africa accounted for most of the cases with secondlineDST data reported globally, as well as the high levelobserved in the African Region, which drops from 67% to9% when excluding this country. Otherwise, second-lineDST reports were available for 51% of cases in the EasternMediterranean Region, 40% in the Region of the Americasand 8–10% in the other regions.Progressive acquisition of drug resistance is a considerablerisk if TB patients are inadequately tested and treated(see Box 4.2). Increasing the coverage of diagnostic DST isurgently needed to improve the diagnosis of MDR-TB andXDR-TB, and requires strengthening laboratory capacityand the introduction of new rapid diagnostics (for furtherdetails, see Chapter 6).GLOBAL TUBERCULOSIS REPORT 2012 45
TABLE 4.1 DST coverage among TB and MDR–TB cases, 27 high MDR-TB burden countries and WHO regions, 2011NEW BACTERIOLOGICALLY POSITIVE CASES PREVIOUSLY TREATED CASES CONFIRMED MDR–TB CASESNUMBER WITHDST a RESULT% OF CASES WITHDST RESULTNUMBER WITHDST a RESULT% OF CASES WITHDST RESULTNUMBER WITHDST b RESULT% OF CASES WITHDST RESULTArmenia 439 96 90 23 79 100Azerbaijan — — 0 0Bangladesh 71 0.1 761 10 0 0Belarus — — 0 —Bulgaria 588 62 145 41 46 84China 9 940 2.6 — 46 2.9DR Congo 22
FIGURE 4.6 Number of MDR-TB cases estimated to occur among notified pulmonary TB cases, 2011MDR-TB cases0–299300–29993000–29 99930 000–59 999≥ 60 000No dataNot applicableBOX 4.2“Totally drug-resistant TB” and developments in India in 2012In December 2011, clinicians in Mumbai, India reported TB patients with what was termed “total drug resistance”. 1 As a result of theintense public interest generated by this episode, in March 2012 WHO convened 40 experts to discuss its implications, whether currentevidence makes it possible to defi ne patterns of drug resistance beyond extensively drug resistance TB (XDR-TB) and if better guidanceon appropriate treatment options for these patients was possible. While the group acknowledged that patients such as those described inMumbai pose a formidable challenge to clinicians and public health authorities, no reliable defi nition beyond XDR-TB could be proposed.Without having a better evidence base, no changes to the current guidelines on how to design treatment regimens for patients with broadpatterns of resistance could be recommended. Improvements in the accuracy of drug susceptibility testing to certain drugs and the releaseof innovative new drugs will, however, change this position in future.Since December 2011, several important measures have been taken by the Indian government. In Mumbai, laboratory and hospitalfacilities were improved, contact-tracing stepped up and efforts made to train staff on drug-resistant TB and infection control. Medicalstaff and funding were increased substantially. Access to second-line drugs was provided to eligible patients. National regulationsgoverning private sales of anti-TB medication were strengthened. By the end of 2012, all 35 states in the country are expected to provideprogrammatic management of drug-resistant TB. In May 2012, India made TB a notifi able disease and data collection on TB using a webbasedsystem was initiated. 21Udwadia ZF et al. Totally drug-resistant tuberculosis in India. Clinical Infectious Diseases, 2012, 54(4):579–581.2Press Information Bureau English Releases (available from: http://pib.nic.in/newsite/erelease.aspx?relid=83486).in the total number of MDR-TB cases notified between2010 and 2011 in 19 of the high MDR-TB countries and inall WHO regions except the Eastern Mediterranean andEuropean regions.The ratio of notified MDR-TB cases to numbers ofpatients starting treatment with second-line drug regimensfor MDR-TB was almost 1:1 globally, but lower inthe African and South-East Asia regions in 2011, possiblyreflecting the empiric treatment of TB patients at riskof MDR-TB without a laboratory confirmation or enrolmenton treatment of MDR-TB patients detected before2011 (Table 4.2). Enrolments in the high MDR-TB burdencountries nearly doubled between 2009 and 2011 asa result of steady annual increases in 12 of the countries,including India, the Philippines, the Russian Federation,South Africa and Ukraine, each of which reportedenrolling more than 2000 patients in 2011. Among 120countries reporting sex-disaggregated data, the medianmale:female ratio was 2. Most countries providing MDR-TB enrolment data did not report the inclusion of anyGLOBAL TUBERCULOSIS REPORT 2012 47
TABLE 4.2 Notified cases of MDR-TB and enrolments on MDR-TB treatment 2009–2011, projected enrolments 2012–2015and treatment outcome reporting for 2009 cohort, 27 high MDR-TB burden countries and WHO regionsNOTIFIED CASESCASES ENROLLED ONMDR-TB TREATMENTCASES EXPECTED TO BE ENROLLEDON MDR-TB TREATMENTMDR-TB CASESREPORTED WITHTREATMENTOUTCOME DATA,2009 COHORT2009 2010 2011 2009 2010 2011 2012 2013 2014 2015 N % aArmenia 156 177 79 134 154 88 240 200 200 134 86Azerbaijan 552 722 286 572 —Bangladesh 339 509 352 339 390 2 597 1 050 1 300 2 000 167 —Belarus 1 342 1 576 200 —Bulgaria 43 56 55 43 56 42 60 70 70 70 43 100China 474 2 792 1 601 458 1 222 1 155 7 237 3 495 260 55DR Congo 91 87 121 176 191 128 700 800 900 1 000 177 195Estonia 86 63 78 86 63 75 80 70 65 65 85 99Ethiopia 233 140 212 88 120 199 1 071 1 714 2 143 2 571 73 31Georgia 369 359 475 266 618 737 550 540 540 530 503 136India 1 660 2 967 4 237 1 136 2 967 3 384 15 000 25 000 30 000 32 000 715 43Indonesia 182 383 20 142 260 900 1 800 1 700 19 —Kazakhstan 3 644 7 387 7 408 3 209 5 705 5 261 6 280 7 000 7 000 7 579 208Kyrgyzstan 785 566 806 545 566 492 1 100 1 000 545 69Latvia 131 87 105 124 87 103 125 125 125 125 131 100Lithuania 322 310 296 322 310 296 322 100Myanmar 815 192 690 64 192 163 400 400 400 400 64 7.9Nigeria 28 21 95 0 23 38 220 400 450 550 —Pakistan 49 444 344 368 424 344 1 115 2 900 5 300 6 360 74 151Philippines 1 073 522 1 148 501 548 2 397 2 372 2 372 2 237 2 237 394 37Republic of Moldova 1 069 1 082 1 001 334 791 765 —Russian Federation 14 686 13 692 13 785 8 143 13 692 18 902 —South Africa 9 070 7 386 10 085 4 143 5 402 5 643 4 654 51Tajikistan 319 333 604 52 245 380 230 800 800 800 52 16Ukraine 3 482 5 336 4 298 3 186 3 870 4 950 3 238 93Uzbekistan 654 1 023 1 385 464 628 855 1 865 2 155 464 71Viet Nam 217 101 601 307 101 578 950 1 100 1 300 1 500 101 47High MDR-TB burden countries 40 798 47 772 51 123 24 521 38 942 48 197 35 712 52 371 55 530 57 208 19 794 49AFR 10 741 9 340 12 384 5 994 7 209 7 467 4 409 5 735 6 645 7 539 6 143 57AMR 2 884 2 661 2 969 3 153 3 249 3 087 3 435 3 684 3 404 5 551 2 340 81EMR 496 886 841 707 976 756 3 293 3 937 6 499 7 770 511 103EUR 28 157 33 863 32 348 17 169 28 336 34 769 4 023 12 262 10 073 8 863 14 158 50SEAR 2 560 3 937 6 615 2 040 3 901 4 572 20 856 30 217 35 374 36 373 1 140 45WPR 2 059 4 295 4 392 1 422 2 210 4 946 11 102 7 553 4 167 4 440 1 027 50<strong>Global</strong> 46 897 54 982 59 549 30 485 45 881 55 597 47 118 63 388 66 162 70 536 25 319 54Blank cells indicate data not reported.— indicates values that cannot be calculated.aThe percentage of MDR-TB cases originally notifi ed in 2009 with outcomes reported. Percentage may exceed 100% as a result of updated information about MDR-TBcases in 2009, absence of linkage between notifi cation systems for TB and MDR-TB, and the inclusion in the treatment cohort of cases of MDR-TB cases from a year prior to2009.48 GLOBAL TUBERCULOSIS REPORT 2012
FIGURE 4.7Notified cases of MDR-TB as a percentage of MDR-TB cases estimated to occur among notified pulmonaryTB cases, 2011 aPercentage notifiedof estimatedMDR-TB cases0–9.910–19.920–49.950–79.9≥ 80≤ 1 MDR-TB case estimatedNo dataNot applicableaMDR-TB notifi cations from 2010 are used for 18 countries with missing 2011 data.children; in the 37 that did, children represented 1–13%of total enrolments.While the absolute numbers of TB cases notified withMDR-TB and started on second-line treatment remainlow compared with the <strong>Global</strong> Plan’s targets, enrolmentsincreased by 21% globally between 2010 and 2011 (Figure4.5). Country plans envisage increased enrolmentsbetween 2012 and 2015, although numbers remain wellbelow targets, partly as a result of incomplete informationon forecasts in countries with large burdens, such asChina, the Russian Federation and South Africa. To reachthe targets set out in the <strong>Global</strong> Plan and advance towardsuniversal access to treatment, a bold and concerted drivewill be needed on many fronts of TB care, particularly inthe countries where the highest burden is located.4.2.3 Treatment outcomes for MDR-TB and XDR-TBStandardized monitoring methods and indicators haveallowed countries to report MDR-TB treatment outcomesin a comparable manner for several years. 1 In most cases,treatment of MDR-TB lasts 20 months or longer, andrequires daily administration of drugs that are more toxic1These methods and indicators are defined in Guidelines for theprogrammatic management of drug-resistant tuberculosis, Emergencyupdate 2008. Geneva, World Health Organization, 2008(WHO/HTM/TB/2008.402). It is anticipated that revised definitionsof treatment outcomes will be released in 2013 followingpiloting in several countries.and less effective than those used to treat drug-susceptibleforms of TB. In a few countries, shorter treatmentregimens are being used to treat patients with MDR-TB(Box 4.3).A total of 107 countries reported outcomes for morethan 25 000 MDR-TB cases started on treatment in 2009(Table 4.2; Figure 4.8). This is equivalent to 54% of thenumber of MDR-TB cases notified by countries in thesame year. The <strong>Global</strong> Plan envisages that by 2015, allcountries will report outcomes for all notified MDR-TBcases. In contrast, among 117 countries reporting at leastone case of MDR-TB in 2009, 60 overall – including 10high MDR-TB burden countries – reported outcomes for acohort whose size exceeded 80% of original notifications.The proportion of MDR-TB patients who successfullycompleted treatment varied from 44% (Eastern MediterraneanRegion) to 58% (South-East Asia Region). Deathswere highest in the African Region (19%) and the proportionof patients whose treatment failed was highest inthe European Region (12%). Overall, treatment successwas 48%, while 28% of cases were reported as lost tofollow-up or had no outcome information. Among a subsetof 200 XDR-TB patients in 14 countries, treatment successwas 33% overall and 26% died. The <strong>Global</strong> Plan’s targetfor 2015 of achieving at least 75% treatment success inMDR-TB patients was only reached by 30/107 countries.Moving towards the target for treatment success requiresenhancing and scaling up the currently available drugGLOBAL TUBERCULOSIS REPORT 2012 49
BOX 4.3Treatment regimens for MDR-TB lasting up to 12 monthsWHO’s guidelines on treatment of MDR-TB recommend an intensive phase of 8 months and a total duration of 20 months in mostpatients. 1 While these recommendations are conditional, they are based on >9000 cases treated in observational studies. 2 There is muchless evidence on the effectiveness and safety of regimens of substantially reduced duration and different drug composition, which havebeen termed short-regimens. One observational study from Bangladesh using shorter regimens yielded much higher treatment successthan is usually achieved with the longer regimens, and for this reason has generated much interest in the scientifi c community. 3WHO’s position is that regimens which are markedly different from those that make up the current norm should be used only within thecontext of research and under close monitoring of the clinical and bacteriological response to treatment for a period of at least 12 monthsafter treatment is completed. One of the major concerns is that patients who do well after 9–12 months of treatment with less drugs inthe continuation phase than in the longer regimen may have a higher risk of acquiring resistance in the process and relapsing. Properattention to regulatory and ethical issues will be needed to facilitate gathering evidence for use in future updates of policy and standards.Until suffi cient evidence is available to inform a change in policy, WHO is advising countries on a case-by-case basis to introduce shortMDR-TB regimens in projects where:■ treatment is delivered under operational research conditions following international standards (including Good Clinical Practice andsafety monitoring), with the objective of assessing the effectiveness and safety of these regimens;■ the project is approved by a national ethics review committee, ahead of any patient enrolment; and■ the programmatic management of DR-TB and the corresponding research project are monitored by an independent monitoring boardset up by, and reporting to, WHO.1Guidelines for the programmatic management of drug-resistant tuberculosis, 2011 update. (WHO/HTM/TB/2011.6). Geneva, World HealthOrganization, 2011.2Ahuja SD et al. Multidrug Resistant Pulmonary <strong>Tuberculosis</strong> Treatment Regimens and Patient Outcomes: An Individual Patient Data Meta-analysis of9,153 Patients. PLoS Med. 2012, 9(8):e1001300.3Van Deun A et al. Short, highly effective, and inexpensive standardized treatment of multidrug-resistant tuberculosis. American Journal of Respiratoryand Critical Care Medicine, 2010, 182(5): 684–692.BOX 4.4MDR-TB and mortalityThe national surveillance data included in this report show that in all WHO regions a much larger proportion of patients in the MDR-TBcohorts die compared with the overall TB patient cohorts (Figure 4.8; see also Table 3.5 and Table 3.6 in Chapter 3). MDR-TB has beendescribed as an independent risk factor for dying even after adjustment for potential confounders. 1,2Data on TB mortality for 2011 from vital registration systems (which exclude deaths attributed to HIV) and data from drug resistancesurveillance on the proportion of TB patients with MDR-TB (among those not previously treated for TB) were analysed to explore therelationship between these variables. There was no association between TB mortality rates and the proportion of TB patients with MDR-TB level in high-income countries (p=0.3) but there was a positive and signifi cant association in low and lower middle-income countries(p
egimens globally, providing more support that helpspatients adhere to treatment and improving data collection,including TB mortality statistics (Box 4.4).4.2.4 Other aspects of MDR-TB programmemanagementIn the course of their illness, patients with MDR-TBmay be cared for as outpatients or in hospitals, usuallysecondary or tertiary facilities. WHO recommends thatwhere possible patients with MDR-TB are treated usingambulatory care rather than models of care based principallyon hospitalization. National policies differ in thepredominant model of care that is employed. Among thehigh MDR-TB burden countries, those in Eastern Europehospitalize 75–100% of patients except for the centralAsian countries (Kazakhstan, Tajikistan and Uzbekistan;30–71%). In the African Region, there is very wide variationin hospitalization, from 10% of patients (DemocraticRepublic of the Congo) to much higher levels of 70%(South Africa) and >95% (Ethiopia and Nigeria). Theaverage duration of hospital stay ranged from 7 to 240days (median: 90 days). The number of visits to a healthfacility after diagnosis of MDR-TB also differed markedlyamong countries from less than 25 (Bangladesh, Estonia,Georgia, Pakistan, South Africa and Viet Nam) to over600 (Bulgaria, Indonesia and Latvia).Palliative and end-of-life care delivered throughhome-based or institutional services is important forpatients with advanced disease that is not responding totreatment. Nine of the European high MDR-TB burdencountries plus South Africa reported providing such carewithin the scope of the TB control programme.Among 14 high MDR-TB burden countries providinginformation on the quality of second-line drugs in thepublic sector, most reported conformity to internationalstandards in all or some supplies of kanamycin (12/14),FIGURE 4.8AFR(26, 6 143)AMR(21, 2 340)EMR(14, 511)EUR(23, 14 158)SEAR(8, 1 140)WPR(15, 1 027)<strong>Global</strong>(107, 25 319)Treatment outcomes for patients diagnosedwith MDR-TB by WHO region, 2009 cohorts.The number of countries reporting outcomes forat least one case, followed by total cases withoutcome data, shown beside each bar.0% 10% 20% 30% 40% 50% 60% 70% 80% 90% 100%Success Died Failed Defaulted Unknowncapreomycin (9/11, with 3 other countries not using it),levofloxacin (10/12, with 2 others not using it), ethionamide/prothionamide(12/14) and p-aminosalicylic acid(9/11, with 3 others not using it). Two countries reportedthat all their drugs conformed only to national regulatorynorms.The information needed to adequately monitor TBpatients, and in particular those on MDR-TB treatment,is substantial. The use of electronic systems as a tool tomanage data is therefore strongly encouraged (see alsoBox 2.5). One of the <strong>Global</strong> Plan’s targets is that all 27high MDR-TB countries manage their data on treatmentof MDR-TB patients electronically by 2015. By 2011, 20reported that national databases were in place for MDR-TB patients, but none were available in Bangladesh, India(see also Box 4.2), Myanmar, Nigeria, the Russian Federation,Ukraine and Viet Nam.GLOBAL TUBERCULOSIS REPORT 2012 51
25020015010050010.80.60.40.208070605040108642025020015010050060504030206000500040003000200010005004003002001000806040200151050110010009008007006005003020100LoansTB/HIVMDR-TBDOTSMDR-TB6050403020706050403020100200001800016000140001200010000806040200UnknownTB/HIVMDR-TBDOTSUnknownTB/HIVMDR-TBDOTSMDR-TBCHAPTER 5Financing TB care and controlKEY FACTS AND MESSAGES The <strong>Global</strong> Plan to Stop TB 2011–2015 sets out the fundingneeded for implementation of TB care and control in lowand middle-income countries. From 2013 to 2015, up toUS$ 8 billion per year is required. In 2015, about US$ 5 billionis needed for the diagnosis and treatment of drug-susceptibleTB, US$ 2 billion for diagnosis and treatment of MDR-TB andalmost US$ 1 billion for TB/HIV interventions. In 2013 funding is expected to reach US$ 4.8 billion in 104low- and middle-income countries (94% of global cases) thatreported data to WHO. These amounts generally excludefunding for TB/HIV interventions, notably ART, that are fundedvia HIV programmes. Thus, an extra US$ 2–3 billion per year isneeded from national and international sources by 2015. There is capacity to mobilize increased funding from domesticsources in low and middle-income countries, especially in Brazil,the Russian Federation, India, China and South Africa (BRICS)that already rely entirely or mostly on national contributions.Increased domestic funding in BRICS will be especially criticalfor scaling up the diagnosis and treatment of MDR-TB. International donor funding of up to US$ 1 billion per year isneeded for low and middle-income countries 2013–2015 toclose funding gaps. This is double the amount of US$ 0.5 billionexpected in 2013 but still much less than the amounts beingmobilized for malaria (US$ 2.0 billion in 2010) and HIV(US$ 6.9 billion in 2010). International donor funding is especially critical to safeguardrecent gains in TB care and control and enable further progressin low-income countries and in the group of 17 HBCs outsideBRICS. In these country groups, it provides >60% and aboutone third of total funding, respectively. Of the international donor funding expected by national TBcontrol programmes in 2013, 88% is from the <strong>Global</strong> Fund. Inthe absence of any other major streams of international donorfunding for TB, the <strong>Global</strong> Fund has a crucial role in sustainingand ensuring further progress in TB care and control worldwide. The cost per person successfully treated for TB with fi rstlinedrugs is in the range US$ 100 to US$ 500 in almost allcountries with a high burden of TB.Progress in TB prevention, care and controlrequires adequate funding. WHO began monitoringof funding for TB in 2002, and the global TBdatabase holds data from 2002 up to 2013. Thischapter focuses on the years 2006–2013, duringwhich trends can be assessed for 104 low- and middle-incomecountries that collectively account for94% of the world’s TB cases.Trends in total funding are broken down bycountry group (Section 5.1), category of expenditure(Section 5.2) and sources of funding (Section5.3), highlighting striking variations in countries’reliance on donor funding. Section 5.4 comparesfunding for TB care and control with total governmentexpenditures on health care. Section 5.5presents estimates of the cost per patient successfullytreated with first-line drugs, as well as thetotal reported funding and unit cost per person forfirst-line and second-line anti-TB drugs. Section 5.6describes the funding gaps reported by countries.The final part of the chapter (Section 5.7) assessesthe gap between projections of potential fundingfrom domestic sources and the funding requirementsspecified in the <strong>Global</strong> Plan.Further details for each of the 104 countries anda few additional countries for which trends couldnot be assessed for the entire period 2006–2013are provided in countryfinance profiles that areavailable online. 1IndiaBrazil| High TB burden | High HIV burden | <strong>Tuberculosis</strong> finance profileWHO TB planning and budgeting tool used: NoTotal National TB Programme (NTP) budget, available funding and expenditureFunding by source (US$ mi lions)2006 2007 2008 2009 2010 2011 2012Funding gap by line item (US$ mi lions)| High TB burden | High HIV burden | High MDR-TB burden | <strong>Tuberculosis</strong> finance profileWHO TB planning and budgeting tool used: NoFunding by source (US$ mi lions)Funding by line item (US$ millions)Grants (exc <strong>Global</strong> Fund)Unknown<strong>Global</strong> FundOR/Surveys/OtherLoansPPM/PAL/ACSM/CBCGovernment, NTP budgetTB/HIVMDR-TBDOTS2006 2007 2008 2009 2010 2011 20122006 2007 2008 2009 2010 2011 2012Received funding (do ted line) and actual expenditure by line item (bar)Funding gap by line item (US$ mi lions)(US$ mi lions)8070OR/Surveys/OtherUnknownPPM/PAL/ACSM/CBCOR/Surveys/OtherTB/HIVPPM/PAL/ACSM/CBCMDR-TBTB/HIVDOTSMDR-TB10DOTS02006 2007 2008 2009 2010 2011 20122007 2008 2009 2010* ACSM: Advocacy, Communication and Social Mobilization; CBC: Community-based TB Care;PAL: Practical Approach to Lung Health; PPM: Public-Private Mix; OR: Operational ResearchDOTS budget required per TB patien to be treatedMDR-TB budget required per MDR-TB patien to be treated(US$ per patient)(US$ per patient)Total National TB Programme (NTP) budget, available funding and expenditurePer-patient budget2008 2009 2010 2011 2012Use of general health servicesAverage length of hospital stay during treatment (days)2006 2007 2008 2009 2010 2011New smear-positiveNew smear-neg/extrapMDR-TBGrants (exc <strong>Global</strong> Fund)<strong>Global</strong> FundGovernment, NTP budgetOR/Surveys/OtherPPM/PAL/ACSM/CBCFunding by line item (US$ mi lions)8070OR/Surveys/OtherPPM/PAL/ACSM/CBC1002006 2007 2008 2009 2010 2011 2012Received funding (dotted line) and actual expenditure by line item (bar)(US$ mi lions)2006 2007 2008 2009 2010 2011 20122007 2008 2009 2010* ACSM: Advocacy, Communication and Social Mobilization; CBC: Community-based TB Care;PAL: Practical Approach to Lung Health; PPM: Public-Private Mix; OR: Operational ResearchPer-patient budget02008 2009 2010 2011 2012DOTS budget required per TB patien to be treated(US$ per patient)2008 2009 2010 2011 2012Use of general health servicesAverage length of hospital stay during treatment (days)2006 2007 2008 2009 2010 2011Outpatient care during treatment (typical number of visits)2006 2007 2008 2009 2010 2011New smear-positiveNew smear-neg/extrapMDR-TBGenerated: September 23, 2012 Source: www.who.int/tb/dataNew smear-positiveNew smear-neg/extrapMDR-TB budget required per MDR-TB patien to be treated(US$ per patient)2008 2009 2010 2011 2012Outpatient care during treatment (typical number of visits)2006 2007 2008 2009 2010 2011OR/Surveys/OtherPPM/PAL/ACSM/CBCNew smear-positiveNew smear-neg/extrapGenerated: September 23, 2012 Source: www.who.int/tb/data1w ww.who.int/tb/data52 GLOBAL TUBERCULOSIS REPORT 2012
5.1 Funding for TB care and control bycountry group, 2006–2013In the 104 countries for which trends in TB funding since2006 can be assessed and that report 94% of the world’sTB cases (listed in Table 5.1), funding is expected to reachUS$ 4.8 billion in 2013 (Figure 5.1). This is an increasein real terms from US$ 3.4 billion in 2006 and a smallincrease from US$ 4.6 billion in 2012.Brazil, the Russian Federation, India, China and SouthAfrica (BRICS), which report 48% of the world’s TB cases(Chapter 3), account for US$ 3 billion (63%) of theexpected total of US$ 4.8 billion in 2013 (Figure 5.1). Theother 17 high TB burden countries (HBCs) outside BRICS(listed in Table 5.2), which report 34% of the world’s TBcases, account for US$ 0.6 billion. A group of 10 Europeancountries other than the Russian Federation accounts fora further US$ 0.5 billion (80% of which is accounted forby three countries: Romania, Turkey and Uzbekistan).Patterns of funding for multidrug-resistant TB (MDR-TB) specifically are different, as described in Box 5.1.5.2 Funding for TB care and control bycategory of expenditure, 2006–2013In each year 2006–2013, the largest share of funding hasbeen used for the diagnosis of TB and treatment withfirst-line drugs (all categories of expenditure except thoselabelled MDR-TB in Figure 5.2 and Figure 5.4). However,funding for the diagnosis and treatment of MDR-TB hasbeen increasing and is expected to exceed US$ 0.7 billionin 2013 (Figure 5.2). Much of the increase is accounted forby BRICS, but allocations are increasing in other HBCsand the rest of the world as well (Figure 5.4).The relatively small amounts of funding reported forcollaborative TB/HIV activities (see Chapter 7 for furtherdetails) reflect the fact that funding for most of theseinterventions (including the most expensive, antiretroviraltreatment) is usually channelled to national HIVprogrammes and nongovernmental organizations ratherthan to national TB control programmes (NTPs).5.3 Funding for TB care and control bysource of funding, 2006–2013Domestic funding from national governments is thesingle largest source of funding for TB care and control(Figure 5.3), accounting for 90% of total expected fundingin 2013. 1 Of the remaining 10% that is expected fromdonor sources in 2013, most (88%) is accounted for byFIGURE 5.1 Funding for TB care and control in 104countries reporting 94% of global cases,by country group, 2006–2013US$ billions (constant 2012 US$)5432103.4 3.33.63.94.04.54.64.82006 2007 2008 2009 2010 2011 2012 2013Low- and middleincomecountries,excluding HBCs andEuropeLow- and middleincomecountries ofEurope, excludingthe RussianFederationHBCs, excludingBRICSBRICSFIGURE 5.2 Funding for TB care and control in 104countries reporting 94% of global cases,by line item, 2006–2013US$ billions (constant 2012 US$)5432103.43.33.63.94.04.54.64.82006 2007 2008 2009 2010 2011 2012 2013General health-careservices: MDR-TBGeneral health-careservices: DOTSOtherPPM/PAL/ACSM/CBC/OR/surveysTB/HIVMDR-TBDOTS aaDOTS includes funding available for fi rst-line drugs, NTP staff, programmemanagement and supervision, and laboratory equipment and supplies.FIGURE 5.3 Funding for TB care and control in 104countries reporting 94% of global cases,by source, 2006–2013US$ billions (constant 2012 US$)5432103.4 3.33.63.94.04.54.64.82006 2007 2008 2009 2010 2011 2012 2013<strong>Global</strong> FundGrants (excluding<strong>Global</strong> Fund)Government,general health-careservicesGovernment, NTPbudget (includingloans)1Domestic funding includes funding for outpatient visits andinpatient care in hospitals, the costs of which are not usuallyincluded in NTP budgets and expenditures. The amount ofdomestic funding for these inputs to TB treatment are estimatedby combining data on the average number of outpatientvisits and days in hospital per TB patient reported by countrieswith WHO estimates of the unit costs of outpatient visits andbed-days (see www.who.int/choice).GLOBAL TUBERCULOSIS REPORT 2012 53
TABLE 5.1 104 countries for which trends in TB funding could be assessed, by income group and WHO region,2006–2013 aWHO REGIONAfricanLOW-INCOME(GNI PER CAPITA US$ 1025 IN 2011)Benin, Burkina Faso, Burundi, CentralAfrican Republic, Chad, DemocraticRepublic of the Congo, Eritrea,Ethiopia, Gambia, Guinea-Bissau,Kenya, Liberia, Madagascar, Malawi,Mali, Mauritania, Mozambique, Niger,Rwanda, Sierra Leone, Togo, Uganda,United Republic of Tanzania, ZimbabweLOWER MIDDLE-INCOME(GNI PER CAPITA US$ 1026–4035 IN 2011)Cameroon, Cape Verde, Congo, Côted’Ivoire, Ghana, Lesotho, Nigeria,Sao Tome and Principe, Senegal,Swaziland, ZambiaAmericas Haiti Bolivia (Plurinational State of),El Salvador, Guatemala, Guyana,Honduras, Nicaragua, ParaguayEastern Mediterranean Afghanistan, Somalia Djibouti, Egypt, Morocco, Pakistan,Sudan, YemenEuropeanArmenia, Georgia, Republic ofMoldova, UzbekistanSouth-East Asia Bangladesh, Myanmar, Nepal Bhutan, India, Indonesia, Sri Lanka,Timor-LesteWestern Pacific Cambodia Kiribati, Lao People’s DemocraticRepublic, Micronesia (Federated Statesof), Mongolia, Papua New Guinea,Philippines, Solomon Islands, Tonga,Vanuatu, Viet NamUPPER MIDDLE-INCOME(GNI PER CAPITA US$ 4036–12 475 IN 2011)Botswana, Gabon, Namibia, SouthAfricaArgentina, Brazil, Colombia, DominicanRepublic, Ecuador, Jamaica, Mexico,Panama, Suriname, Venezuela(Bolivarian Republic of)Iran (Islamic Republic of), Jordan,Lebanon, TunisiaBulgaria, Latvia, Montenegro, Romania,Russian Federation, Serbia, TurkeyMaldives, ThailandChina, Malaysia, TuvaluaAnother 11 low- and lower middle-income countries with data available for the years 2011–2013 were included in the analyses of Figure 5.12: low-income, African:Guinea; low-income, European: Kyrgyzstan, Tajikistan; low-income, South-East Asia: Democratic People’s Republic of Korea; lower middle-income, Americas: Belize;lower middle-income, Eastern Mediterranean: Iraq, Syrian Arab Republic, West Bank and Gaza Strip; lower middle-income, European: Ukraine; lower middle-income,Western Pacific: Fiji, Marshall Islands.FIGURE 5.4Funding for drug-susceptible TB a and MDR-TB, b 2006–2013, by country groupUS$ millions (constant 2012 US$)BRICS300020001000Other HBCs6004002001000500Other low- and middle-income countriesDrug-susceptible TB,best estimate and5−95th percentilesMDR-TB, bestestimate and5−95th percentiles0002006 2008 2010 20122006 2008 2010 20122006 2008 2010 2012aCosts include fi rst-line drugs, NTP staff, programme management and supervision, laboratory equipment and supplies, hospital stays and clinic visits.bCosts include second-line drugs, programme management and supervision, hospital stays and clinic visits.54 GLOBAL TUBERCULOSIS REPORT 2012
TABLE 5.2 NTP budgets, available funding, cost of utilization of general health-care services and total funding requiredfor TB care and control, 2013 (current US$ millions) a,bNTP BUDGETREQUIREDGOVERNMENT(INCLUDINGLOANS)AVAILABLE FUNDINGGLOBAL FUNDGRANTS(EXCLUDINGGLOBAL FUND)REPORTEDFUNDINGGAPCOST OFGENERALHEALTH-CARESERVICES(ESTIMATED)TOTALFUNDINGREQUIRED% OFDOMESTICFUNDING INNTP BUDGETAfghanistan 11 0.4 2.2 1.1 7.2 2.8 14 10 30Bangladesh 50 1.2 15 0 34 3.2 54 7.1 15Brazil 86 70 0 0.1 16 22 108 100 100Cambodia 25 1.1 2.9 4.8 17 6.8 32 12 31China 341 239 48 0 55 0 341 83 83% OFDOMESTICFUNDINGIN TOTALAVAILABLE cDemocratic Republic of the Congo 14 0 8.6 0 5.2 0.2 14 0 1.1Ethiopia 52 0 13 0 39 12 64 0 24India 207 120 81 5.7 0 93 300 58 71Indonesia d 117 2.7 29 0 85 39 156 8.5 59Kenya 51 8.6 3.6 3.5 36 9.5 61 55 64Mozambique 35 1.9 3.7 2.5 27 6.7 42 24 41Myanmar 31 0.7 8.3 0.3 22 6.6 38 7.5 27Nigeria 39 8.7 12 8.3 10 17 57 30 56Pakistan 52 0 17 0 35 12 63 0 41Philippines 78 28 0 0 50 98 176 100 100Russian Federation — —South Africa — —Thailand 44 40 1.0 0 2.7 3.5 48 98 98Uganda — —United Republic of Tanzania 57 7.6 4.6 2.8 42 1.9 59 51 53Viet Nam 63 5.6 13 0 45 49 113 31 81Zimbabwe 38 2.8 7.5 3.5 24 17 54 20 4222 high-burden countries e 1 390 538 270 33 549 401 1 791 64 73AFR 821 383 129 38 272 680 1 501 70 85AMR 177 123 15 1.5 37 170 347 88 95EMR 126 32 44 1.9 48 65 192 41 66EUR 1 590 1 547 30 0 14 522 2 227 98 99SEA 479 181 145 6.5 146 162 642 54 68WPR 541 293 69 6.1 173 225 765 80 87Low income 467 37 125 24 283 85 551 20 32Lower middle income 831 264 250 27 291 517 1 348 49 74Upper middle income 2 435 2 257 57 3.2 117 1 221 3 774 97 98Low- and middle-income countries 3 733 2 558 431 54 691 1 823 5 673 84 89Blank cells indicate data not reported.— indicates values that cannot be calculated.aValues in this table may differ from those presented in the fi gures of this chapter, as they have not been adjusted to constant 2012 US$.bRegion, income group and global totals include estimates for those countries that did not report data for 2013.cTotal available is the sum of funding available in the NTP budget plus the cost of general health-care services. In low-income countries, the percentage of general healthcareservices cost that is domestically funded is assumed to equal the midpoint between the percentage of NTP funding from domestic sources and 100%. In all othercountries it is assumed to equal 100%. Sensitivity to this assumption is analyzed in Figure 5.5.dIndonesia was not able to report funding expected from provincial and district budgets in 2013; these numbers refl ect only the central government’s expected contribution.eThese totals do not include estimates for countries that did not report data for 2013 (Russian Federation, South Africa and Uganda).GLOBAL TUBERCULOSIS REPORT 2012 55
BOX 5.1Fun ding for diagnosis and treatment of MDR-TB, 2009–2013The geographical distribution of MDR-TB cases differs considerably from that of all TB cases. Of the estimated 310 000 MDR-TB cases amongnotifi ed pulmonary TB cases in 2011, almost 60% were accounted for by three countries: (in rank order) India, China and the Russian Federation(Chapter 4). Of the 27 high MDR-TB burden countries that account for about 85% of estimated cases globally, 15 are in the European Region,where the prevalence of MDR-TB among new and previously treated cases is highest (ranging from 9%–32% in new cases and 29%–76%among previously treated cases). The costs of diagnosing and treating MDR-TB are also much higher than the costs of diagnosing and treatingdrug-susceptible TB. The regimens recommended in WHO guidelines, which last 20 months for most patients, can cost several thousands of USdollars. Other costs associated with patient care are also high. 1The funding available for MDR-TB treatment in the 104 countries that reported fi nancial data, and which have 75% of the world’s estimatedcases of MDR-TB, increased from US$ 0.5 billion in 2009 to US$ 0.6 billion in 2011 (Table B5.1.1). 1 This fi gure is expected to increase to morethan US$ 0.7 billion in 2012 and 2013. NTP spending on second-line drugs and programme management accounts for about three quarters ofthe total. Second-line drugs alone now amount to more than US$ 0.3 billion per year. The remaining funding (about US$ 0.2 billion) is channelledthrough general health-care services (GHS) for inpatient and outpatient treatment of patients with MDR-TB.TABLE B5.1.1Funding available and reported gaps for MDR-TB in 104 low- and middle-income countries, US$ millions2009 2010 2011 2012 2013Low- and middle-income Available funding a 450 566 615 719 705countriesAvaliable (NTP only) b 353 445 443 541 523Avaliable (GHS only) 97 121 172 178 183% domestic c 89 90 85 71 78<strong>Report</strong>ed gap 117 58 81 115 84High MDR-TB burden Available funding a 384 490 526 610 600countriesAvaliable (NTP only) b 315 409 408 492 472Avaliable (GHS only) 68 81 118 119 128% domestic c 90 91 85 70 77<strong>Report</strong>ed gap 109 42 58 94 61Upper middle-income Available funding a 387 501 513 533 521countriesAvaliable (NTP only) b 307 400 373 389 374Avaliable (GHS only) 80 101 140 144 148% domestic c 95 97 93 86 92<strong>Report</strong>ed gap 99 6 11 67 8Lower middle-income Available funding a 48 54 82 158 162countriesAvaliable (NTP only) b 33 35 53 128 131Avaliable (GHS only) 15 19 28 30 31% domestic c 57 42 46 32 40<strong>Report</strong>ed gap 11 38 49 26 42Low-income countries Available funding a 14 11 20 28 21Avaliable (NTP only) b 13 9 16 24 18Avaliable (GHS only) 1 2 3 4 3% domestic c 38 29 34 26 31<strong>Report</strong>ed gap 6 15 22 23 33GHS, general health-care services for hospital stays and clinic visits; MDR-TB, multidrug-resistant TB; NTP, national TB control programme or equivalentaIncludes funding for second-line drugs, MDR-TB programme management and supervision and estimated cost of GHS for patients with MDR-TB.bIncludes funding for second-line drugs, MDR-TB programme management and supervision only.cAssumes GHS is domestically funded.About 85% of the funding available is concentrated in the high MDR-TB burden countries, in particular upper middle-income countries. Inabsolute terms, China and India have the largest external grants for MDR-TB, at US$ 41 million and US$ 43 million respectively from the <strong>Global</strong>Fund in 2013. Meanwhile, low-income and lower middle-income countries report a funding gap of US$ 75 million in 2013, leaving almost onethird of their budgets for MDR-TB unfunded.1Fitzpatrick C, Floyd K. A systematic review of the cost and cost effectiveness of treatment for multidrug-resistant tuberculosis. Pharmacoeconomics, 2012,30:63–80.56 WHO REPORT 2012 GLOBAL TUBERCULOSIS CONTROL
FIGURE 5.5Trends in domestic and donor funding for TB care and control, 2006–2013, by country group aBRICS3000400Other HBCsLow--income countries200Domestic sourcesincluding GHS,5−95th percentiles aForeign sourcesincluding <strong>Global</strong> Fund,5−95th percentiles a<strong>Global</strong> Fund only,best estimateUS$ millions (constant 2012 US$)200010003002001001501005002006 2008 2010 201202006 2008 2010 201202006 2008 2010 2012aIn probabilistic sensitivity analysis, the percentage of GHS costs that is domestically funded in low-income countries is assumed to follow a uniform distribution, rangingfrom the percentage of NTP funding from domestic sources up to 100%.grants from the <strong>Global</strong> Fund (Table 5.2). Funding reportedby NTPs from other donor sources amounts to onlyUS$ 54 million in 2013, although bilateral and multilateralfunds are not always channelled through NTPs. Forexample, donors may provide funding directly to nongovernmentalorganizations and to technical agencies. Recentdata on technical assistance compiled by TB-TEAM (TBTechnical Assistance Mechanism) are provided in Box 5.2.International donor funding for TB care and controlhas increased from US$ 0.2 billion in 2006 to almostUS$ 0.5 billion in 2013, but still falls short of funding formalaria (US$ 2.0 billion in 2010) 1 and HIV (US$ 6.9 billionin 2010). 2<strong>Global</strong> statistics on sources of funding conceal importantvariations in the extent to which countries rely ondomestic and donor financing (Figure 5.5, Figure 5.6, Table5.2). Differences among BRICS, the other 17 HBCs andthe group of low-income countries are especially striking(Figure 5.5). In BRICS, domestic funding has consistentlyaccounted for most of the funding for TB care and control(for example, >95% in 2012 and 2013), although India isan outlier at 71% in 2013. In the other 17 HBCs (listed inTable 5.2), the share of total funding from donor sourceswas in the range 28–41% between 2006 and 2013. Thegroup of low-income countries (24 African countriesas well as Afghanistan, Bangladesh, Cambodia, Haiti,Myanmar, Nepal and Somalia) are most reliant on donorfunding: for example, in 2012, 59% of total funding wasfrom donor sources. In 2013, 70% of available fundingwill be from donor sources in five HBCs: Afghanistan,Bangladesh, the Democratic Republic of the Congo, Ethiopiaand Myanmar (Table 5.2).Throughout the period 2006–2011, donor fundingexceeded domestic funding in low-income countries,and in 2010 and 2011 financing from the <strong>Global</strong> Fundalone exceeded domestic contributions. The data reportedin 2012 suggest that this pattern will persist in 2012 and2013. The <strong>Global</strong> Fund has a crucial role in sustaining andensuring further progress in TB care and control.Of particular concern is the expectation that donorfunding will be lower in 2013 compared with 2012 inthe 17 HBCs outside BRICS and low-income countries(current data suggest decreases of up to 33% and 18%,respectively). Donor funding is essential to safeguardrecent gains in TB control in the 17 HBCs outside BRICSand low-income countries.5.4 Funding for TB care and controlcompared with total governmentexpenditures on health careIn general, spending on TB control as a proportion ofpublic sector health expenditures 3 is relatively low (Figure5.7). In most countries, TB control accounts for lessthan 3% of public health expenditures. Countries withhigher levels of spending on TB relative to total governmentexpenditures on health are mostly in Africa, easternEurope (for example, Ukraine) or central Asia. Partof the explanation for countries in eastern Europe andcentral Asia is comparatively high levels of MDR-TB (seeChapter 4), which is more expensive to treat. Other reasonsinclude continued use of models of care for all formsof TB that rely extensively on inpatient care. For example,in Kazakhstan, 84% of smear-negative cases 4 and 96%1World malaria report 2011. Geneva, World Health Organization,2011.2Financing the response to AIDS in low- and middle-income countries:international assistance from donor governments in 2010. UNAIDSand the Kaiser Family Foundation, 2010 (also available at www.unaids.org).3Source: World Health Organization National Health Accountdatabase (www.who.int/nha/en) accessed via http://data.worldbank.org/indicator/SH.XPD.PUBL.ZS in July 2012.4For case definitions, see Chapter 3.GLOBAL TUBERCULOSIS REPORT 2012 57
BOX 5.2Technical assistance for TB care and controlThe <strong>Global</strong> Plan to Stop TB 2011–2015 highlights the important role of technical assistance to NTPs. The funding required over five years wasestimated at US$ 2.1 billion, or approximately US$ 400 million per year.The TB Technical Assistance Mechanism (TB-TEAM) of the Stop TB Partnership was established in 2007 to monitor and coordinate the provisionof technical assistance to NTPs. The secretariat function is carried out by WHO’s Stop TB Department. Requests from countries for technicalassistance are matched to appropriate technical partners via the TB-TEAM web site. Technical partners are expected to provide informationabout the purpose of the mission, the dates of travel, funding sources and a mission report via the website. All technical partners are invited toreview and comment on quarterly and annual analyses of data.TABLE B5.2.1Number of missions conducted by technical partners andreported to TB-TEAM, 2011PROVIDER OF TECHNICAL ASSISTANCENUMBER OFMISSIONS IN2011% OFTOTALWHO regional offi ces 126 20The Union 86 13KNCV <strong>Tuberculosis</strong> Foundation 67 10Centers for Disease Control and Prevention(CDC), USA60 9WHO headquarters 55 9<strong>Global</strong> Drug Facility 39 6WHO country offi ces 35 5Grant Management Solutions (GMS) project 33 5NTP/national TB-TEAM 25 4TB-REACH 19 3Other 100 16Total 645 100TABLE B5.2.2Number of missions by topic reported to TB-TEAM, 2009–2011TOPIC 2009 2010 2011In 2011, 645 missions were completed and reported to TB-TEAM(Table B5.2.1). About one third of recorded missions wereorganized by WHO, mainly by regional offi ces, and one third by theUnion, the KNCV <strong>Tuberculosis</strong> Foundation and the United StatesCenters for Disease Control and Prevention (CDC).In 2011, the main technical areas for which assistance was providedwere MDR-TB and XDR-TB; monitoring and evaluation linked toimpact measurement; the grant processes of the <strong>Global</strong> Fund;review missions; and laboratory strengthening (Table B5.2.2). Thedata also show that the number of missions fell between 2009 and2011. This downward trend occurred among most major technicalpartners, including WHO, the KNCV <strong>Tuberculosis</strong> Foundation andthe Union (data not shown), and was especially noticeable for threetopics: MDR and XDR-TB, management of drugs and commodities,and development of <strong>Global</strong> Fund proposals.Information on sources of funding is often not recorded; in the fi rsthalf of 2012, the source of funding was not recorded for 40% ofmissions. Of the 389 missions for which information on fundingwas provided, 78% was from agencies of the US government,notably the United States Agency for International Development(USAID) and OGAC (the Offi ce of the <strong>Global</strong> AIDS Coordinator). Theremaining 22% was from Eli Lilly and the Canadian InternationalDevelopment Agency (CIDA).% OFTOTAL IN2011MDR-TB and XDR-TB 120 129 91 14Monitoring and evaluation, supervision and impactmeasurement46 63 73 11<strong>Global</strong> Fund grant processes, bottlenecks 34 40 72 11TB programme planning and review; regional meetings 77 107 64 10Laboratory strengthening 54 79 57 9Drugs and commodities management 89 70 53 8Infection control 26 34 36 6Operational and basic science research 9 17 34 5TB/HIV 13 17 31 5Human resources development 27 39 23 4<strong>Global</strong> Fund proposal development 52 30 19 3Advocacy, communication and social mobilization 26 18 12 2Childhood TB 3 4 9 1Drug resistance surveillance 2 8 9 1Other 217 114 62 10Total 795 769 645 100The regional distribution of missions broadlycorrelates to TB burden (data not shown).An exception is the European Region, whichaccounts for 19% of missions but for 5% of TBcases reported globally. Most of the missions inthis region are related to MDR-TB and laboratorystrengthening. The South-East Asia Region has acomparatively low share of missions (12%) whilereporting almost 40% of TB cases globally. Oneexplanation may be that technical assistanceprovided from within-country sources in India isnot captured in the database.58 WHO REPORT 2012 GLOBAL TUBERCULOSIS CONTROL
FIGURE 5.6Domestic funding as a percentage of total funding available for TB care and control, aaverage 2009–20110–910–4950–7475–8990–100No dataNot applicableaGeneral health-care services are assumed to be domestically funded in all but the low-income countries, where the share of domestic funding is instead taken to be themedian value obtained through the probabilistic sensitivity analysis described in Figure 5.5.FIGURE 5.7Expenditures for TB care and control as a percentage of public sector health expenditures,average 2007–2009< 11–2.9%3–4.9%≥ 5%No dataNot applicableGLOBAL TUBERCULOSIS REPORT 2012 59
of smear-positive cases are hospitalized, with averagelengths of stay of 60 and 100 days respectively; 35% ofMDR-TB cases are hospitalized for 160 days. Nonetheless,there are signs that countries are reducing their relianceon hospitalization. For example, Uzbekistan reported areduction in the number of dedicated TB beds from morethan 15 000 in 2008 to less than 11 000 in 2012; theaverage duration of hospitalization for MDR-TB patientsdecreased from 270 to 90 days during the same period.5.5 Unit costs and cost effectivenessof TB careThe estimated cost per patient successfully treated for TBwith first-line drugs is shown for each of the 22 HBCs inFigure 5.8. The cost generally lies in the range US$ 100–500 per patient successfully treated. The exceptions areBangladesh, India and Myanmar (under US$ 100); Brazil(above US$ 500); and the Russian Federation and SouthAfrica (both above US$ 1000). From 2006 to 2011, thecost per patient treated increased in almost all of theHBCs, as did GDP [gross domestic product] per capita.It is noticeable that in all of the HBCs, the cost perpatient treated is less than GDP per capita (that is, allvalues lie below the solid red line in Figure 5.8). BesidesGDP, a further explanation for variation in costs appearsto be the scale at which treatment is provided. Some ofthe countries with relatively low costs for their incomelevel (for example, China, India, Indonesia and Pakistan)are countries where the total number of patients treatedeach year is comparatively high (as shown by the size ofthe circles in Figure 5.8).As in previous years, the cost of treating TB patientswith first-line drugs in the Russian Federation is higherthan might be expected for the country’s income level.The relatively high cost is due in large part to an extensivenetwork of hospitals and sanatoria that are used forlengthy inpatient care. It should also be highlighted thatthe characteristics of the patient population in the RussianFederation (such as high rates of alcohol dependencyand unemployment, and a comparatively high proportionof ex-prisoners) may also warrant additional investmentsin some aspects of TB care. Examples include patientenablers and incentives to support outpatient care, andpsychosocial support.The cost per patient successfully treated with firstlinedrugs at country level is summarized in Figure 5.9.In most countries in the African, South-East Asia andWestern Pacific regions, the cost per patient successfullytreated is under US$ 1000 (exceptions include Botswanaand South Africa in the African Region, and Malaysiaand Mongolia in the Western Pacific Region). Costs arehigher in the Region of the Americas and the EuropeanRegion (notably in Kazakhstan).Evidence on the cost effectiveness of interventions forTB care and control is summarized in Box 5.3.Data reported by countries also allow analysis of thefunding available for first- and second-line anti-TB drugs,and the unit cost (per patient) for first- and second-lineregimens (Figure 5.10). The total funding amounts toabout US$ 0.2 billion per year for first-line drugs, witha cost per patient of less than US$ 40 in low- and lowermiddle-income countries, and around US$ 50 in uppermiddle-income countries. The <strong>Global</strong> Drug Facility’s StopTB Patient Kit costs only US$ 22.30 for new cases; freight,quality control, inspection, agent fees and insurance mayexplain why some low-income countries continue toreport unit costs in excess of these prices.Public spending on second-line drugs is at leastUS$ 0.2 billion. Unfortunately, Figure 5.10 does notinclude amounts being spent in the Russian Federationand South Africa, which are known to be large butfor which reliable data are not available for the years2009–2013; if these were included, spending on secondlinedrugs would greatly exceed spending on first-linedrugs. The unit cost for second-line anti-TB drugs ismuch higher than that for first-line drugs. National programmesspent US$ 1200–3800 per patient treated withsecond-line drugs in 2011. They appear to be budgetingfor increases in 2013: from about US$ 2600 per patient inlow-income countries to US$ 4700 per patient in uppermiddle-income countries.5.6 Funding gaps reported by countries,2006–2013Despite increases in funding and 10 completed rounds ofproposals 1 to the <strong>Global</strong> Fund, NTPs continue to reportfunding gaps (Figure 5.11). Since 2007, these gaps havebeen in the range US$ 0.4–0.7 billion per year. In 2013,funding gaps are anticipated for several elements of TBcare and control, including first-line drugs. It is also evidentthat while countries have developed budgets foractivities to strengthen and enhance the basics of TB careand control (such as public–public and public–privatemix initiatives to increase reporting of cases and improvetreatment outcomes, and advocacy, communication andsocial mobilization), gaps relative to available funding forthese activities (shown in Figure 5.2) are comparativelylarge.Funding gaps have persisted and widened during thepast decade. 2 Funding gaps reported for 2013 are morethan 20% of the budgets developed by NTPs in 38 countries,including 16 HBCs (Table 5.2).1The first round was completed in 2003. Round 10 was completedin 2010.2Further details for individual HBCs can be found in Annex 2,and in finance country profiles for more than 100 countriesthat are available online at www.who.int/tb/data.60 GLOBAL TUBERCULOSIS REPORT 2012
FIGURE 5.8Cost per TB patient successfully treated with first-line drugs, a 22 high TB burden countries, bCost per patient successfully treated (constant 2012 US$), log scale10000500020001000500200100502006 and 2011 c AFTZETCDMZUGBDTHKHNGIDCNZW KEPKMMINRUZABRVN PH100 200 500 1000 2000 5000 10000GDP per capita (constant 2012 US$), log scale The size of the green circle is proportional to the number ofpatients treated in 2011.— The green tail attached to each circle depicts the change incost per patient successfully treated and GDP per capitabetween 2006 and 2011. The grey area depicts the 95% confi dence interval for theprediction (= white line) of the unweighted log–log regressionof cost per patient successfully treated on GDP per capitain 2011.— The red line marks where cost per patient successfully treatedequals GDP per capita.aCosts include fi rst-line drugs, NTP staff, programmemanagement and supervision, laboratory equipment andsupplies, collaborative TB/HIV activities, PPM, PAL, ACSM,CBC, operational research, surveys, hospital stays and clinicvisits.bAF Afghanistan; BD Bangladesh; BR Brazil; CN China; CDDemocratic Republic of the Congo; ET Ethiopia; ID Indonesia;IN India; KE Kenya; KH Cambodia; MM Myanmar; MZMozambique; NG Nigeria; PK Pakistan; PH Philippines; RURussian Federation; TH Thailand; TZ United Republic ofTanzania; UG Uganda; VN Viet Nam; ZA South Africa; ZWZimbabwe.cCosts per patient treated are case-weighted three-yearaverages, 2004–2006 and 2009–2011, to minimizedistortions associated with non-annual expenses on itemssuch as buildings, equipment and buffer stocks of drugs. Notime trend is provided for South Africa and Thailand, due tolack of data.FIGURE 5.9 Cost per TB patient successfully treated with first-line drugs a (US$), average 2009–2011< 100100–499500–9991000–49995000–9999≥ 10 000No dataNot applicableaCosts include fi rst-line drugs, NTP staff, programme management and supervision, laboratory equipment and supplies, collaborative TB/HIV activities, PPM, PAL, ACSM,CBC, operational research, surveys, hospital stays and clinic visits.GLOBAL TUBERCULOSIS REPORT 2012 61
BOX 5.3Cost effectiveness of interventions for TB care and controlNational TB control programmes have provided good value for the US$ 23 billion they received in the years 2006–2011. A total of 34million TB cases were detected and treated over the same period. Treatment success rates have risen (Table 3.5, Table 3.6) while unitcosts have remained low relative to income levels (Figure 5.8). The cost effectiveness of core interventions for TB care and control isstrongly supported by reviews and meta-analyses of economic evaluations, as summarized in Table B5.3.1.The disability adjusted life year (DALY) is a commonly-used metric for measuring and comparing health outcomes across interventions.Applied to TB treatment, a DALY averted is approximately equal to a year of life saved. For patients with smear-positive pulmonary TBthat is sensitive to fi rst-line drugs, a short course of chemotherapy for 6 months costs as little as US$ 5–50 per year of life saved. Treatingsmear-negative forms of drug-sensitive TB costs somewhat more, at US$ 60–200 per year of life saved (refl ecting a lower case fatality ratein the absence of treatment and less transmission). TB that is resistant to both isoniazid and rifampicin (MDR-TB) requires longer and moreexpensive treatment with second-line drugs and costs US$ 200–800 per year of life saved.TABLE B5.3.1Summary of the available evidence on the cost effectiveness of interventions for TB care and control 1,2,3,4POPULATION INTERVENTION COST PER DALY AVERTED (US$) aPatients with smear-positive TB First-line treatment under DOTS 5–50Patients with smear-negative or extrapulmonary TB First-line treatment under DOTS 60–200Patients with MDR-TB 18–24 months of second-line treatment under WHO guidelines 200–800People living with HIV, infected with TB Isoniazid preventive therapy 15–300People living with HIV, with TB disease First-line drugs under DOTS plus ART 100–365People in whom TB is suspected Diagnosis of TB using Xpert MTB/RIF as an add-on to smear 40–200aFor those unfamiliar with the DALY, this column may be interpreted as the cost per year of life saved.WHO defi nes an intervention as “highly cost effective” if the cost per DALY averted is less than the GDP per capita of the country in whichit is being implemented. According to this benchmark, interventions for TB care and control are highly cost effective even in the lowestincomecountries. The high cost effectiveness of TB care and control was recognized by the Disease Control Priorities Project in 2006: TBtreatment was listed as one of the “best buys” in public health. 5 More recently, the Copenhagen Consensus included the expansion of TBtreatment among its top fi ve investments, out of some 40 proposals designed by experts to address urgent global challenges includingarmed confl ict, climate change, education, hunger and control of infectious diseases. 61Dye C, Floyd K. <strong>Tuberculosis</strong>. In: Disease control priorities in developing countries, 2nd ed. New York, Oxford University Press, 2006:289–312.2Baltussen, R, Floyd K, Dye C. Achieving the millennium development goals for health: cost effectiveness analysis of strategies for tuberculosis control indeveloping countries. BMJ, 2005, 331:1364–1368.3Fitzpatrick C, Floyd K. A Systematic Review of the Cost and Cost Effectiveness of Treatment for Multidrug-Resistant <strong>Tuberculosis</strong>. Pharmacoeconomics,2012, 30:63–80.4Vassall A et al. Rapid diagnosis of tuberculosis with the Xpert MTB/RIF assay in high burden countries: a cost-effectiveness analysis. PLoS Medicine,2011, 8(11):e1001120 (doi:10.1371/journal.pmed.1001120).5www.dcp2.org/main/Home.html6Nobel laureates: more should be spent on hunger, health: top economists identify the smartest investments for policy-makers and philanthropists [pressrelease dated 14 May 2012]. Denmark, Copenhagen Consensus, 2012 (available at www.copenhagenconsensus.com/Projects/CC12/Outcome.aspx;accessed July 2012).5.7 Projections of potential funding fromdomestic sources and fundingrequirements specified in the <strong>Global</strong> PlanThe <strong>Global</strong> Plan to Stop TB 2011–2015 was published by theStop TB Partnership in 2010. 1 It sets out what needs tobe done to achieve the global targets for TB control setfor 2015 in 149 low- and middle-income countries, 2 andthe associated funding requirements (Table 5.3). The total1The <strong>Global</strong> Plan to Stop TB, 2011–2015. Geneva, World HealthOrganization, 2010 (WHO/HTM/STB/2010.2).2For a summary of the targets set in the plan, see Chapter 1.requirement over five years amounts to US$ 47 billion.Excluding research and development for new TB drugs,diagnostics and vaccines (Chapter 8), which are not theresponsibility of NTPs, the total is US$ 37 billion.Funding needs for TB care and control in the <strong>Global</strong>Plan (i.e. amounts excluding those for research) wereestimated to grow from around US$ 6 billion in 2011 toUS$ 8 billion in 2015. Diagnosis and treatment with firstlinedrugs for drug-susceptible TB following the DOTSapproach account for the largest single share of funding– US$ 4 billion in 2011 increasing to around US$ 5 billionin 2015. The second largest component is diagnosis and62 GLOBAL TUBERCULOSIS REPORT 2012
FIGURE 5.10 Total cost and unit cost of first- and second-line anti-TB drugs in 99 countries, a 2009–2013, bby income groupTotal cost, US$ millions(constant 2012 US$)Upper middle-income countries excluding RS c1005754 605028 272202009 2010 2011 2012 2013Lower middle-income countries10281706434212009 2010 2011 2012 2013Low-income countries4631445 4 132009 2010 2011 2012 2013First-line,5–95thpercentilesSecond-line,5–95thpercentilesUpper middle-income countries excluding RS c 2009 2010 2011 2012 2013Lower middle-income countriesLow-income countriesUnit cost, (constant US$), log scale2000010000 724750001000383510047 47503046725044532320 439626 28232022291199 256036362009 2010 2011 2012 20132009 2010 2011 2012 2013aThese 99 countries account for 85% of global drug-susceptible TB cases and 29% of MDR-TB cases receiving treatment. See also note (c).bValues for 2012 and 2013 are based on country plans and budgets, not actual expenditures. Unit costs are case-weighted two-year averages to adjust for purchases ofbuffer stock.cThe Russian Federation (R) and South Africa (S) were excluded as they did not report expenditures for 2011 or funding expected for 2012–2013. Together, they account forabout 9% of global drug-susceptible TB cases and 45% of MDR-TB cases receiving treatment.FIGURE 5.11 Funding gaps for TB care and controlas reported by countries, by line item,2006–2013US$ millions (constant 2012 US$)8006004002000-1003225544866025145676597092006 2007 2008 2009 2010 2011 2012 2013OtherACSM/CBC/PPM/PAL/OR/surveysTB/HIVMDR-TBDOTS, excludingfirst-line drugsDOTS, first-linedrugsLine item surplus aaFunding available for a given line item may exceed that required for the sameline item under a country’s plan and budget.TABLE 5.3 Summary of funding requirements for TBcontrol during the period 2011–2015, as set outin the <strong>Global</strong> Plan to Stop TBPLAN COMPONENTTOTAL FUNDING REQUIRED(US$ BILLIONS) [% OF TOTAL]PLAUSIBLERANGEImplementation 36.9 [79%] 36.1–37.7DOTS 22.6 [48%] 22.1–23.2MDR-TB 7.1 [15%] 6.6–7.7TB/HIV 2.8 [6%] 2.7–2.9Laboratory strengthening 4.0 [8%] 3.7–4.2Technical assistance 0.4 [1%]Research and development 9.8 [21%]Fundamental research 2.1 [5%]New diagnostics 1.7 [4%] not estimatedNew drugs 3.7 [8%]New vaccines 1.9 [4%]Operational research 0.4 [1%]All components 46.7 [100%] 45.9–47.5GLOBAL TUBERCULOSIS REPORT 2012 63
FIGURE 5.12 Funding required for DOTS and MDR-TBin the <strong>Global</strong> Plan 2011-2015 comparedwith projections of potential funding fromdomestic sources, for six country groupsUS$ billions (current)BRCS a4.03.02.01.00Other HBCs1.00.80.60.40.20Low-income countries0.80.60.40.20aBrazil, Russian Federation, China and South Africa (BRICS excluding India)bThe seven countries included in this group are Armenia, Georgia, Kyrgyzstan,Republic of Moldova, Tajikistan, Ukraine and Uzbekistan. Of the fundingavailable in 2012, approximately half is accounted for by Ukraine. The countriesin this group continue to hospitalize TB patients for lengthy periods of time,while in the <strong>Global</strong> Plan it was assumed that reliance on inpatient hospital carein the European Region would be progressively reduced between 2006 and 2015to an average of 60 days per patient with drug-susceptible TB by 2015. Thisexplains why the funding amounts estimated to be needed in the <strong>Global</strong> Plan arelower than the funding available in this group of countries.cAssumes that: 1) international donor funding received by BRICS in 2011 issubstituted by domestic sources; and 2) domestic funding for TB care and controlin all low and middle-income countries will keep pace with IMF forecasts ofgrowth in GDP per capita.0.50.40.30.20.100.60.40.200.30.20.10IndiaSeven other low- and middle-incomeEuropean countries with a high burdenof MDR-TB bLow-income countries excluding HBCs2011 2012 2013 2014 2015 2011 2012 2013 2014 2015Funding required for DOTS and MDR−TBFunding required for DOTSFunding required for MDR−TBFunding forecast to be available from domestic sources ctreatment of MDR-TB, for which the funding requirementwas estimated at US$ 1 billion in 2011, rising toUS$ 1.9 billion in 2015. The funding required for collaborativeTB/HIV activities (see Chapter 7) increases to aboutUS$ 1 billion by 2015, mostly (about 90% of the total) forantiretroviral therapy for HIV-positive TB patients thatwould be funded via HIV programmes (not NTPs).The funding requirements set out in the <strong>Global</strong> Planare considerably more than the funding amounts reportedby countries. For example, the funding required in 2015according to the <strong>Global</strong> Plan is about US$ 2 billion morethan the funding reported to be available in 2013. 1 In thiscontext – and with international funding constrainedby economic stagnation or recession in traditional donorcountries – assessing the funding that can be mobilizedfrom domestic sources is of increasing importance.Figure 5.12 shows estimates of the funding required fortreatment of TB and MDR-TB in the <strong>Global</strong> Plan, and forselected groupings of countries defined by their TB burdenand income level. Amounts for collaborative TB/HIVactivities are deliberately excluded because ART, the mainintervention in terms of cost, is not funded through NTPs.It is therefore not appropriate to compare funding needsfor collaborative TB/HIV activities with funding reportedby NTPs. Also shown in Figure 5.12 are projections of thefunding that could be mobilized from domestic sources ineach country group, on the assumption that: (i) internationaldonor funding received by BRICS in 2011 is substitutedby domestic sources; and (ii) domestic allocationsfor TB care and control in all low- and middle-incomecountries will keep pace with IMF forecasts of growth inGDP per capita.The data shown in Figure 5.12 provide insights thatcould inform future discussions about investments in TBcare and control, including prioritization of donor fundingamong countries and interventions and targets forresource mobilization. For example:● There is domestic capacity to fund the investmentsneeded for basic TB care and control (DOTS) in BRICS.● An increase in domestic allocations for TB care andcontrol in line with forecast growth in GDP per capitawould be sufficient to mobilize the funding needed fordiagnosis and treatment of MDR-TB in Brazil, the RussianFederation, China and South Africa (all of whichare upper middle-income countries).● In India, without growth in domestic allocations forTB above forecast growth in GDP per capita, aboutUS$ 0.1 billion per year is needed from donor sources.1This is excluding amounts for TB/HIV that are mostly for ARTfunded through HIV programmes, and allowing for fundingin the 34 countries considered in the <strong>Global</strong> Plan that are notin the group of 115 countries for which data were available for2011 or 2012 (Table 5.1). It is anticipated that most of the fundingfor TB/HIV interventions will need to come from internationaldonors.64 GLOBAL TUBERCULOSIS REPORT 2012
● The 14 countries not included in the list of 22 HBCsbut that are part of the list of the 27 high MDR-TBburden countries are all European countries. Of these14 countries, six are upper middle-income countriesand one is a high-income country (Estonia). Amongthe seven low- and lower middle-income countries,available funding from domestic sources appears to besufficient, although some rationalization in the use ofhospital care may be required.● The 17 HBCs outside BRICS require donor funding ofabout US$ 0.3–0.5 billion per year to reach <strong>Global</strong> Plantargets for implementing DOTS and scaling up diagnosisand treatment for MDR-TB. This amount could belowered if reductions in the price of second-line anti-TB drugs needed for treatment of MDR-TB could beachieved.● Low-income countries require donor funding of aboutUS$ 0.2–0.3 billion per year to reach <strong>Global</strong> Plan targetsfor implementing DOTS and scaling up diagnosisand treatment for MDR-TB, of which US$ 0.1–0.2 billionper year is in countries outside HBCs.In addition to the funding needs for DOTS and MDR-TBset out in the <strong>Global</strong> Plan, additional investments will beneeded for the scale-up of new rapid molecular diagnostics.Further details about these diagnostics are providedin Chapter 6.Overall, these observations suggest that internationaldonor funding of up to US$ 1 billion per year is neededfor diagnosis and treatment of TB and MDR-TB in lowandmiddle-income countries 2013–2015 to close fundinggaps. It is anticipated that most of the funding requiredfor TB/HIV interventions will also need to come frominternational donor sources.GLOBAL TUBERCULOSIS REPORT 2012 65
CHAPTER 6Diagnostics andlaboratory strengtheningKEY FACTS AND MESSAGES Conventional technologies have been constrainingdiagnosis of TB and drug-resistant TB, but the recentavailability of new rapid tests has the potential torevolutionize TB care. The roll-out of Xpert MTB/RIF, a new rapid moleculartest that can diagnose TB and rifampicin-resistantTB within hours, has been impressive. Between itsendorsement by WHO in December 2010 and the end ofJune 2012, 1.1 million test cartridges were procured in67 (46%) of the 145 countries eligible to purchase themat concessional prices. Acceleration in uptake is stillneeded to realize the full potential of the technology. Scaling up use of the Xpert MTB/RIF assay is expectedto be greatly accelerated by a 41% drop in the cartridgeprice from US$ 16.86 to US$ 9.98 announced inAugust 2012. It is essential that expansion in capacityto diagnose drug-resistant TB is closely aligned withexpansion in capacity to provide treatment. Laboratory capacity to conduct sputum smearmicroscopy still requires strengthening: only 15 of the22 high TB burden countries met the target of having1 microscopy centre per 100 000 population in 2011. Substantial strengthening of laboratory capacity todetect DR-TB is needed. Among the 36 countries witha high burden of TB and MDR-TB, 19 did not have therecommended capacity of 1 laboratory to performculture and DST per 5 million population in 2011. The WHO/GLI Supranational Reference Laboratory(SRL) Network has assumed a greater role in globalefforts to strengthen TB laboratories. It now comprises29 laboratories in all WHO regions, with 4 additionalcandidate SRLs under development. WHO has developed more comprehensive policies onthe proper use of TB diagnostics, which now includeguidance on approved tests as well as ‘negative’guidance to dissuade practitioners from using poorlyperforming and/or overly costly tests. Countries shouldtake decisive action to ban poorly-performing andoverly costly tests and introduce WHO-recommendedtechnologies.A high-quality laboratory system that uses modern diagnosticsis a prerequisite for early, rapid and accuratedetection of TB. Of the estimated 8.7 million incidentTB cases in 2011, only 66% were diagnosed and notifiedto national TB control programmes, due in part toinadequate laboratory capacity in many low- and middleincomecountries. Furthermore, of the notified cases ofpulmonary TB, around one-third were not bacteriologicallyconfirmed using a WHO-recommended laboratorymethod, and a proportion of the patients in whom TBwas clinically diagnosed without laboratory confirmationmay not have had TB. These numbers do not capturethe significant delay that many patients experience inreceiving a diagnosis of TB because of poorly functioninglaboratory systems, resulting in delays to the start oftheir treatment, additional suffering and expenses, andadverse treatment outcomes.As described in Chapter 4, diagnosis of drug resistanceremains a particular challenge for laboratory systems inmany low- and middle-income countries. Only 19% ofthe 310 000 cases of multidrug-resistant TB (MDR-TB)estimated to exist among patients with pulmonary TBreceived a laboratory-confirmed diagnosis of their diseaseand were notified in 2011. Rapid and timely detection ofTB cases and strengthened capacity to diagnose cases ofdrug-resistant TB are thus global priorities for TB careand control.This chapter has three parts. The first describes developmentsin WHO’s policies on TB diagnostics during2011–2012; the second provides the status of laboratorycapacity globally, regionally and nationally, focusing on36 countries in the combined list of 22 high TB burdencountries and 27 high MDR-TB burden countries; thethird describes the strengthening of laboratories with afocus on the EXPAND-TB project, the Supranational ReferenceLaboratory Network and laboratory accreditation.6.1 Developments in WHO policieson TB diagnosticsWHO has established a systematic process for the timelyformulation of policy on new TB diagnostics in responseto the active research and development pipeline inrecent years and resultant new tools (see Chapter 8).This dynamic process involves synthesizing the availableevidence through systematic reviews and metaanalyses,assessing the evidence and its expected impact66 GLOBAL TUBERCULOSIS REPORT 2012
on public health by an external Expert Group using therecommended GRADE approach, 1 and preparing policyguidance 2 for dissemination to Member States and otherstakeholders. 3 Policy documents are reviewed every 3–5years, taking into account new evidence.In 2011, WHO issued two ‘negative’policy statements on TB diagnostics:one against the use of commercial,antibody-based serodiagnostic tests todiagnose active TB disease; theother a caution against commercialinterferon-gamma releaseassays (IGRAs) as a public healthintervention to detect latent TBinfection in low- and middleincomesettings.An Expert Group that reviewedthe evidence on use of commercial,antibody-based serodiagnostic tests found that theyprovide inconsistent and imprecise results with highlyvariable values for sensitivity and specificity. No evidencewas found that existing commercial serologicalassays improve outcomes that are important to patients.As a result of this policy, in June 2012 the Governmentof India banned the import, manufacture, distributionand sale of commercial serodiagnostic tests for TB, whichhave been profligately used in the private sector to diagnoseTB. This bold action is expected to greatly reduce thefrequency of false diagnoses of TB and facilitate the introductionof WHO-approved diagnostics into the market.After reviewing the available evidence on commercialIGRAs, an Expert Group concluded that:● there are insufficient data and low-quality evidence onthe performance of IGRAs in low- and middle-incomecountries, typically those with a high burden of TBand/or HIV;● IGRAs and the tuberculin skin test (TST) cannot accuratelypredict the risk of infected individuals developingactive TB disease;● neither IGRAs nor the TST should be used to diagnoseactive TB disease; and● IGRAs are more costly and technically complex to performthan the TST.Given their comparable performance but increased cost,replacing the TST with IGRAs as a public health interventionin resource-constrained settings is not recommended.These guidelines are not intended to apply tohigh-income countries or to supersede their nationalguidelines.In 2012, Expert Groups were convened to review theavailable evidence on two commercially available diagnostictests: a manual assay using the loop-mediatedisothermal amplification (LAMP) platform to detect TBDNA in sputum specimens (TB-LAMP ® , Eiken ChemicalCo. Ltd., Japan), and a line probe assay for detectingresistance to second-line anti-TB drugs (GenoType ®MTBDRsl, Hain Lifescience, Germany).The Expert Group reviewing the TB-LAMP assay concludedthat there was insufficient evidence to proceedwith the development of policy guidance.For Genotype MTBDRsl, the Expert Group found thatwhile the test’s specificity for detecting resistance to fluoroquinolonesand second-line injectables was high, itssensitivity was suboptimal. Therefore, while the test hasthe potential to be used as a rule-in test for XDR-TB wherecapacity to use line probe assays is available, it cannot beused as a replacement test for conventional phenotypicdrug susceptibility testing (DST). The Expert Group alsonoted that there is incomplete cross-resistance betweenthe second-line injectables, and that the assay does notallow for specific resistance to individual second-lineinjectables to be determined. Detailed conclusions of theExpert Group meetings will be described in reports to bepublished on the website. 46.2 Status of laboratory capacity globally,regionally and nationallyDespite the development in recent years of more sensitivetechnologies, diagnosis of TB in most low- and middle-incomecountries continues to rely on sputum smearmicroscopy. Maintaining a high level of quality to performsmear microscopy is therefore critical. Of the 144low- and middle-income countries and territories reportingon numbers of smear microscopy laboratories, only42% indicated the existence of an external quality assessmentprogramme that encompassed all smear laboratoriesin the country.While globally the target of 1 microscopy centre per100 000 population has been reached, considerable disparitiesremain at regional and country levels (Table 6.1).The Western Pacific and Eastern Mediterranean regionshad only 0.5 and 0.8 centres per 100 000 population in2011, respectively, and 7 of the 22 high TB burden countriesalso failed to meet the target.In 2009, WHO recommended the use of the more sensitivefluorescent light-emitting diode (LED) microscopyinstead of traditional Ziehl–Neelsen (ZN) microscopy.Roll-out, however, has been slow. As of 2011, only 2% ofmicroscopy laboratories globally were using LED microscopes,with little variability between regions and no highTB burden country reporting more than 10% absorption.The current target for both culture and DST capacityis 1 laboratory per 5 million population; this target was1www.gradeworkinggroup.org2WHO handbook for guideline development. Geneva, World HealthOrganization, 2012.3WHO policies on TB diagnostics are available at:www.who.int/tb/laboratory/policy_statements4www.who.int/tb/laboratory/policy_statementsGLOBAL TUBERCULOSIS REPORT 2012 67
TABLE 6.1 Laboratory capacity, 2011 aSMEAR MICROSCOPYCULTUREDRUG SUSCEPTIBILITYTESTINGLINE PROBE ASSAYXPERTMTB/RIFYES NO HIGH TBBURDENHIGHMDR-TBBURDENNUMBEROF LABO-RATORIESLABORATORIESPER 100 000POPULATIONPERCENTAGE OFLABORATORIESUSING LEDMICROSCOPESNUMBEROFLABORA-TORIESLABORA-TORIES PER5 MILLIONPOPULATIONNUMBEROF LABO-RATORIESLABORA-TORIES PER5 MILLIONPOPULATIONNUMBEROFLABORA-TORIESAfghanistan 600 1.9 2 3 0.5 — —LABORA-TORIES PER5 MILLIONPOPULATIONArmenia 30 1.0 0 1 1.6 1 1.6 1 1.6 0Azerbaijan — — — — —Bangladesh 1 057 0.7 1 3
evised as a result of the introduction of new technologiesin which culture and DST are invariably performedtogether. In 2011, 19 of the 36 countries in the combinedlist of 22 high TB burden countries and 27 high MDR-TB burden countries did not reach the target (Table 6.1).Of these 36 countries, 9 reported more than 1 laboratoryper 5 million population using line probe assays – a highthroughputtool used at central and regional levels to rapidlydetect resistance to rifampicin and, in some cases,isoniazid. These numbers are changing quickly, as laboratorystrengthening efforts including EXPAND-TB (seeSection 6.3) come to fruition.Quality-assured DST is critical to ensure accuratedetection of drug resistance for subsequent treatmentdecisions and to avoid false diagnoses. External qualityassessment schemes for DST appear to be comprehensivelyinstalled more commonly than those for microscopy.While 42% of countries claim to have a comprehensivescheme for microscopy (as stated above), 71% of the 115low- and middle-income countries and territories indicatingcapacity for DST reported an external quality assessmentscheme encompassing all DST laboratories.The target for culture and DST capacity of 1 laboratoryper 5 million population is likely to be reviseddownwards in future following the introduction of theWHO-recommended automated nucleic amplificationassay Xpert ® MTB/RIF (Cepheid, Sunnyvale, CA, USA).Xpert MTB/RIF technology (see Box 6.1) can detectrifampicin resistance-conferring mutations, has sensitivityfor TB detection equivalent to that of solid culture, andcompared with culture methods it can be used at lowerlevels of the laboratory network. Importantly, however,culture will remain essential for testing of susceptibilityto drugs other than rifampicin, and is currently the onlytool available for monitoring the response to treatment ofthe growing number of patients being treated for MDR-TB. Ongoing evaluation of evidence on the use of XpertMTB/RIF and its impact on the workload of other laboratorydiagnostics, including microscopy, culture and DST,will allow for refinement of the current targets.While a number of countries report suboptimal capacityto detect TB and drug resistance, patients in manyparts of the world still access laboratory testing by seekingcare in the private sector. The quality of diagnosticservices in this sector is highly variable, and some privatepractitioners continue to use diagnostic tests thatare not recommended by WHO. In addition, in some settingslaboratories in the public sector that are not underthe auspices of the national TB control programme alsodiagnose TB without necessarily following recommendedguidelines and quality assurance procedures. Collaborationbetween national TB control programmes and alllaboratories offering TB diagnosis is therefore critical toensure that national guidelines are followed, that appropriatediagnostic tests are used, and that patients diagnosedwith TB are notified to the national TB controlprogramme and receive proper care. In 2011, 15 of 36high burden countries reported some level of collaborationwith laboratories in the private sector; 17 reportedcollaboration with laboratories in the public sector.6.3 Strengthening TB laboratories globally,regionally and nationallyOne of the main prerequisites for strengthening TB laboratorycapacity in countries is dynamic policy reform,adapting WHO guidelines on TB diagnostics into nationalTB control programme guidelines. Table 6.2 presentsthe uptake of selected WHO policy guidance at global,regional and country levels, focusing on the 36 countriesin the combined list of 22 high TB burden countries and27 high MDR-TB burden countries.All reporting high MDR-TB burden countries and 85%of reporting countries globally had incorporated intotheir national guidelines the WHO policy guidance onconventional phenotypic DST by 2011. Countries in theAfrican Region have the lowest uptake (69%).Incorporation of policy guidance on liquid cultureis highly variable, ranging from as low as 45% in theEastern Mediterranean Region to 84% in the EuropeanRegion. <strong>Global</strong>ly, uptake of policy on line probe assays isrelatively low (44%) for all countries; only 17% of countriesin the Region of the Americas reported incorporationof the guidance in their national guidelines.Although recommended by WHO only in December2010, WHO’s policy guidance on Xpert MTB/RIF hasbeen incorporated into national guidelines by one third(33%) of reporting countries; two thirds (64%) of thehigh TB burden countries and half (50%) of the highMDR-TB burden countries have already incorporated theassay in their revised diagnostic policies.The EXPAND-TB project is a global initiative of multiplepartners that aims to strengthen laboratory capacityfor detecting drug-resistant TB and establish rapid diagnosticsin 27 countries. Launched in 2008, the project isa collaboration among WHO, the <strong>Global</strong> Laboratory Initiative(GLI), FIND and the <strong>Global</strong> Drug Facility, fundedby UNITAID and other partners. As shown in Figure 6.1,the participating countries are at various stages of projectimplementation: 17 were in the final phase of routinetesting and monitoring as of July 2012, compared with6 in July 2011. Given the time required to establish thenecessary infrastructure for central level laboratoriescapable of using liquid culture and line probe assays, theEXPAND-TB project is now coming to fruition in the routinedetection and reporting of drug-resistant TB cases.Several of the countries participating in the project havereported considerable increases in the numbers of drugresistantcases during recent years (Figure 6.2).The WHO/GLI TB Supranational Reference Laboratory(SRL) Network is another driving force in strengtheningGLOBAL TUBERCULOSIS REPORT 2012 69
BOX 6.1Rolling out Xpert MTB/RIF globallyIn December 2010, WHO recommended use of the Xpert ® MTB/RIF (Cepheid, Sunnyvale, CA, USA) assay for the rapid and simultaneousdetection of TB and rifampicin resistance using the GeneXpert platform. The test entails fewer biosafety and human resource requirements thanconventional culture or DST. Furthermore, its sensitivity for detecting TB is signifi cantly higher than that of microscopy, particularly in patientswith HIV infection.By the end of June 2012, Xpert MTB/RIF had been rolled out in 67 of the 145 countries eligible to purchase instruments and cartridges atconcessional prices. 1.1 million test cartridges and 3602 GeneXpert instrument modules had been procured, with technical and fi nancialassistance from many partners and donors. South Africa has led the adoption of the technology and intends to use it countrywide as areplacement for microscopy for the diagnosis of TB; as of June 2012, the country accounted for 37% of the modules and 53% of the cartridgesprocured globally. The most up-to-date data on procurement and country-specifi c site locations and plans, together with WHO guidancedocuments on use of the test, are available on a dedicated WHO website. 1To gain evidence on Xpert MTB/RIF for the refi nement of its global policy guidance, WHO has been systematically collecting data from earlyimplementers of Xpert MTB/RIF on the tests conducted and algorithms used, the effects of introducing the technology on laboratory workload,and operational and logistic challenges encountered. 2 As of July 2012, 31 sites in 12 countries had contributed data. Systematic collection ofcomplementary laboratory and patient indicators is also underway by partners including TBCARE I, TB REACH, the South Africa National HealthLaboratory Services and Médecins Sans Frontières. Operational research projects, including those inventoried by the TREAT-TB initiative, 3 areexpected to yield further critical information on the impact and cost effectiveness of Xpert MTB/RIF in various diagnostic algorithms.Scaling up use of the Xpert MTB/RIF assay globally is expected to be greatly accelerated by a drop in the price per test from US$ 16.86 toUS$ 9.98, following execution of a novel fi nancing agreement between the manufacturer (Cepheid) and the Bill & Melinda Gates Foundation,the United States Agency for International Development (USAID), the United States President’s Emergency Plan for AIDS Relief (PEPFAR)and UNITAID in August 2012. The catalytic effect of the price reduction on such global scale-up will be complemented by a US$ 25.9 milliongrant from UNITAID to WHO’s Stop TB Department and the Stop TB Partnership. The new three-year TBXpert project will provide the XpertMTB/RIF technology to 21 recipient countries by linking a broad network of implementing partners with existing initiatives for TB laboratorystrengthening, using innovative approaches to expand access to vulnerable populations in the public and private sectors.FIGURE B6.1.1Progress in the roll-out of Xpert MTB/RIF, by July 2012GeneXpertmodules ordered01–45–2425–4950–99≥ 100Not eligible for preferential pricingNot applicable1www.who.int/tb/laboratory/mtbrifrollout2More detail on this initiative can be found at: www.who.int/tb/features_archive/xpert_use_web/3http://xrmt.treattb.org/70 WHO REPORT 2012 GLOBAL TUBERCULOSIS CONTROL
TABLE 6.2 Incorporation of WHO policy guidance for diagnosis of TB, 2011 aYES NO HIGH TBBURDENHIGH MDR-TBBURDENCONVENTIONAL DRUGSUSCEPTIBILITY TESTING(DST)LIQUID CULTUREAND RAPID SPECIATIONTESTLINE-PROBE ASSAY FORDETECTING RESISTANCETO RIFAMPICINALGORITHM FOR THEDIAGNOSIS OF TB INPEOPLE LIVING WITH HIVAfghanistan Armenia Azerbaijan Bangladesh Belarus Brazil Bulgaria Cambodia China DR Congo Estonia Ethiopia Georgia India Indonesia Kazakhstan Kenya Kyrgyzstan Latvia Lithuania Mozambique Myanmar Nigeria Pakistan Philippines Republic of Moldova Russian Federation South Africa Tajikistan Thailand Uganda Ukraine UR Tanzania Uzbekistan Viet Nam Zimbabwe High-burden countries 95% 73% 64% 86% 64%High MDR-TB burden countries 100% 75% 74% 87% 50%AFR 69% 69% 43% 76% 32%AMR 96% 61% 17% 78% 13%EMR 86% 45% 40% 52% 45%EUR 100% 84% 63% 75% 32%SEAR 90% 50% 40% 80% 40%WPR 78% 72% 56% 82% 44%<strong>Global</strong> 85% 67% 44% 74% 33%XPERT MTB/RIF ASSAYBlank cells indicate data not reported.aThe regional and global fi gures are aggregates of data reported by low- and middle-income countries and territories. Data for the variables shown in the table are notrequested from high-income countries in the WHO data collection form.GLOBAL TUBERCULOSIS REPORT 2012 71
FIGURE 6.1Laboratorypreparedness• Laboratoryassessment• Memorandum ofunderstanding• Infrastructureupgrade• Creation of SOPs• Policy reform18–24 months• Indonesia• Kazakhstan• Peru• RwandaFIGURE 6.2Percentage increase (index year = 2008)1400120010008006004002000The EXPAND-TB project – progress byJuly 2012Technologytransfer6–12 months• Bangladesh• Belarus• Mozambique• Senegal• Tajikistan• Viet Nam• Equipmentand supplies• Procurement• Training• Quality assurance• LaboratoryvalidationRoutine testingand monitoring• Monitoringand evaluation• Impactassessment• MarketdynamicsUp to year 5• Azerbaijan • Kyrgyzstan• Cameroon • Lesotho• Côte d’Ivoire • Myanmar• Djibouti • Republic of• Ethiopia Moldova• Georgia • Swaziland• Haiti • Uganda• India • UR Tanzania• Kenya • UzbekistanIncrease in cases of MDR-TB reported byselected countries participating in theEXPAND-TB project, 2008–20112008 2009 2010 2011India (2008 = 308 cases; 2011 = 4237 cases)Uzbekistan (2008 = 342 cases; 2011 = 1385 cases)Cameroon a (2009 = 26 cases; 2011 = 63 cases)Haiti b (2008 = 43 cases; 2011 = 86 cases)laboratories globally. Created in 1994 to provide qualityassuredDST within the framework of the <strong>Global</strong> Projecton Anti-TB Drug Resistance Surveillance, the networktoday plays a more comprehensive role in strengtheninglaboratory capacity in partner countries. Its terms of referencewere revised in 2009 and, with increased fundingvia the US President’s Emergency Plan for AIDS Relief(PEPFAR) and other sources, SRLs have been able toformalize their relationships with partner countries andincrease the scope of their activities. The network hasgrown in size and comprises 29 laboratories in all regions(Figure 6.3). Additionally, 4 candidate SRLs are undermentorship, including the national TB reference laboratoriesof Benin, Denmark and Uganda, and the Aga KhanUniversity of Pakistan. Pending completion of successfulmentorship and the establishment of country partners,these new laboratories will help widen the geographicalreach of the network, in particular in the African andEastern Mediterranean regions.Implementing quality management systems in TBlaboratories, especially in resource-constrained settings,has been a particular focus of laboratory strengtheningefforts during 2011–2012. In 2011, the GLI StepwiseProcess toward TB Laboratory Accreditation tool waslaunched, 1 led by the Union, the United States Centers forDisease Control and Prevention, the Royal Tropical Institutein the Netherlands and WHO. The GLI tool providesboth guidance and an incentive for improving laboratoryquality towards meeting requirements for internationalstandards of accreditation. The <strong>Global</strong> Plan includes atarget that more than half of all national TB referencelaboratories should have implemented a quality managementsystem by 2015. In 2012, field testing of the tool wasstarted in Uganda and Benin; further uptake is expectedin 2012–201 3.aIndex year for Cameroon is 2009, as data were not reported for 2008.bData were not reported for Haiti for 2009.1www.gliquality.org72 GLOBAL TUBERCULOSIS REPORT 2012
FIGURE 6.3The Supranational Reference Laboratory NetworkMassachusetts, USAAtlanta, USAMexico City, MexicoBilthoven, NetherlandsAntwerp, BelgiumLondon, UKGauting, GermanyMilan, ItalyPorto, PortugalBarcelona, SpainLe Hamma, AlgeriaCopenhagen, DenmarkStockholm, SwedenRiga, LatviaBorstel, GermanyPrague, Czech RepublicZagreb, CroatiaRome, ItalyCairo, EgyptSeoul, Republic of Korea Tokyo, JapanKarachi, PakistanHong Kong, China SARGuadeloupe, FranceCotonou, BeninChennai, IndiaKampala, UgandaBangkok, ThailandSantiago, ChileBuenos Aires, ArgentinaPretoria, South AfricaAdelaide, AustraliaBrisbane, AustraliaSupranational Reference LaboratorySupranational Reference Laboratory Coordinating CenterCandidate Supranational Reference LaboratoryGLOBAL TUBERCULOSIS REPORT 2012 73
CHAPTER 7Addressing the co-epidemicsof TB and HIVKEY FACTS AND MESSAGES In 2011, 1.1 million (13%) of the 8.7 million people whodeveloped TB worldwide were HIV-positive; 79% ofthese HIV-positive TB cases were in the African Region. WHO’s recommended package of collaborative TB/HIV activities to reduce the burden of TB/HIV includesHIV testing for TB patients; CPT and early initiation ofART for HIV-positive TB patients; and screening for TBamong people living with HIV and provision of IPT tothose eligible for it. Substantial progress in the implementation ofcollaborative TB/HIV activities has occurred since WHOrecommendations were fi rst issued in 2004, and furtherprogress was evident in 2011. The percentage of notifi ed TB patients with adocumented HIV test result in the African Region rosefrom 60% in 2010 to 69% in 2011; 46% of thosetested in 2011 were HIV-positive, ranging from 8% inEthiopia to 77% in Swaziland. Worldwide, 40% of TBpatients notifi ed in 2011 had a documented HIV testresult, up from 33% in 2010 and more than ten timesthe level of 2004. In 2011, 79% of TB patients known to be HIV-positive,were provided with CPT, and 48% were started onART, similar to levels achieved in 2010. More workremains to be done to ensure that all HIV-positive TBpatients are rapidly started on ART, in line with WHOrecommendations. Their progress on treatment shouldalso be closely monitored. In 2011, 3.2 million people enrolled in HIV care werereported to have been screened for TB, up 39% from2.3 million in 2010. Of those without active TB disease,0.45 million were provided with IPT, more than doublethe number started on IPT in 2010 (mostly the result ofprogress in South Africa). The scale-up of collaborative TB/HIV activities saved atotal of 1.3 million lives between 2005 and the end of2011.People living with HIV who are also infected with TB aremuch more likely to develop TB disease than those whoare HIV-negative. 1 Starting in the 1980s, the HIV epidemicled to a major upsurge in TB cases and TB mortality inmany countries, which persisted throughout the 1990sand up to around 2004, especially in southern and eastAfrica (Chapter 2, Chapter 3).In 2011, 1.1 million (13%) of the 8.7 million peoplewho developed TB worldwide were HIV-positive (Chapter2, Table 2.1); 79% of these HIV-positive TB cases werein the African Region. <strong>Global</strong>ly, there were an estimated0.4 million HIV-associated TB deaths in 2011, withapproximately equal numbers among men and women(see Chapter 2). WHO, UNAIDS and the Stop TB Partnershiphave set a target of halving TB mortality ratesamong people who are HIV-positive by 2015 comparedwith 2004 (the year in which TB mortality among HIVpositivepeople is estimated to have peaked). 2WHO recommendations on the interventions neededto prevent, diagnose and treat TB in people living withHIV have been available since 2004, 3,4 and are collectivelyknown as collaborative TB/HIV activities. They includetesting TB patients for HIV, providing antiretroviral therapy(ART) and co-trimoxazole preventive therapy (CPT)to TB patients living with HIV, providing HIV preventionservices for TB patients, intensifying TB case-findingamong people living with HIV, offering isoniazid preventivetherapy (IPT) to people living with HIV who do nothave active TB, and controlling the spread of TB infectionin health-care and congregate settings (the latter threeactivities are referred to as the “Three Is for HIV/TB”).Antiretroviral therapy significantly reduces the risk ofmorbidity and mortality from TB. A meta-analysis publishedin 2012 found that ART reduces the individual risk1The probability of developing TB among people living withHIV divided by the probability of developing TB among HIVnegativepeople is the incidence rate ratio (IRR). The medianvalue of the IRR in 155 countries for which data were availablein 2011 was 14 (inter-quartile range 12–20).2Getting to zero: 2011–2015 strategy. Geneva, Joint United NationsProgramme on HIV/AIDS, 2010.3Policy on collaborative TB/HIV activities. Geneva, World HealthOrganization, 2004 (WHO/HTM/TB/2004.330; WHO/HTM/HIV/2004.1).4WHO policy on collaborative TB/HIV activities: guidelines for nationalprogrammes and other stakeholders. Geneva, 2012 (WHO/HTM/TB/2012.1).74 GLOBAL TUBERCULOSIS REPORT 2012
of TB disease by 65%, irrespective of CD4 cell-count. 1IPT and ART given together can have an additive effectand substantially reduce the risk of developing active TBdisease among people living with HIV. This evidence isthe reason why updated WHO policy guidance on collaborativeTB/HIV activities (issued in 2012) includes earlierinitiation of ART along with the Three Is for HIV/TB askey interventions to prevent TB among people living withHIV. 2 ART is recommended for all TB patients living withHIV, irrespective of their CD4 cell-count.Testing TB patients for HIV and providing CPT to TBpatients living with HIV are typically the responsibilityof national TB control programmes (NTPs). National HIVprogrammes are usually responsible for initiating intensifiedcase-finding for TB among people living with HIV aswell as providing IPT to those without active TB. Provisionof ART to TB patients living with HIV has often beenthe responsibility of national HIV programmes, but canalso be done by NTPs, especially to facilitate better accessto care. When NTPs do not provide ART directly, they areresponsible for referring TB patients living with HIV toART services.WHO began monitoring the implementation andexpansion of collaborative TB/HIV activities in 2004.This chapter presents the latest status of progress, usingdata for 2004 up to 2011. 37.1 HIV testing for TB patientsIn 2011, the number of notified TB patients who had adocumented HIV test result reached 2.5 million (Figure7.1), equivalent to 40% of notified TB cases (Table 7.1, Figure7.2); this was an increase from 2.1 million and 33%respectively in 2010, and more than 10 times the level of3.1% reported in 2004 (Figure 7.2).The coverage of HIV testing for TB patients was particularlyhigh in the African Region, where 69% of TBpatients had a documented HIV test result in 2011, upfrom 60% in 2010. Impressively, in 28/46 African countries,75% of TB patients had a documented HIV testresult in 2011 (Figure 7.3), up from 22 countries in 2010.In Kenya, Rwanda, Mozambique, Swaziland, Togo, theUnited Republic of Tanzania, Zambia and Zimbabwe,1Suthar AB et al. Antiretroviral Therapy for Prevention of<strong>Tuberculosis</strong> in Adults with HIV: A Systematic Reviewand Meta-Analysis. PLoS Medicine, 2012, 9(7): e1001270.(doi:10.1371/journal.pmed.1001270).2WHO policy on collaborative TB/HIV activities: guidelines for nationalprogrammes and other stakeholders. Geneva, 2012 (WHO/HTM/TB/2012.1).3This chapter does not discuss infection control or servicesaimed at preventing HIV among TB patients. Data for infectioncontrol are limited for most countries, but available datacan be accessed at www.who.int/tb/data. Data on HIV preventionservices for TB patients are collected by WHO’s HIVdepartment and UNAIDS as part of their joint monitoring ofprogress towards universal access and the global response toAIDS.FIGURE 7.1TB patients (thousands)25002000150010005000FIGURE 7.2Percentage of TB patients706050403020100Number of TB patients with knownHIV status, 2004–2011HIV statusPositiveNegative2004 2005 2006 2007 2008 2009 2010 2011Percentage of TB patients with knownHIV status, 2004–2011African region<strong>Global</strong>Regions outside Africa2004 2005 2006 2007 2008 2009 2010 2011>85% of TB patients had a documented HIV result (Table7.1). <strong>Global</strong>ly, there were 80 countries in which 75% ofTB patients had a documented HIV test result.Outside the African Region, in 2011 the percentageof TB patients who had a documented HIV test resultexceeded 50% in the European Region and the Regionof the Americas (mostly influenced by the numbers of TBpatients with a documented HIV test result in the RussianFederation and Brazil, respectively). In other regions, thepercentage ranged from 11% in the Eastern MediterraneanRegion to 32% in the South-East Asia Region. Inthe 41 high TB/HIV burden countries identified as prioritiesfor TB/HIV at the global level in 2002 (listed in Table7.1), overall 45% of TB patients notified in 2011 had adocumented HIV test result; levels of HIV testing wereespecially low in Indonesia and Myanmar (Table 7.1).The highest rates of HIV coinfection were reported forTB patients in the African Region (Table 7.1), where 46%of those with an HIV test result were HIV-positive (comparedwith 44% in 2010). The percentage of TB patientsfound to be HIV-positive in the 28 African countries inthe list of 41 priority countries ranged from 8% in Ethiopiato 77% in Swaziland. Besides Swaziland, 50% ofthe TB patients with an HIV test result were HIV-positivein Botswana, Lesotho, Malawi, Mozambique, Namibia,South Africa, Uganda, Zambia and Zimbabwe.GLOBAL TUBERCULOSIS REPORT 2012 75
TABLE 7.1 HIV testing, treatment for HIV-positive TB patients and prevention of TB among people living with HIV,41 high TB/HIV burden countries and WHO regions, 2011. Numbers in thousands except where indicated.ESTIMATED HIV-POSTIVE INCIDENTTB CASESBEST LOW HIGHNUMBEROF TBPATIENTSWITH KNOWNHIV STATUS% OFNOTIFIEDTB PATIENTSTESTEDFOR HIV% OFTESTED TBPATIENTS HIV-POSITIVE% OFIDENTIFIEDHIV-POSITIVETB PATIENTSSTARTED ONCPT% OFIDENTIFIEDHIV-POSITIVETB PATIENTSSTARTED ONARTAngola 8.5 6.2 11 5.1 10 19 80 80NUMBER OFHIV- POSITIVEPEOPLESCREENEDFOR TBBotswana 5.9 5.3 6.6 5.4 80 64 82 45 0.2Brazil 16 13 19 49 58 20 92Burkina Faso 1.6 1.4 1.9 4.6 82 17 94 3.6Burundi 2.6 2.2 2.9 4.8 71 22 95 48 0NUMBER OFHIV- POSITIVEPEOPLEPROVIDEDWITH IPTCambodia 3.1 2.6 3.6 33 82 5.1 88 79 4.7 1.3Cameroon 19 15 22 20 81 38 1.4Central African Republic 7.1 5.7 8.7 1.9 33 39 12 9.3 0.6Chad 5.2 4.1 6.4 4.1 38 23China 13 8.6 17 209 23 2.3 36Congo 4.9 3.9 6.1 2.2 20 31 24 26 2.8Côte d’Ivoire 10 8.7 12 18 80 26 80 36Djibouti 0.6 0.5 0.7 1.3 34 14DR Congo 34 27 41 31 27 16 54 23Ethiopia 38 28 49 65 41 8.4 62 39 174 31Ghana 4.6 4.0 5.2 13 79 23 71 28Haiti 4.3 3.6 5.2 10 73 19 12 17India 94 72 120 689 45 6.5 91 59 386Indonesia 15 11 20 3.5 1.1 36 92 42Kenya 47 45 49 97 93 39 97 64Lesotho 11 9.2 12 10 82 76 90 40Malawi 18 16 19 17 83 60 89 60 297Mali 1.5 1.3 1.7 2.0 35 21 72 69 29Mozambique 83 58 110 42 88 63 91 29 17Myanmar 18 15 22 4.5 3.1 20 100 80 12 0.4Namibia 8.4 6.6 10 10 84 50 98 54 13 14Nigeria 50 23 86 76 81 26 68 43 224 1.0Russian Federation 9.3 7.3 11 79 aRwanda 2.9 2.6 3.3 6.6 97 28 97 80Sierra Leone 3.8 3.1 4.6 10 78 8.9 25 28 4.0South Africa 330 270 390 323 83 65 76 44 1 256 373Sudan 2.8 2.1 3.6 3.1 15 9.5 0 100Swaziland 12 10 15 8.4 92 77 95 51 58Thailand 13 10 15 50 74 15 75 59 41Togo 1.0 0.8 1.2 3.0 100 22Uganda 35 28 42 39 80 53 93 32 553Ukraine 8.1 6.7 9.6 29 72 20 44UR Tanzania 30 28 32 54 88 38 95 38 148Viet Nam 14 11 18 59 59 8.0 72 48Zambia 38 35 42 42 86 64 87 53Zimbabwe 46 36 58 35 86 60 29 67High TB/HIV burden countries 1 100 990 1 100 2 170 45 25 80 48 3 208 439AFR 870 800 950 1 002 69 46 79 46 2 770 438AMR 37 34 40 124 53 17 43 64 2.7 1.7EMR 8.7 7.6 9.9 45 11 4.0 59 48 1.0 0.1EUR 23 20 25 187 52 6.5 64 47 9.2 4.6SEAR 140 120 170 750 32 7.2 89 59 440 0.4WPR 36 31 42 352 25 3.9 71 47 11 1.8<strong>Global</strong> 1 100 1 000 1 200 2 460 40 23 79 48 3 234 446Blank cells indicate data not reported.aThis number is for new TB patients only. It was not possible to calculate the percentage of all TB patients with known HIV status.76 GLOBAL TUBERCULOSIS REPORT 2012
FIGURE 7.3Percentage of TB patients with known HIV status by country, 2011 aPercentage of notifiedTB cases with knownHIV status0–1415–4950–74≥ 75No dataNot applicableaData for the Russian Federation are for new TB patients only.In the Region of the Americas, the percentage of TBpatients with a documented HIV test result who wereHIV-positive was 17%. In the Eastern Mediterranean,European, South-East Asia and Western Pacific regions,less than 10% of TB patients with a documented HIV testresult were HIV-positive. The global average across allregions was 23%, and 25% among the 41 high TB/HIVburden countries.7.2 Co-trimoxazole preventive therapy andantiretroviral therapy for TB patientsliving with HIV<strong>Global</strong>ly, the number of TB patients living with HIV whowere enrolled on CPT increased to 0.41 million in 2011,up from a negligible number in 2004 and 0.37 million in2010 (Figure 7.4). The coverage of CPT among TB patientswith a documented HIV-positive test result was 79% in2011 (Table 7.1, Figure 7.5). Further progress is needed toreach the target of 100% that is included in the <strong>Global</strong>Plan to Stop TB, 2011–2015 1 (see Chapter 1). The Africanand South-East Asia regions achieved particularly highlevels of enrolment on CPT: 79% and 89% of TB patientsknown to be living with HIV, respectively (Table 7.1).Countries that achieved rates of enrolment on CPT of>90% in 2011 included Burkina Faso, Burundi, India,Indonesia, Kenya, Lesotho Mozambique, Myanmar,Namibia, Rwanda, Swaziland, Uganda and the UnitedRepublic of Tanzania.The number of HIV-positive TB patients on ART hasFIGURE 7.4Number of TB patients (thousands)6005004003002001000Number of HIV-positive TB patients enrolledon co-trimoxazole preventive therapy (CPT)and antiretroviral therapy (ART), 2004–2011Tested HIV-positive2004 2005 2006 2007 2008 2009 2010 2011grown from a very low level in 2004 (Figure 7.4) to reach258 000 in 2011. Among TB patients notified in 2011 2and who had a documented HIV-positive test result,48% were on ART globally in 2011 (Table 7.1, Figure 7.5),a small improvement from 46% in 2010. In the AfricanRegion, 46% of the TB patients notified in 2011 who hada documented HIV-positive test result were on ART in1The <strong>Global</strong> Plan to Stop TB, 2011–2015. Geneva, World HealthOrganization, 2010 (WHO/HTM/STB/2010.2).2In the annual WHO TB data collection form, countries areasked to report the number of TB patients notified in themost recent calendar year who were living with HIV and who“started or continued on ART”.CPTARTGLOBAL TUBERCULOSIS REPORT 2012 77
FIGURE 7.5Percentage of TB patients with known HIV status who were HIV positive, and percentage of HIV-positive TBpatients enrolled on co-trimoxazole preventive therapy (CPT) and antiretroviral therapy (ART), 2006–2011 a100% of TB patients with known HIV statuswho are HIV-positive% of HIV-positive patients on CPT % of HIV-positive patients on ART80Percentage of TB patients60402002006 2007 2008 2009 2010 2011 2006 2007 2008 2009 2010 2011 2006 2007 2008 2009 2010 2011aThe solid lines show values for countries that reported data. The shaded areas show upper and lower limits when countries that did not report data are considered.FIGURE 7.6 Percentage of HIV-positive TB patients enrolled on antiretroviral therapy (ART), 2011Percentage ofHIV-positiveTB cases on ART0–2425–4950–7475–100No dataNot applicable2011 (up from 44% in 2010). Among the 41 high TB/HIVburden countries, 15 reported enrolling more than 50%of notified TB patients known to be living with HIV onART in 2011 (Table 7.1, Figure 7.6).Given WHO’s recommendation that all HIV-positiveTB patients are eligible for ART irrespective of their CD4cell-count and the <strong>Global</strong> Plan’s target of providing ARTto all TB patients known to be living with HIV by 2015(Chapter 1), the coverage of ART for HIV-positive TBpatients needs to be improved. This could be facilitated byusing TB services and infrastructure to allow decentralizationof care delivery according to national guidelinesand the local context (Box 7.1).7.3 Intensifying case-finding andisoniazid preventive therapy amongpeople living with HIVUntil 2010, data on intensified screening for TB amongpeople living with HIV and provision of IPT to thosewithout active TB were requested from NTPs as part of78 GLOBAL TUBERCULOSIS REPORT 2012
BOX 7.1Accelerating progress in providing ART to TB patients living with HIVPeople with HIV-associated TB have a high risk of mortality. For example, in autopsy studies of people who were HIV-positive, TB wasidentifi ed in 30–79%. 1,2 Expanding access to ART will have a signifi cant impact on mortality among HIV-positive TB patients, in additionto reducing the risk of developing TB among people living with HIV who do not have active TB.Since 2010, WHO has recommended ART for TB patients regardless of CD4 cell-count. Furthermore, the optimum time to start ART inpatients with HIV-associated TB has now been established in three large randomized controlled trials. 3,4,5 These studies collectivelyshowed that ART should be given concurrently with TB treatment regardless of CD4 cell-count. The risk of AIDS and death in those withprofound immunosuppression (CD4 cell-count
FIGURE 7.7Number of people screened (millions)43210FIGURE 7.8Number of HIV-positive people without active TB(thousands)5004003002001000FIGURE 7.9Number of lives saved (millions)0.50.40.30.20.1Intensified TB case-finding among peopleliving with HIV, 2005–20112005 2006 2007 2008 2009 2010 2011Provision of isoniazid preventive therapy(IPT) to people living with HIV withoutactive TB, 2005–20112005 2006 2007 2008 2009 2010 2011Estimated number of lives saved globally bythe implementation of TB/HIV interventions,2005–2011. The blue band represents theuncertainty interval.2005 2006 2007 2008 2009 2010 2011compared with 2.3 million in 71 countries in 2010 (Figure7.7). Unfortunately, at the time this report went to press,the total number of people enrolled in HIV care in 2011was not available (the figure was 4.0 million in 2010).Nonetheless, it is clear that further progress is needed toapproach the target in the <strong>Global</strong> Plan, which is to screenall those enrolled in HIV care for TB by 2015.Among 29 countries that reported data, IPT was providedto almost 450 000 people living with HIV in 2011,more than double the 201 000 people provided with IPT in2010 (Figure 7.8). Most of the increase occurred in SouthAfrica, where 373 000 people were reported to have beenprovided with IPT in 2011, followed by Ethiopia (31 000),Mozambique (17 000) and Namibia (14 000). Unfortunately,at the time this report went to press, the totalnumber of people newly enrolled in HIV care in 2011 andpotentially eligible for IPT was not available (the figurewas 1.5 million in 2010). However, as with TB screeningamong people in HIV care, it is clear that further effortsare needed to reach the <strong>Global</strong> Plan’s 2015 target of providingIPT to all those eligible for it – estimated at approximately50% of those newly enrolled in HIV care.7.4 Lives saved by the implementationof collaborative TB/HIV activities,2005–2011In the years between the publication of WHO’s first policyon collaborative TB/HIV activities in 2004 and updatedguidance launched in 2012, 1,2 considerable progress inimplementing the recommended package of interventionsoccurred, as documented in Section 7.1, Section 7.2and Section 7.3. At the time that updated guidance waspublished in March 2012, the lives saved as a result ofthe implementation of collaborative TB/HIV activitiesbetween 2005 and 2010 were estimated. Here, the analysisis extended to 2011 and methods are explained.Four interventions were considered:● ART provided during TB treatment for people livingwith HIV;● CPT provided during TB treatment for people livingwith HIV;● IPT for HIV-positive people enrolled in HIV care;● Early TB diagnosis through systematic screening forTB among people living with HIV.These interventions were compared with a counterfactualscenario defined as no ART, no CPT, no IPT and no TBscreening.1Policy on collaborative TB/HIV activities. Geneva, World HealthOrganization, 2004 (WHO/HTM/TB/2004.330; WHO/HTM/HIV/2004.1).2WHO policy on collaborative TB/HIV activities: guidelines for nationalprogrammes and other stakeholders. Geneva, 2012 (WHO/HTM/TB/2012.1).80 GLOBAL TUBERCULOSIS REPORT 2012
TABLE 7.2 Assumptions used to estimate lives saved by ART, CPT, screening for TB among people living with HIV and IPTINTERVENTION MEAN EFFICACY IN PREVENTING TB DEATHS DISTRIBUTION ASSUMPTIONSART for TB patients 0.7 Uniform, 0.6–0.8CPT for TB patients a 0.21 Normal, standard error 0.09IPT for people living with HIVwithout active TB diseaseSystematic screening of peopleliving with HIV to detect cases ofTB, followed by early initiation ofTB treatment0.3 Uniform, 0.25–0.350.01 Uniform, 0.0043–0.0157CPT has no additional benefi t if ART is alsoprovided.Effi cacy of IPT in preventing TB 0.6; casefatality rate of 50% among HIV-positive TBcases.The probability of detecting TB in systematicscreening, per person screened, is 0.05.Detected cases of TB are already on CPT andthe proportion started on ART is equal tothe global ART:CPT ratio. TB screening hasno additive effect for people already on ART.Additional impact of early TB treatment forpeople not on ART but on CPT is 0.2.awww.aidsmap.com/Cotrimoxazole-prophylaxis-cuts-risk-of-death-for-HIV-positive-patients-with-TB-in-Zambia/page/1430833/The effectiveness of the four interventions was estimatedusing the parameters defined in Table 7.2.Between 2005 and 2011, the number of lives savedrose from less than 50 000 in 2005 to over 0.4 millionin 2011 (Figure 7.9); the total cumulative number of livessaved was 1.3 million (range 1.2–1.5 million).Four limitations of the analysis should be noted. First,any errors and inconsistencies in data reported by countriescould not be accounted for. Second, the impact ofTB screening among people living with HIV is hard toestimate; the frequency of TB screening determineshow early TB diagnosis will be made compared with noscreening, and no global data on the frequency of screeningwere available. Third, only four of the 12 collaborativeactivities were considered. Fourth, the impact of collaborativeTB/HIV activities on the transmission of TB andHIV was not accounted for. For the latter two reasons,the estimates presented here are likely to be conservative.GLOBAL TUBERCULOSIS REPORT 2012 81
CHAPTER 8Research and developmentKEY FACTS AND MESSAGES Conventional technologies have been constrainingprogress in TB care and control, but efforts to developnew TB diagnostics, drugs, and vaccines have intensifi edduring the past decade and considerable progress hasbeen made. WHO has endorsed several new diagnostic tests ormethods since 2007, including Xpert MTB/RIF that hasthe potential to transform TB care. Other new tests,including point-of-care tests, are in development. For the fi rst time in 40 years, a coordinated portfolio ofpromising new anti-TB drugs is in development, with 11new or repurposed anti-TB drugs in clinical trials. Results from two Phase III trials of 4-month regimensfor the treatment of drug-susceptible TB are expectedin 2013. In addition, 2 new compounds are beingevaluated for use as an adjunct to current optimizedregimens for MDR-TB; one compound recently movedto a Phase III trial and the other is expected to do sobefore the end of 2012. A new three-drug combination regimen that could beused to treat both drug-sensitive TB and MDR-TB andshorten treatment duration has been tested in a PhaseII study of early bactericidal activity, with encouragingresults. There are 11 vaccine candidates for TB prevention inPhase I or Phase II trials and one immunotherapeuticvaccine in a Phase III trial. It is hoped that one or twoof the candidates in a Phase II trial will enter a PhaseIII trial in the next 2–3 years, with the possibility oflicensing at least one new vaccine by 2020. Funding for TB research and development has increasedin recent years, but stagnated between 2009 and 2010.At US$ 630 million in 2010, funding falls far short ofthe annual target of US$ 2 billion specifi ed in the <strong>Global</strong>Plan to Stop TB 2011–2015.There has been major progress in TB care and controlsince the mid-1990s (Chapters 2–7). However, achievementof the Stop TB Partnership’s target of eliminatingTB by 2050 (Chapter 1) requires the development ofnew diagnostics, drugs and vaccines as well as better andwider use of existing technologies. For example, modelingstudies show that TB elimination by 2050 demandsa combination of improved diagnosis of drug-susceptibleand drug-resistant TB, better and shorter treatments forall forms of TB, treatment of people with latent TB infectionon a massive scale (especially in high-risk populations)and mass vaccination with a vaccine that is moreeffective than BCG. 1During the past decade, efforts to develop new diagnostics,drugs and vaccines for TB have intensified. Forexample, public–private partnerships have been createdto stimulate the development of novel tools for TB control.These include the Foundation for Innovative NewDiagnostics (in 2003), which works on the developmentof novel diagnostics for TB among a range of other diseases;the TB Alliance (in 2000), for new anti-TB drugs;and for new vaccines against TB, Aeras (in 2003) and theTB Vaccine Initiative (in 2008). The Stop TB Partnershipincludes three working groups for new diagnostics,new drugs and new vaccines, which represent importantforums for exchanging information and promotingresearch.Funding for TB research and development increasedfrom US$ 363 million in 2005 to US$ 630 million in2010 2 but stagnated between 2009 and 2010. The 2010level of funding falls about US$ 1.4 billion per year shortof the needs described in the <strong>Global</strong> Plan to Stop TB 2011–2015. 3 Major sources of existing funding include the UnitedStates National Institutes of Health/National Instituteof Allergy and Infectious Diseases (NIH/NIAID), the Bill& Melinda Gates Foundation, the European Commission(including the European Developing Countries ClinicalTrials Partnership, EDCTP), USAID and DFID, as well as1Abu-Raddad LJ et al. Epidemiological benefits of more effectivetuberculosis vaccines, drugs and diagnostics. Proceedingsof the National Academy of Sciences of the United States of America,2009, 106(33):13980–139805.2Jiménez-Levi E. 2011 <strong>Report</strong> on tuberculosis research fundingtrends, 2005–2010, 2nd ed. New York, NY, Treatment ActionGroup, 2012.3The <strong>Global</strong> Plan to Stop TB, 2011–2015. Geneva, World HealthOrganization, 2010 (WHO/HTM/STB/2010.2).82 GLOBAL TUBERCULOSIS REPORT 2012
FIGURE 8.1 The development pipeline for new TB diagnostics, July 2012Liquid culture and DSTRapid speciationLPA for MDR-TBNon-commercial culture and DST(MODS, NRA, CRI)LPA for XDR-TBLPA for MDR-TB 2nd generation10–40Distance from patientsREFERENCE LEVELNew SS+ case definition Xpert MTB/RIF2-specimen approachesLED microscopySame-day diagnosisManual NAATRapid colorimetric DSTXpert 2ndgeneration70Access after 5 years (%)INTERMEDIATE LEVELVOC detectionEnzymatic detectionAg and Ab detectionNAAT 2nd generationPERIPHERAL LEVEL952007 2008 2009 2010 2011 2012 2013 2014 2015 2016Technologies or methods endorsed by WHOTechnologies at feasability stageTechnologies commercialized, not yet endorsed by WHOTechnologies at early stages of developmentAbbreviations: DST Drug susceptibility test; NAAT Nucleic acid amplifi cation test; LTBI Latent TB infection; Ag Antigen; Ab Antibody; MODS Microscopic observation drugsusceptibility;NRA Nitrate reductase assay; CRI Colorimetric redox indicator assay; LED Light-emitting diode; LPA Line probe assay; VOC Volatile organic compound.several other national, bilateral and multilateral agencies,private companies and philanthropic organizations. Tohighlight the need for and catalyse further efforts in TBresearch, a roadmap outlining critical priority areas forfuture scientific investment across the research spectrumwas published in 2011. 1In 2011, a chapter on the latest status of progress in TBresearch and development was introduced in the series ofWHO global reports on TB for the first time. In this 2012report, the status of progress as of July 2012 is summarized,drawing primarily on information provided by thesecretariats of the relevant working groups of the Stop TBPartnership.8.1 New diagnostics for TBSputum-smear microscopy – the most commonly useddiagnostic test for TB – is more than 100 years old. Thistest is relatively insensitive and it cannot be used to identifypaucibacillary or extrapulmonary TB. Diagnosisusing culture methods – the current reference standard– requires laboratory infrastructure that is not widelyavailable in countries with a high burden of TB (Chapter6), and results are only available after a few weeks. Con-1An international roadmap for tuberculosis research. Geneva, WorldHealth Organization, 2011 (also available at:www.stoptb.org/assets/documents/resources/publications/technical/tbresearchroadmap.pdf;accessed July 2012).ventional methods used to diagnose multidrug-resistantTB (MDR-TB) also rely on culturing of specimens followedby drug susceptibility testing (DST); results takeweeks to obtain and not all laboratories with the capacityto perform DST of first-line drugs have the capability toperform DST of second-line drugs.The status of the pipeline for new TB diagnostics inJuly 2012 is shown in Figure 8.1. After decades of stagnation,accelerated development of new TB diagnostics inthe past decade presents real hope that rapid diagnosisof TB and MDR-TB can become a reality, thus removinglongstanding barriers to TB care and control.In the past 5 years, WHO has endorsed several newtests and diagnostic approaches. These include:● liquid culture with rapid speciation as the referencestandards for bacteriological confirmation;● molecular line probe assays for rapid detection ofMDR-TB;● non-commercial culture and DST methods;● light-emitting diode fluorescence microscopes forimproved smear microscopy; and● Xpert MTB/RIF (Cepheid, Sunnyvale, CA, USA) forthe rapid diagnosis of TB and rifampicin-resistant TB.Following WHO’s endorsement of Xpert MTB/RIF inDecember 2010, research on its use has proliferated. ByJuly 2012, more than 65 peer-reviewed publications hadbeen published, covering the full spectrum of researchand confirming initial findings on the test’s performance.GLOBAL TUBERCULOSIS REPORT 2012 83
BOX 8.1Xpert MTB/RIF operational researchprojects mapped by TREAT-TBTREAT-TB, a research programme implemented by the Union(an international NGO that conducts work on TB and otherlung diseases) with funding from USAID, is monitoring andmapping operational research on Xpert MTB/RIF as part of itswork. The topics for which research is being conducted and thenumber of studies per topic are summarized below.Use in target populationsPeople suspected of having TB: 14 studiesPeople suspected of having MDR-TB: 9 studiesHIV-associated TB: 7 studiesChildren: 4 studiesUse at different levels of the health-care systemPoint-of-care level: 14 studiesDistrict level: 11 studiesCentral level: 7 studiesImpact assessmentHealth-care system costs: 13 studiesPatient costs: 12 studiesHealth-care system requirements: 12 studiesEquity issues: 3 studiesFurther details are available from the TREAT-TB web site atwww.treattb.orgBOX 8.2Xpert MTB/RIF innovations, 2011–2012There have been fi ve innovations since WHO endorsed theXpert MTB/RIF assay in December 2010:■ refinements to the Xpert MTB/RIF assay cartridge,implemented in 2011, resulting in increased rifampicinspecifi city without loss of sensitivity;■ modifications to the software, fluidics and minor changesto Probe B, resulting in reduced error rates compared withthose observed with the earlier cartridges;■ development of a calibration kit for users, allowing usersto recalibrate the optical system, verify the functioningof the thermal system and conduct a series of systemleveltests to ensure full system functionality withinspecifi cations, thereby reducing the need for remotecalibration of GeneXpert modules;■ better packaging of cartridges, resulting in reducedpackaging requirements, thus reducing waste and shippingcosts; and■ development of validation panels, allowing end-usersto validate the expected performance of the GeneXpertinstrument following installation, to demonstrate theirability to use the assay correctly, and to interpret andreport results. Artifi cial sputum samples spiked withheat-killed TB bacilli, developed by the <strong>Global</strong> LaboratoryInitiative, are now being shipped with each new GeneXpertinstrument.Of particular programmatic relevance are several operationalresearch studies addressing key research questionsidentified following a WHO <strong>Global</strong> Consultation on XpertMTB/RIF held in Geneva in December 2010. These studiesare being mapped by an interactive tool developed bythe Union-led and USAID-funded TREAT-TB initiative, 1which complements the monitoring of Xpert MTB/RIFroll-out by WHO. 2 By July 2012, 24 operational researchprojects in 16 countries had been registered, coveringmultiple aspects of Xpert MTB/RIF implementation (Box8.1).The possibility of using Xpert MTB/RIF to improve thediagnosis of extrapulmonary TB and the diagnosis of TBin children is also being explored. The overall sensitivityand specificity in studies completed to date ranges from75% to 95%, depending on the type of specimen, withexcellent specificity of 99%–100% for all types of specimensinvestigated. WHO plans to evaluate the evidencein the first half of 2013. It should be noted that specimencollection remains problematic for extrapulmonary TBand in young children who cannot expectorate sputum.Developing safe and effective strategies for specimen collectionand optimizing specimen processing for individualswith paucibacillary disease thus remain importanttopics for research. In the meantime, ongoing innovationsto the Xpert MTB/RIF assay have already resulted in significantimprovements to the technology (Box 8.2).In 2011, WHO issued strong policy recommendationsagainst the use of poorly-performing yet expensivecommercial, antibody-based serological diagnostic tests,and cautioned against the use of commercial interferongammarelease assays to detect latent TB infection inhigh-burden TB and HIV settings (further details aboutthis policy guidance are provided in Chapter 6).In 2012, WHO evaluated two tests that were alreadycommercially available: a manual molecular assay todetect TB DNA in sputum specimens (TB-LAMP®, EikenChemical Co. Ltd., Japan); and a line probe assay fordetecting resistance to second-line anti-TB drugs (Geno-Type® MTBDRsl, Hain Lifescience, Germany). The evidence-basedprocess followed by WHO resulted in theconclusion that available data for the TB-LAMP assaywere insufficient to proceed with the development of policyguidance. The same process also led to the conclusionthat the line probe assay for detecting resistance to second-lineanti-TB drugs cannot be used as a replacementtest for conventional phenotypic DST, given its modestsensitivity to detect resistance to fluoroquinolones andsecond-line injectable agents. While the high specificityof the test may allow the assay to be used as a triage test toguide initial treatment – albeit limited to smear-positive1www.treattb.org2http://who.int/tb/laboratory/mtbrifrollout/en/index.html84 GLOBAL TUBERCULOSIS REPORT 2012
sputum specimens and TB isolates from culture – conventionalphenotypic testing remains the reference standardfor detecting extensively drug-resistant TB (XDR-TB)until more data become available. Further details aboutthe evaluation of these tests is provided in Chapter 6.Consistent challenges in developing new TB diagnosticshave been the sophisticated and costly laboratoryinfrastructure and specialized human resources requiredfor the range of tests needed to diagnose TB in its variousforms, and test utility being restricted to increasinglysophisticated levels of laboratory services. Only oneDST technology – based on a rapid colorimetric methodsuitable for use at the intermediate laboratory level – iscurrently at the stage of being tested for feasibility. Second-generationXpert assays and possible alternativemolecular technologies are in the early or conceptualstages of development and are not expected to reach themarket before the end of 2015.TB remains unique among the major infectious diseasesin lacking accurate and rapid point-of-care (POC)tests. Insufficient progress in biomarker research, technicaldifficulties in transforming sophisticated laboratorytechnologies into robust yet accurate POC platforms, anda lack of interest from industry have resulted in slow andsuboptimal progress. The era of “omics” has seen largescalesearches for biological markers of disease and theapplication of emerging technologies to identify novelmarkers of disease, particularly from blood and urine.These have traditionally been directed at finding reliablesurrogates for culture to assess and/or predict treatmentprognosis and have only recently become a focus for thedevelopment of TB diagnostics.Non-sputum based tests remain an attractive avenueto explore for POC development. Commercially availableantigen detection assays can identify Mycobacteriumtuberculosis lipoarabinomannan (LAM) in urine; however,their accuracy in routine clinical use has beensuboptimal. 1 Two recent studies evaluating a low-cost,POC version of a commercial TB-LAM test (Determine®TBLAM, Alere Inc., Waltham, MA, USA) showed moderatesensitivity and high specificity in a subgroup of TBpatients living with HIV who had advanced immunosuppression(CD4 cell-counts
FIGURE 8.2 The development pipeline for new TB drugs, July 2012Discovery a Preclinical development Clinical developmentLeadoptimizationPreclinicaldevelopmentGoodLaboratoryPracticetoxicityPhase I Phase II Phase IIIDiarylquinolineDprE InhibitorsGyrB inhibitorsInhA InhibitorsLeuRS InhibitorsMGyrX1 inhibitorsMycobacterial GyraseInhibitorsPyrazinamide AnalogsRiminophenazinesRuthenium (II)complexesSpectinamidesTranslocase-1 InhibitorsCPZEN-45DC-159aQ-201SQ-609SQ-641BTZ-043TBA-354Bedaquiline(TMC-207)LinezolidNovel RegimensPA-824RifapentineSQ-109Sutezolid (PNU-100480)Delamanid(OPC-67683)GatifloxacinMoxifloxacinRifapentineChemical classes: fluoroquinolone, rifamycin, oxazolidinone, nitroimidazole, diarylquinoline, benzothiazinoneaOngoing projects without a lead compound series can be viewed at www.newtbdrugs.org/pipeline-discoverySource: Stop TB Partnership Working Group on New TB Drugs; see www.newtbdrugs.orgthe efficacy and tolerability of treatment for MDR-TBand to improve the treatment of TB among people livingwith HIV. New drugs could also help to treat latent TBinfection in people without active TB disease; at present,preventive therapy usually consists of 6–9 months of isoniazidmonotherapy.The status of the pipeline for new anti-TB drugs in July2012 is shown in Figure 8.2. Of the 11 new or repurposedTB drugs under clinical investigation (one more than inmid-2011), 4 are in Phase III (efficacy) trials and 7 are inPhase II (early bactericidal activity and sputum cultureconversion) trials. Two of the Phase III trials are evaluating4-month combination regimens in which a fluoroquinolone(gatifloxacin or moxifloxacin) is substitutedfor either ethambutol or isoniazid; results are expectedin 2013. A third Phase III trial is evaluating the use ofrifapentine (a rifamycin that has a longer half-life thanrifampicin) as part of a 4-month regimen for the treatmentof drug-susceptible TB. Since mid-2011, the delamanid(OPC-67683) compound, which is being testedas an addition to optimized background therapy for thetreatment of MDR-TB, has moved from a Phase II to aPhase III trial.Of the seven individual compounds in Phase II trials,bedaquiline (TMC-207) is being tested as an addition tooptimized background therapy for the treatment of MDR-TB. It is expected to move to a Phase III trial before theend of 2012. The other six compounds in Phase II trialsare linezolid, which has been tested for the treatment ofXDR-TB at a dose of 600 mg/day in the Republic of Korea;sutezolid (PNU-100480), an oxazolidinone analogue oflinezolid; PA-824, a nitro-imidazole; SQ-109, originallysynthesized as a derivative of ethambutol; and AZD-5847,another oxazolidinone.Besides individual compounds, very promising resultson the early bactericidal activity of a novel TB regimen(NC-001) that includes three drugs (PA-824, moxifloxacinand pyrazinamide) became available in July 2012(Box 8.3).These major advances in drug development mean thatmultiple trials will be needed in various high-burdencountries. This presents several challenges. Trials arelengthy and costly, since patients need to be followed upfor an extended period of time after completing treatment.New drugs have to be tested in various drug combinationswith current and/or newly re-purposed drugs; 1to facilitate this, novel biomarkers for treatment responseand sterilizing activity, new approaches to the design ofclinical trials 2 and increased capacity (including staff andinfrastructure) to implement trials in accordance withinternational standards are required.Several research groups and institutions worldwideare working to address and overcome these challenges.A good example is the NIH-funded AIDS Clinical TrialsGroup, whose goal is to transform TB treatment (includingHIV-associated TB) by developing and optimizingregimens to treat and prevent TB more quickly andeffectively. The group is working on the identification ofbiomarkers to better understand TB pathogenesis andtreatment response and to shorten future clinical trialsby using surrogate markers for clinical end-points. 3 Thisis closely linked to strengthening the capacity of clini-1Lienhardt C et al. New drugs for the treatment of tuberculosis:needs, challenges, promise, and prospects for the future. Journalof Infectious Diseases, 2012; published online March 23 (doi:10.1093/infdis/jis034).2Phillips PJ et al. Innovative trial designs are practical solutionsfor improving the treatment of tuberculosis. Journal of InfectiousDiseases, 2012 (doi:10.1093/infdis/JIS041).3https://actgnetwork.org/86 GLOBAL TUBERCULOSIS REPORT 2012
cal trial sites and building laboratory and pharmacologyresearch capacity; efforts are coordinated with otherclinical trial networks to optimize efforts to develop newcombination regimens. The Critical Path to New TB DrugRegimens initiative, whose goal is to accelerate the developmentof novel regimens that will shorten TB treatment,is also an important example of a global effort to ensurethat the necessary trials can be implemented. 18.3 New vaccines to prevent TBThe BCG (Bacille-Calmette-Guérin) vaccine for the preventionof TB is almost 100 years old. The vaccine protectsagainst severe forms of TB in children (TB meningitis andmiliary TB), but its efficacy in preventing pulmonary TBin adults is highly variable. BCG is not recommendedfor use in infants known to be infected with HIV, dueto the risk of disseminated BCG disease. Historic opportunitiesfor developing new TB vaccines arose duringthe 1990s, following the development of techniques forgenetic manipulation of mycobacteria and completion ofthe genome sequence of M. tuberculosis.Two different approaches are being used to developTB vaccines for prevention of TB. 2 The first approach isto develop vaccines that would do better than BCG andreplace it – such as an improved version of BCG or anew attenuated live M. tuberculosis vaccine. The secondapproach is to develop a “prime-boost” strategy in whichBCG continues to be given to neonates (as now), since itprevents TB in infants and children, and give the newvaccine as a “booster” dose at a later stage. Alternatively,the new vaccine would be delivered to infants alongsideother vaccines at 3–9 months of age and as a separatebooster in young adults. The vaccine candidates currentlyunder development could be used to prevent either infection(pre-exposure), or to prevent primary progression todisease or reactivation of latent TB (post-exposure). Workis also being carried out to develop vaccines that couldbe used as immunotherapeutic agents, i.e. to improveresponsiveness to chemotherapy.The status of the pipeline for new vaccines in July 2012is shown in Figure 8.3. Of the 12 vaccine candidates inclinical trials, 11 are for prevention of TB and one is animmunotherapeutic vaccine.MVA85A is an attenuated vaccinia-vectored vaccinecandidate designed as a booster vaccine for infants, adolescentsand adults. Among existing vaccine candidatesfor TB prevention, it is the one that is most advanced interms of clinical testing. The first Phase IIb trial of thisvaccine was conducted in South Africa from 2009 to2011, with 2797 infants enrolled. Results are expected inearly 2013, and will provide the first efficacy data of aBOX 8.3Testing the new drug regimen PaMZ(NC-001): progress by mid-2012Novel anti-TB drug regimens could transform therapy byshortening and simplifying the treatment of both drugsensitiveand drug-resistant TB with the same oral regimen.Novel regimens for treatment of MDR-TB have the potential tobe much less expensive than currently recommended therapies(since they include fewer drugs and treatment duration isshorter), fostering expansion of treatment globally.NC-001 – also known as New Combination 1 – is a trial of anovel TB regimen that includes the drug candidate PA-824combined with moxifl oxacin and the standard fi rst-line anti-TB drug, pyrazinamide (PaMZ). The trial is being conductedin partnership with and sponsored by the TB Alliance. Theregimen has been tested for early bactericidal activity againstpulmonary TB over a 2-week period, with encouraging results. 1The regimen had bactericidal activity at least comparableto a standard regimen of isoniazid (H), rifampicin (R),pyrazinamide (Z) and ethambutol (E). This study also validateda new approach to the development of new anti-TB drugregimens, which has the potential to reduce the time requiredto complete clinical trials from decades to years. Research onNC001 has also included testing of some novel combinationsof two drugs that may form the “core” of future regimens, thusinforming other clinical trials being planned during the next 18months and beyond.The testing of the PaMZ regimen advanced to a 2-month trial(called NC-002) in March 2012. In this trial, carried out inBrazil, South Africa and the United Republic of Tanzania, PaMZis being tested for patients with drug-sensitive TB and patientswith drug-resistant TB who are sensitive to the drugs includedin the new regimen. The NC-002 trial is a landmark trial: it isthe fi rst to simultaneously investigate treatment of both drugsensitiveand drug-resistant disease using the same regimen.Results are expected in the third quarter of 2013.1Diacon AH et al. 14-day bactericidal activity of PA-824, bedaquiline,pyrazinamide, and moxifl oxacin combinations: a randomised trial.Lancet, 2012;380(9846):986-93.1http://www.c-path.org/CPTR.cfm2Kaufmann SHE, Hussey G, Lambert PH. New vaccines fortuberculosis. Lancet, 2010, 375:2110–2119.GLOBAL TUBERCULOSIS REPORT 2012 87
FIGURE 8.3 The development pipeline for new vaccines, July 2012Phase I Phase II Phase IIbPhase IIIAdAg85AMcMaster UniversityP B PIHybrid-I+CAF01with Statens SerumInstitute (SSI),<strong>Tuberculosis</strong> VaccineInitiative (TBVI)P B PIH56+IC31Statens Serum Institute(SSI), Aeras, IntercellP B PIHyvac 4/AERAS-404+IC31with Statens SerumInstitute (SSI), SanofiPasteur, Aeras, IntercellBID93Infectious DiseaseResearch Institute(IDRI), AerasB PI itM72+AS01GlaxoSmithKline (GSK),AerasB PIVPM 1002Max Planck, VakzineProjekt Mgmt,<strong>Tuberculosis</strong> VaccineInitiative (TBVI)P BHybrid-1+IC31Statens Serum Institute(SSI), <strong>Tuberculosis</strong>Vaccine Initiative(TBVI), European andDeveloping CountriesClinical Trials (EDCTP),IntercellP B PIRUTIArchivel Farma, S.L.B PI itMVA85A/AERAS-485Oxford-Emergent<strong>Tuberculosis</strong> Consortium(OETC), AerasB PI itAERAS-402/Crucell Ad35Crucell, AerasBMw [M. indicus pranii(MIP)]Department ofBiotechnology (India),M/s. CadilaitP Prime B Boost PI Post-infection it ImmunotherapyTB Vaccine Types Viral-vectored: MVA85A, AERAS-402, AdAg85AProtein/adjuvant: M72, Hybrid-1, Hyvac 4, H56, ID93rBCG: VPM 1002Killed WC or Extract: Mw, RUTISource: Stop TB Partnership Working Group on New VaccinesBOX 8.4<strong>Tuberculosis</strong> vaccines: a strategic blueprintResearch into TB vaccines is at a pivotal moment as focus shifts from the discovery of novel approaches and moving new vaccinecandidates from the laboratory to early clinical trials to building on the progress that has already been made. This includes learning fromthe effi cacy of vaccine candidates in clinical development, establishing much-needed markers and correlates of immune protection thatwill help to identify the next generation of vaccine candidates, and laying the groundwork for the licensure and distribution of new TBvaccines.In March 2012, the Stop TB Partnership’s Working Group on New TB Vaccines published <strong>Tuberculosis</strong> vaccines: a strategic blueprint. Thischarts the future course of TB vaccine research and is intended as guidance for researchers, regulators, advocates, donors, policy anddecision-makers, among other stakeholders. The blueprint outlines the major scientifi c challenges and priorities, critical activities andcrucial questions that need to be addressed to develop life-saving TB vaccines in fi ve key priority areas:■ Creativity in research and discovery. The major question to be answered is why certain individuals infected with M. tuberculosis areresistant to TB disease.■ Correlates of immunity and biomarkers for TB vaccines. Here, the focus is on identifying correlates of immunity for TB vaccines.■ Clinical trials: harmonization and cooperation. The main question to be addressed is whether TB vaccines can effectively reduce thetransmission of M. tuberculosis.■ Rational selection of TB vaccine candidates. This priority area tackles the challenge of having all developers of vaccines agree tostandardized criteria for the selection and development of novel TB vaccines.■ The critical need for advocacy, community acceptance and funding. Here, the emphasis is on innovative approaches to mobilizingfunding for TB vaccines.The blueprint is designed to initiate a renewed, intensifi ed and well-integrated international effort to develop TB vaccines that will have asignifi cant impact on global TB control.The complete blueprint, including relevant opinion editorials, is available at http://www.stoptb.org/wg/new_vaccines/88 GLOBAL TUBERCULOSIS REPORT 2012
new TB vaccine candidate. A Phase IIb trial of MVA85A isnow being conducted in adults living with HIV in Senegaland South Africa; the trial started in 2011 and up to 1400participants will be enrolled.AERAS-402/Crucell Ad35 is an adeno-vectored vaccinecandidate designed as a booster vaccine for infants,adolescents and adults. A Phase IIb multicentre clinicaltrial in healthy infants is under way in Kenya, Mozambiqueand South Africa; up to 4000 participants will beenrolled.There are four vaccines in Phase II trials. M72 andHybrid-1 are two distinct protein subunit vaccines, formulatedin novel adjuvants to enhance their immunogenicity.Both vaccines, which are based on a combinationof two immune-dominant antigens from M. tuberculosis,are being tested in Phase IIa trials in Europe and Africa.VPM 1002 is a live recombinant vaccine, derived from thePrague strain of the BCG vaccine into which the listerolysingene from Listeria monocytogenes has been clonedand the urease gene deleted to improve immunogenicity.This vaccine is currently in a Phase IIa trial in South Africa.Finally, RUTI, a non-live vaccine based on fragmentedM. tuberculosis bacteria, is in a Phase IIa trial in Spain.Research on new TB vaccines is at a crucial juncture.While the past decade focused on the discovery of novelapproaches and moving new vaccine candidates from thelaboratory to early clinical trials, the next decade willfocus on consolidating progress. 1 This will entail learningfrom the efficacy of vaccine candidates in clinical developmentand identifying much-needed markers and correlatesof immune protection that will greatly assist in theselection of the next generation of vaccine candidates. 2The future course of work on new TB vaccines has beencharted in a new strategic document, <strong>Tuberculosis</strong> vaccines:a strategic blueprint, developed by the Stop TB Partnership’sWorking Group on New TB Vaccines and publishedin March 2012 (Box 8.4).8.4 Fundamental science and operationalresearch to stimulate innovation andoptimize the use of available toolsFundamental science is necessary to drive innovations innew tools for improved TB care and control. Fundamentalresearch is required to better characterize M. tuberculosisand to improve understanding of the interaction betweenthe bacillus and the human host, as a basis for maintainingthe flow of new technologies into the productpipeline. Investments in basic science for TB worldwide,at US$ 129 million in 2010, represented 20% of globalspending on TB research and development. The largestshare of this funding (43%) was from NIH/NIAID.Researchers supported to conduct biomedical andfundamental research on TB through NIAID and othermajor funding agencies are making great strides in redefiningthe spectrum of TB disease and the transition fromlatent to active TB, and developing a better understandingof the reasons why prolonged antibiotic treatment isneeded. This progress is expected to deliver better knowledgeabout pathogenesis, identification of biomarkers andbio-signatures relevant to new TB diagnostics. It is alsoexpected to point to new targets for anti-TB drugs as wellas early indicators of protective immunity, vaccine efficacyand early response to treatment. Such developmentswill facilitate the selection and testing of new interventions.To catalyze further progress and pave the way forfuture research, an International Roadmap for TB Researchhas been developed. 3 This outlines critical priority areasfor future scientific investment.A guide on Operational research priorities to improve TBcare and control was published in 2011. 4 It defines thecritical questions that need to be addressed to improvecurrent programmatic performance and to facilitate theintroduction of novel strategies and interventions thatuse new tools.1Ottenhoff THM, Kaufmann SHE. Vaccines against tuberculosis:where are we and where do we need to go? PLoS Pathogens,2012, 8(5):e1002607 (doi:10.1371/journal.ppat.1002607).2Barker LF et al. <strong>Tuberculosis</strong> vaccine research: the impact ofimmunology. Current Opinion in Immunology, 2009, 21(3):331–338.3Stop TB Partnership and World Health Organization. AnInternational Roadmap for <strong>Tuberculosis</strong> Research. Geneva: WorldHealth Organization, 2011 (also available at:www.stoptb.org/assets/documents/resources/publications/technical/tbresearchroadmap.pdf;accessed July, 2012).4Stop TB Partnership, <strong>Global</strong> Fund to Fight AIDS, <strong>Tuberculosis</strong>and Malaria. Priorities in operational research to improvetuberculosis care and control. Geneva, World Health Organization,2011 (also available at:http://whqlibdoc.who.int/publications/2011/9789241548250_eng.pdf; accessed July 2012).GLOBAL TUBERCULOSIS REPORT 2012 89
ANNEX 1Methods used to estimatethe global burden of diseasecaused by TBGLOBAL TUBERCULOSIS REPORT 2012 91
This annex explains the methods that were used to produceestimates of the global burden of disease caused byTB (measured in terms of incidence, prevalence and mortality).It has nine major sections:● General approach. This section provides some backgroundinformation about the methods used to produceestimates of disease burden.● Definitions. This section defines TB incidence, prevalenceand mortality, the case fatality rate (CFR) andthe case notification rate. It also explains the regionsfor which estimates of disease burden are producedand sources of information on population estimates.● Estimates of TB mortality, 1990–2011. This sectionexplains the three methods used to estimate TB mortality,and the countries for which they were applied.Methods for estimating the number of HIV-associatedTB deaths and for disaggregation of TB mortality byage and sex are also described.● Estimates of TB incidence, 1990–2011. This sectionexplains the main methods used to estimate TB incidence,and the countries for which they were applied.Methods to estimate the prevalence of HIV amongincident TB cases are described.● Estimates of TB prevalence, 1990–2011. This sectionexplains the two methods used to estimate TBprevalence, and the countries for which they wereapplied.● Estimates of the number of cases of multidrugresistantTB (MDR-TB). This section explains howestimates of the proportion of notified cases of TB thathad MDR-TB in 2011 were produced and used to assessthe number of prevalent cases of MDR-TB in 2011.● Projections of TB incidence, prevalence and mortality.This section explains how projections up to2015 were produced.● Uncertainty framework. This section explains thegeneral approach to including uncertainty in all estimates.1. General approachEstimates of the burden of disease caused by TB (measuredin terms of incidence, prevalence and mortality)are produced annually by WHO using information gatheredthrough surveillance systems (case notifications anddeath registrations), special studies (including surveys ofthe prevalence of disease, mortality surveys and in-depthanalyses of surveillance data), expert opinion and consultationswith countries. Two recent publications provideup-to-date guidance about how TB incidence, prevalenceand mortality should be measured, 1 based on the workof the WHO <strong>Global</strong> Task Force on TB Impact Measurement.2 The methods used to estimate the burden of diseasewere updated in 2009 following 18 months of workby an expert group convened by the Task Force. Improvementsto methods included systematic documentation ofexpert opinion and how this has been used to produceestimates of disease burden, simplification of models, 3updates to parameter values based on the results of systematicreviews, much greater use of mortality data fromVR systems and systematic documentation of uncertainty(hence the uncertainty intervals shown on all of the estimatesof disease burden in this report).2. Definitions2.1 Incidence, prevalence, mortality, case fatalityrate, case notification rateIncidence is defined as the number of new and recurrent(relapse) episodes of TB (all forms) occurring in a givenyear. Recurrent episodes are defined as a new episode ofTB in people who have had TB in the past and for whomthere was bacteriological confirmation of cure and/ordocumentation that treatment was completed (Box 3.1,Chapter 3). In the remainder of this Annex, relapse casesare referred to as recurrent cases because the term is moreuseful when explaining the estimation of TB incidence.Recurrent cases may be true relapses or a new episodeof TB caused by reinfection. In current case definitions,both relapse cases and patients who require a change intreatment are called “retreatment cases”. However, peoplewith a continuing episode of TB that requires a treatmentchange are prevalent cases, not incident cases.Prevalence is defined as the number of TB cases (allforms) at a given point in time.Mortality from TB is defined as the number of deathscaused by TB in HIV-negative people, according to the latestrevision of the international classification of diseases(ICD-10). TB deaths among HIV-positive people are classifiedas HIV deaths in ICD-10. For this reason, estimatesof deaths from TB in HIV-positive people are presentedseparately from those in HIV-negative people.The case fatality rate is the risk of death from TB amongpeople with active TB disease. 4The case notification rate refers to new and recurrentepisodes of TB notified to WHO for a given year, expressedper 100 000 population. The case notification rate for newand recurrent TB is important in the estimation of TB1TB impact measurement: policy and recommendations for how toassess the epidemiological burden of TB and the impact of TB control.Geneva, World Health Organization, 2009 (Stop TB policypaper, no. 2; WHO/HTM/TB/2009.416). The policy paper isavailable on the Task Force’s web sitewww.who.int/tb/advisory_bodies/impact_measurement_taskforce2For further details, see the Task Force web site at:www.who.int/tb/advisory_bodies/impact_measurement_taskforce3For example, some parameter values are now estimated onlyat global level or for regions, rather than for each country individually.4Straetemans M et al. Assessing tuberculosis case fatality ratio:a meta-analysis. PLoS One. 2011, 6(6):e20755.GLOBAL TUBERCULOSIS REPORT 2012 93
incidence. In some countries, however, information ontreatment history may be missing for some cases. Whendata on treatment history are not available, recurrentcases cannot be distinguished from cases whose treatmentwas changed, since both are registered and reportedin the category “retreatment”. Data for patients reportedin the “unknown history” category are assessed withnational TB control programmes (NTPs) to determine theproportion of such patients included in the category ofrecurrent cases.2.2 RegionsRegional analyses are generally undertaken for the sixWHO regions (that is, the African Region, the Regionof the Americas, the Eastern Mediterranean Region, theEuropean Region, the South-East Asia Region and theWestern Pacific Region). For analyses related to MDR-TBand for an ecological model used to estimate TB mortalityin some countries, nine epidemiological regions weredefined. These were African countries with high HIVprevalence, African countries with low HIV prevalence,Central Europe, Eastern Europe, high-income countries,1 Latin America, the Eastern Mediterranean Region(excluding high-income countries), the South-East AsiaRegion (excluding high-income countries) and the WesternPacific Region (excluding high-income countries). Thecountries in these nine regions are listed in Appendix 1.2.3 Population estimatesWhere population sizes are needed to calculate TB indicators,the 2012 revision of estimates provided by theUnited Nations Population Division (UNPD) was used. 2The UNPD estimates sometimes differ from those madeby countries.3. Estimates of TB mortality, 1990–2011The best sources of data about deaths from TB (excludingTB deaths among HIV-positive people) are VR systemsin which causes of death are coded according to ICD-10(although the older ICD-9 and ICD-8 classification arestill in use in several countries). Deaths from TB in HIVpositivepeople are coded under HIV-associated codes.Three methods were used to estimate TB mortality:● direct measurements of mortality from vital registration(VR) systems or mortality surveys.● indirect estimates based on an ecological model.● indirect estimates derived from multiplying estimatesof TB incidence by estimates of the CFR.Each method is described in more detail below. The sourceof data used for each country is available from tbdata@who.int upon request.3.1 Estimating TB mortality from vital registrationdata and mortality surveysData from VR systems are reported to WHO by MemberStates and territories every year. In countries with functioningVR systems in which causes of death are codedaccording to the two latest revisions of the internationalclassification of diseases (underlying cause of death:ICD-10 A15-A19, equivalent to ICD-9: 010-018), VR dataare the best source of information about deaths from TBamong people not infected with HIV. When people withAIDS die from TB, HIV is registered as the underlyingcause of death and TB is recorded as a contributory cause.Since one third of countries with VR systems report toWHO only the underlying causes of death and not contributorycauses, VR data usually cannot be used to estimatethe number of TB deaths in HIV-positive people.TB mortality data obtained from VR systems are essentialto understanding trends in TB disease burden wherecase notifications have incomplete coverage or their coverageis not documented through an inventory study. Anupdated description of the global coverage and quality ofVR data is available in World Health Statistics 2012. 3As of May 2012, 122 countries had reported mortalitydata to WHO (including data from sample VR systemsand mortality surveys), among 217 countries and territoriesfrom which TB data were requested. These 122countries included 8 of the 22 high TB-burden countries(HBCs): Brazil, China, India, the Philippines, the RussianFederation, Thailand, South Africa and Zimbabwe.However, the VR data on TB deaths from South Africaand Zimbabwe were not used for this report because largenumbers of HIV deaths were miscoded as TB deaths.Improved empirical adjustment procedures have recentlybeen published, 4 and specific post-hoc adjustments formisclassification errors in the measurement of TB mortalitywill be attempted before preparing the 2013 WHOreport on global TB care and control.Among the countries for which VR data could be used(see Figure 2.11 in Chapter 2), there were 1928 countryyeardata points 1990–2011. Of these data points, 30outliers and points obtained from systems with very lowcoverage were excluded for analytical purposes. Outlierswere detected visually by plotting country-specific timeseries of reported TB mortality rates. As of May 2012,only 29 data points were available for 2010 and none for1High-income countries are defined by the World Bank ascountries with a per capita gross national income (GNI) ofUS$ 12 475 in 2011.2http://esa.un.org/unpd/wpp/unpp/panel_population.htm; accessed May 2012.3www.who.int/gho/publications/world_health_statistics/2012/en/; accessed July 2012 (see particularlypages 44–45).4Birnbaum JK, Murray CJL, Lozano R. Exposing misclassifiedHIV/AIDS deaths in South Africa. Bulletin of the World HealthOrganization, 2011, 89:278–285.94 GLOBAL TUBERCULOSIS REPORT 2012
2011. On average, 15 data points were retained for analysisper country (standard deviation (SD) of 6.5) from atotal of 1898 usable data points.<strong>Report</strong>s of TB mortality were adjusted upwards toaccount for incomplete coverage (estimated deaths withno cause documented) and ill-defined causes of death(ICD-9 code B46, ICD-10 codes R00–R99). 1It was assumed that the proportion of TB deaths amongdeaths not recorded by the VR system was the same as theproportion of TB deaths in VR-recorded deaths. For VRrecordeddeaths with ill-defined causes, it was assumedthat the proportion of deaths attributable to TB was thesame as the observed proportion in recorded deaths.The adjusted number of TB deaths d a was obtainedfrom the VR report d as follows:dd a =c(1 – g)where c denotes coverage (i.e. the number of deaths witha documented cause divided by the total number of estimateddeaths) and g denotes the proportion of ill-definedcauses.The uncertainty related to the adjustment was estimatedwith standard deviation SD = d/4[1/(c/(1 – g)) – 1]. Theuncertainty calculation does not account for miscoding,such as HIV deaths miscoded as deaths due to TB.Missing data between existing adjusted data pointswere imputed using log-linear interpolation (or simpleinterpolation in small countries with reports of zeromortality). Trailing missing values were predicted usingexponential smoothing models for time-series. 2 A penalizedlikelihood method based on the in-sample fit wasused for country-specific model selection. Leading missingvalues were similarly predicted backwards to 1990. Atotal of 813 country-year data points were thus imputed.Results from mortality surveys were used to estimateTB mortality in India. Further details are available in the2011 edition of the WHO report on global TB control.3.2 Estimating TB mortality from anecological modelAn out-of-sample, goodness-of-fit, stepwise selectionapproach was used to select an ecological model thatcould predict TB mortality in countries without VR data.The model was based on the time series of VR data reportedto WHO as described above, expressed as counts of TBdeaths and corrected for ill-defined causes of deaths andVR coverage.A population-averaged negative binomial model, withtotal population as the offset converting model outputs1Mathers CD et al. Counting the dead and what they died from:an assessment of the global status of cause of death data. Bulletinof the World Health Organization, 2005, 83:171–177.2Hyndman R et al. Forecasting with exponential smoothing: the statespace approach. Springer Series in Statistics, 2008.to rates, was used to account for the longitudinal structureof the data as well as the observed over-dispersion ofcounts of TB deaths.Ten variables were investigated for inclusion in themodel. These were: the infant mortality rate per 1000 livebirths; gross domestic product per capita; HIV prevalenceamong the general population; the percentage of the totalpopulation aged
For consistency with VR- or survey-based mortality estimates,CFRs were estimated such that they gave the bestfit to the directly measured TB death rates (within theiruncertainty ranges) in the 125 countries with VR datathat were retained for analysis, in conjunction with WHOestimates of distributions of TB incidence in those countries.This statistical fitting used Bayesian linear modelsand was done separately for two groups of countries(high-income and all other countries), to account for differencesin the ratio of reported TB mortality to TB notificationrates among these two groups (data not shown).The models used normal errors and Gibbs sampling:y = (I – N) 1 + N 2 + , ~ N(0, 2 )where y is TB mortality from VR, I denotes TB incidenceexcluding people living with HIV, N denotes TB notificationsexcluding people living with HIV, and parametersβ1 and β2 denote the CFR in non-notified and notifiedcases respectively. Semi-conjugate priors were set with anuninformative inverse Gamma prior on the conditionalerror variance:b ~ N(b i ,B i-2), 2 ~ IG(5.10 -4 ,5.10 -4 )For low- and middle-income countries, priors b and theirprecision B were defined based on literature reviews 1and the country-year CFR parameters used by WHO forthe years 1999–2008. For high-income countries, noninformativepriors were used. Convergence of MarkovChains was assessed graphically and using convergencediagnostic tests. Within each case category 1990–2011,mortality estimates were computed by taking the productof posterior distributions of the CFR, assumed to betime-independent (Table A1.1), and country-year specificdistributions of estimated incidence.3.4 Estimating HIV-associated TB mortalityNo nationally representative measurements of HIVassociatedTB mortality were available from VR systemsfor use in this report. In the absence of direct measurements,HIV-associated TB mortality was estimated indirectlyusing a Bayesian model. It should be highlightedthat there was a significant level of sensitivity to changesin model parameters and distributions, leading to considerableand incompletely documented uncertainty surroundingestimates.A prior belief P about the proportion of AIDS deathswith TB as the contributory cause of death was definedusing evidence from a literature review 2 and the assumptionof a beta distribution with parameters a and b. Theproportion was defined as 37% (SD 3.8%). The numberof AIDS deaths was obtained from data published byUNAIDS. 3 The prior distribution’s mean of AIDS deathswith TB as a contributory cause of death was thus 37% of1.75 million AIDS deaths i.e. about 648 000 AIDS deathswith TB as a contributory cause in 2011.The likelihood for the estimated number of TB deathsamong AIDS cases was based on an assumed CFR of 50%(SD 5%) in low- and middle-income countries and a CFRof 20% (SD 2%) in high-income countries, using methodsas described above and from literature reviews. 4People with TB on antiretroviral therapy (ART) wereassumed to benefit from the protective effect of ART.To a significant extent, the protective effect depends onthe timing of ART initiation. 5 While ART increases theodds of survival when introduced early, it also shortensthe time for subclinical TB to become symptomatic, aphenomenon often referred to as “unmasking”. 6 In theabsence of reported data on the timing of ART initiationand average CD4 cell-count, we estimated the overallprotective effect of ART at 50% (SD 5%). Incident casesof HIV-positive TB were disaggregated by ART status tocalculate the likelihood for the estimated number of TBdeaths among AIDS cases, noted D.The likelihood D is a beta density with parameters s+1and f+1 obtained using the method of moments describedin Section 4.1.By combining the beta prior P with D, the posterior isalso distributed beta, with parameters a+s and b+f. Posteriordistributions were determined for each country-yeardata point.On average, when the number of TB deaths amongAIDS cases from D is less than in the prior distribution P,then the posterior distribution will be pulled away fromP towards lower values of HIV-associated TB deaths. Incountries with a high coverage of ART, D will pull theposterior distribution more strongly away from P, towardslower values.In the absence of country-specific direct measurementsof HIV-associated TB mortality reported to WHO,the Bayesian model described above was used to generateestimates of HIV-associated TB mortality. Since the priorP is based on autopsy studies in a limited number of countriesin sub-Saharan Africa (where most TB cases amongHIV-positive people occur) and based on UNAIDS estimatesof AIDS deaths (most of which occur in sub-SaharanAfrica), country-specific estimates for other countries1Straetemans M et al. Assessing tuberculosis case fatality ratio:a meta-analysis. PLoS One. 2011, 6(6):e20755.2Cox JA et al. Autopsy causes of deaths in HIV-positive individualsin Sub-Saharan Africa and correlation with clinicaldiagnosis. AIDS, 2010, 12:183–194.3www.unaids.org/en/dataanalysis/epidemiology/;accessed 15 July 2011.4Straetemans M et al. The effect of tuberculosis on mortalityin HIV positive people: a meta-analysis. PLoS One, 2010,5(12):e15241.5Piggott DA, Petros C. Karakousis PC. Timing of Antiretroviraltherapy for HIV in the setting of TB treatment. Clinical andDevelopmental Immunology, 2011 (doi:10.1155/2011/103917).6Lawn DS et al. Immune reconstitution and ‘‘unmasking’’ oftuberculosis during antiretroviral therapy. American Journal ofRespiratory and Critical Care Medicine, 2008, 177:680–685.96 GLOBAL TUBERCULOSIS REPORT 2012
may suffer from biases. These biases are difficult to predict.However, the influence of countries outside theAfrican Region on global estimates of HIV-associated TBdeaths is relatively small due to their comparatively smallnumbers of HIV-positive TB cases.It is worth noting that at the global level, the posteriordistribution is heavily influenced by D and by the effect ofthe increasing coverage of ART in recent years, leading toan estimated 430 000 HIV-associated TB deaths in 2011(range 400 000–460 000).In the absence of direct measurements, it was not possibleto validate country-specific estimates of HIV-associatedTB mortality; as such, country-specific estimates arenot included in this report.Direct measurements of HIV-associated TB mortalityare urgently needed. This is especially the case for countriessuch as South Africa and Zimbabwe, where nationalVR systems are already in place. In other countries, moreefforts are needed to initiate the implementation of sampleVR systems as an interim measure.3.5 TB mortality disaggregated by age and sexFor countries with VR data, it was possible to estimate TBdeaths among children (aged
TABLE A1.2POSSIBLE CATEGORIES OF INCIDENT CASESDo not have physical orfi nancial accessto health careSeek care, but TB notdiagnosedTB diagnosed, but notreported<strong>Report</strong>ed casesincidence in three countries that participated in regionalworkshops: Egypt, Iraq and Yemen.A full description of the methods used in these workshopsis available in a report of the workshop held forcountries in the African Region (in Harare, Zimbabwe,December 2010). 1Distributions of the proportion of cases that were notreported in the three reference years were assumed tofollow a Beta distribution (Table A1.3). Reasons for usingBeta distributions include the following:● They are continuous and defined on the interval (0,1). Since the variance of the proportions of cases thatwere not reported tend to be large as a result of highuncertainty, random draws of numbers from a normaldistribution would yield numbers outside the interval(0, 1). The use of truncated normal distributions mayresult in excess density towards one of the bounds.● They are not necessarily symmetrical.● They are defined with two parameters that can beestimated from available data using the method ofmoments. 2The shape and scale parameters necessary to define theBeta distribution were computed using the method ofmoments, as follows:First, the variance for the distribution was taken as:V =u – l4where l and u are the lower and upper bounds of theplausible range for the proportion of incident cases thatwere reported (also referred to as the case detection ratein Chapter 3).Shape 1 (noted α) and 2 (noted β) follow from:E(l – E)s =V = sE = s(l – E)Sources of information and data on TBincidence used in regional workshops andcountry missions– lDemographic andhealth surveys,KABP a surveysSurvey“Inventory” surveyTB surveillanceaKABP = knowledge, attitudes, behaviour and practices.SOURCES OF DATAwhere E is the expected value of the distribution.Capture–recapturemodellingTime series for the period 1990–2011 were built accordingto the characteristics of the levels of underreportingthat were estimated for the three reference years. A cubicspline extrapolation of V and E, with knots set at the referenceyears, was used for countries with low-level orconcentrated HIV epidemics. In countries with a generalizedHIV epidemic, the trajectory of incidence from 1990to the first reference year (usually 1997) was based on theannual rate of change in HIV prevalence. Incidence trajectorieswere derived from the series of notified TB casesusing Monte Carlo simulations from which expected values,2.5th and 97.5th centiles were extracted. All computationswere conducted in the R statistical environment. 3In two countries, incidence rates were estimated tobe similar to those in a neighbouring country becauseinformation from surveillance systems was insufficient:estimates for West Bank and Gaza Strip were extrapolatedfrom estimates for Jordan and estimates for SouthSudan were extrapolated from estimates for Sudan. Theestimates for West Bank and Gaza Strip and South Sudanshould therefore be considered as preliminary.Trends in incidence were derived from repeat tuberculinsurvey results in Bhutan, India and Yemen and for 40countries (including countries in Eastern Europe) fromtrends in mortality.If there were insufficient data to determine the factorsleading to time-changes in case notifications, incidencewas assumed to follow a horizontal trend going throughthe most recent estimate of incidence.4.2 Estimating TB incidence from dataon case notifications and expert opinionfor high-income countriesFor high-income countries, the level of TB incidence wasassumed to be distributed between the notification ratefor new and recurrent cases combined (lower uncertaintybound, noted l) and 1.3 times the notification rate (upperuncertainty bound, noted u), as informed by expert opinion.The distribution of incidence was assumed to followa Beta distribution with shape and scale parameters computedusing the method of moments, as described above.In the absence of country-specific data on the qualityand coverage of TB surveillance systems, it was assumedthat TB surveillance systems from countries in the highincomegroup performed similarly well, although themodel does allow for stochastic fluctuations. The excep-1See www.who.int/tb/advisory_bodies/impact_measurement_taskforce.The tools (called TISAT and the Workbook) used in regionalworkshops and country missions are also available on the TaskForce’s web site.2Rényi A. Probability theory. New York, Dover Publications Inc.,2007.3R Development Core Team. R: a language and environmentfor statistical computing. Vienna, R Foundation for StatisticalComputing, 2009 (www.R-project.org).98 GLOBAL TUBERCULOSIS REPORT 2012
TABLE A1.3Parameter estimates used to produce estimates of TB incidence, prevalence and mortalityMODEL PARAMETER DISTRIBUTION DISTRIBUTION PARAMETERS bIncidence, high-income countriesBeta a = Ī . Ī (1– Ī )– 1V = (1– Ī ) . Ī (1– Ī )– 1Vwhere Ī was set at 1.3 times the notifi cation rate, noted N, and V isdefi ned by:0.3V = N 24HIV prevalence among incident TB Beta a = x – . x – (1– x – )– 1V = (1– x – ) . x – (1– x – )– 1VWhere x – is the expected value and V is given by:V =u – l42Duration of disease, non-notifi ed Uniform l = 1, u = 4 (years)HIV-negative cases of TBDuration of disease, non-notifi ed Uniform l = 0.01, u = 0.2 (years)HIV-positive cases of TBDuration of disease, notifi ed Uniform l = 0.2, u = 2 (years)HIV-negative cases of TBDuration of disease, notifi ed Uniform l = 0.01, u = 1 (years)HIV-positive cases of TBaThe probability density function of the Beta distribution is:bu and l denote upper and lower bounds.ƒ (x; , ) =x –1 (1– x) –110 t –1 (1– t) –1 dttions were the United Kingdom of Great Britain andNorthern Ireland and the Netherlands, where the underreportingof TB cases has been measured using inventorystudies and capture-recapture modelling. 1,2 For these twocountries, the results from these studies were used tomeasure TB incidence directly.4.3 Estimating TB incidence from empiricalmeasurements of disease prevalenceIncidence can be estimated using measurements fromnational surveys of the prevalence of TB disease combinedwith estimates of the duration of disease. Incidenceis estimated as the prevalence of TB divided by the averageduration of disease.1<strong>Tuberculosis</strong> in the UK: annual report on tuberculosis surveillance inthe UK 2010. London, Health Protection Agency Centre for Infections,2010 (also available at:www.hpa.org.uk/web/HPAweb&HPAwebStandard/HPAweb_C/1287143581697; accessed July 2011).2van Hest NA et al. Completeness of notification of tuberculosisin The Netherlands: how reliable is record-linkage andcapture–recapture analysis? Epidemiology and Infection, 2007,135(6):1021–1029.In practice, the duration of disease cannot be directlymeasured. For example, measurements of the duration ofsymptoms in prevalent TB cases that are detected duringa prevalence survey are systematically biased towardslower values, since active case-finding truncates the naturalhistory of undiagnosed disease. Measurements of theduration of disease in notified cases ignore the duration ofdisease among non-notified and untreated cases.Literature reviews commissioned by the WHO <strong>Global</strong>Task Force on TB Impact Measurement have providedestimates of the duration of disease in untreated TB casesfrom the pre-chemotherapy era (before the 1950s). Thebest estimate of the mean duration of disease (for smearpositivecases and smear-negative cases combined) inHIV-negative individuals is about three years. However,the proportion of incident cases that remain untreated isunknown. There are few data on the duration of diseasein HIV-positive individuals.When measurements from two prevalence surveyswere available, trends in TB prevalence were derivedby fitting a log-linear model to available measurements.When three or more prevalence measurements wereavailable, the prevalence trajectory was built using cubicGLOBAL TUBERCULOSIS REPORT 2012 99
spline interpolation. If only one prevalence survey measurementwas available, time-trends were assessed usingin-depth analysis of surveillance data, as described above.In this report, the prevalence to incidence method wasused for three countries: Ethiopia, Laos and Viet Nam.4.4 Disaggregations of TB incidenceIn this report, TB incidence is only disaggregated by HIVinfectionstatus (see following section). The estimation ofsmear-positive TB incidence was discontinued in 2010,for reasons explained in detail in the global report publishedin 2010.4.5 Estimates of HIV prevalence among incident TBcases, 1990–2011The prevalence of HIV among incident cases of TB wasdirectly estimated from country-specific and empiricaldata wherever possible, with missing data imputed to completetime series using methods similar to those describedin Section 3.1. For the estimates published in this report,suitable data (as defined in Table A1.4) were available fora total of 639 country-year data points. When data fromseveral data sources were available for the same countryyear,one source was retained based on knowledge aboutthe underlying quality of data, consistency with adjacenttime points or with expectations. In general, nationalsurveys of HIV prevalence in newly detected TB casestook precedence over the other two sources unless thereported numbers were judged not plausible (in generaldue to data entry errors that could not be corrected intime for use in this report). The least reliable data sourcewas considered to be HIV sentinel surveillance systems asthese do not generally provide nationally representativedata on TB cases.TABLE A1.4Sources of data on HIV prevalence amongincident TB casesDIRECT MEASUREMENT OF THE PREVALENCE OF HIV IN TB PATIENTSNUMBER OF COUNTRY-YEARSNational surveys 20HIV sentinel surveillance 26Provider-initiated testing and counselling withat least 50% coverage of testing593Total 639Provider-initiated testing and counselling with at least50% HIV testing coverage is the most widely availablesource of information on the prevalence of HIV in TBpatients. However, this source of data is affected by biases,particularly when coverage is closer to 50% than to100%. In all countries with repeat data from testing, therelationship between the prevalence of HIV in TB patientsand the coverage of HIV testing was examined graphically.In some countries, the prevalence of HIV in TBpatients was found to decrease with increasing HIV testingcoverage while in others it increased with increasingHIV testing coverage; in most countries, the prevalenceof HIV followed highly inconsistent patterns (with repeatchanges in direction) as HIV testing coverage increased.Therefore, it was not possible to adjust for the effect ofincomplete coverage of HIV testing on estimates of theprevalence of HIV among TB patients. The assumptionwas thus made that TB patients with an HIV test resultwere statistically representative of all TB cases. As coverageof HIV testing continues to increase globally, biaseswill decrease.For the 4047 country-year data points for which surveillancedata were either not available or for which thepercentage of TB patients tested for HIV was below 50%,the prevalence of HIV was estimated indirectly accordingto the following equation:ht =l + h( – l)In this equation, t is HIV prevalence among incident TBcases, h is HIV prevalence among the general population(from the latest time-series provided by UNAIDS) and ρis the incidence rate ratio (IRR) (defined as the incidencerate of TB in HIV-positive people divided by the incidencerate of TB in HIV-negative people). We then let logit(t) belog(t/(1-t)) and logit(h) be log(h/(1-h)). Using data fromcountries where HIV prevalence has been estimated byUNAIDS as an independent variable, a linear model oflogit-transformed t was fitted using logit-transformed haccording to the following equation, written in matrixnotation:ˆT = Xwhere ˆT is a vector of predicted logit(t), X is an n x 2matrix in which the first column holds 1s, and the secondcolumn holds logit(h). The vector β holds estimatedmodel parameters. Models were tested with lags set forlogit(h) ranging from no lag to a lag of 8 years. The best fitwas obtained with a lag of one year.Models were run using Monte Carlo simulations inwhich h was drawn randomly from a Beta distributionwith shape parameters computed as described in Section4.1, (low and high uncertainty bounds are providedby UNAIDS – also see Table A1.3). The model was run50 000 times using country-specific distributions for Hand T (noted in capital letters to denote vectors or matrices)based on their uncertainty intervals. The uncertaintybounds for β were chosen as the 2.5th and 97.5th centiles.The source of data used for each country is availableupon request from tbdata@who.int.100 GLOBAL TUBERCULOSIS REPORT 2012
5. Estimates of TB prevalence, 1990–2011The best way to measure the prevalence of TB is throughnational population-based surveys of TB disease. 1,2 Datafrom such surveys are available for an increasing numberof countries (Chapter 2). It should be noted, however,that measurements of prevalence are typically confinedto the adult population. Furthermore, prevalence surveysexclude extrapulmonary cases and do not allow the diagnosisof cases of culture-negative pulmonary TB.When there is no direct measurement from a nationalsurvey of the prevalence of TB disease, prevalence is themost uncertain of the three TB indicators used to measuredisease burden. This is because prevalence is theproduct of two uncertain quantities: (i) incidence and (ii)disease duration. The duration of disease is very difficultto quantify because it cannot be measured during surveysof the prevalence of TB disease (surveys truncate thenatural history of disease). Duration can be assessed inself-presenting patients, but there is no practical way tomeasure the duration of disease in patients who are notnotified to NTPs.Indirect estimates of prevalence were calculatedaccording to the following equation:P = I i,j d i,j , i{1,2}, j{1,2}where the index variable i denotes HIV+ and HIV–, theindex variable j denotes notified and non-notified cases,d denotes the duration of disease in notified cases and I istotal incidence. In the absence of measurements, we didnot allow duration in notified cases to vary among countries.Given their underlying uncertainty, prevalence estimatesshould be used with great caution in the absenceof direct measurements from a prevalence survey. Unlessmeasurements were available from national programmes(for example, Turkey), assumptions of the duration of diseasewere used as shown in the last four rows of TableA1.3.6. Estimates of the number of casesof MDR-TB6.1 Proportion of notified cases of TB that haveMDR-TB, 2011<strong>Global</strong> and regional estimates of the proportion of newand retreatment cases of TB that had MDR-TB in 2011were calculated using country-level information. If countrieshad reported data on the proportion of new andretreatment cases of TB that have MDR-TB from routinesurveillance or a survey of drug resistance the latest availableinformation was used. For countries that have notreported such data, estimates of the proportion of newand retreatment cases of TB that have MDR-TB were producedusing modelling (including multiple imputation)that was based on data from countries for which data doexist. Estimates for countries without data were based oncountries that were considered to be similar in terms ofTB epidemiology (for country groups see Appendix 1).The observed and imputed estimates of the proportionof new and retreatment cases of TB that have MDR-TBwere then pooled to give a global estimate, with countriesweighted according to their share of global notificationsof new and retreatment cases.6.2 Numbers of prevalent cases of MDR-TB, 2011The global estimate of the number of prevalent casesof MDR-TB in 2011 was derived in two steps. First, theweighted average of the proportion of new and retreatmentnotified cases that had MDR-TB was computed, togive an estimate of the proportion of all notified cases thathad MDR-TB. This combined proportion was then multipliedby the estimated global prevalence of TB in thegeneral population, under the assumption that the proportionof all cases that have MDR-TB was the same asthe proportion of notified cases that have MDR-TB.Country-specific estimates of the number of prevalentcases of MDR-TB in 2011 were not computed because onlya few countries have directly measured the prevalence ofTB in a population-based survey, and even among thesecountries data on the proportion of culture-positive pulmonarycases that had MDR-TB were not always available.To date, direct measurements of the number ofprevalent cases of MDR-TB are available only for China,although several upcoming surveys will include assessmentsof drug resistance. In the absence of direct measurementsat country level, country-specific estimatesof the prevalence of MDR-TB suffer from much greateruncertainty compared with the uncertainty that surroundsglobal averages.6.3 XDR-TB or fluoroquinolone resistance amongpatients with MDR-TBUsing data from 67 countries, global estimates were calculatedfor the following proportions: (i) patients withMDR-TB who had XDR-TB; (ii) patients with MDR-TBwho had fluoroquinolone resistance; and (iii) patientswith MDR-TB who had fluoroquinolone resistance butnot XDR-TB. Proportion of second-line drug and fluoroquinoloneresistance testing of MDR-TB cases amongthese countries has a median of 1 and an interquartilerange of (0.97–1). The latest available national and subnationaldata from each country were analysed usinglogistic regression models with robust standard errors toaccount for the clustering effect at the level of the countryor territory.1Glaziou P et al. <strong>Tuberculosis</strong> prevalence surveys: rationale andcost. International Journal of <strong>Tuberculosis</strong> and Lung Disease, 2008,12(9):1003–1008.2TB prevalence surveys: a handbook. Geneva, World Health Organization,2011 (WHO/HTM/TB/2010.17).GLOBAL TUBERCULOSIS REPORT 2012 101
7. Projections of incidence, prevalence andmortality up to 2015Projections of TB incidence, prevalence and mortalityrates up to 2015 enable assessment of whether global targetsset for 2015 are likely to be achieved at global, regionaland country levels. Projections for the years 2011–2015were made using exponential smoothing models fitted todata from 2005–2011.8. Estimation of uncertaintyThere are many potential sources of uncertainty associatedwith estimates of TB incidence, prevalence andmortality, as well as estimates of the burden of HIV-associatedTB and MDR-TB. These include uncertainties ininput data, in parameter values, in extrapolations used toimpute missing data, and in the models used.We used fixed population values from the UNPD. Wedid not account for any uncertainty in these values.Notification data are of uneven quality. Cases may beunderreported (for example, missing quarterly reportsfrom remote administrative areas are not uncommon),misclassified (in particular, misclassification of recurrentcases in the category of new cases is common), or overreportedas a result of duplicated entries in TB informationsystems. The latter two issues can only be addressedefficiently in countries with case-based nationwide TBdatabases that include patient identifiers. Sudden changesin notifications over time are often the result of errors orinconsistencies in reporting, but may sometimes reflectabrupt changes in TB epidemiology (for example, resultingfrom a rapid influx of migrants from countries witha high burden of TB, or from rapid improvement in casefindingefforts).Missing national aggregates of new and recurrent caseswere imputed by interpolation. Notification trajectorieswere smoothed using a penalized cubic splines functionwith parameters based on the data. Attempts to obtaincorrections for historical data are made every year, butonly rarely do countries provide appropriate data corrections.Mortality estimates incorporated the following sourcesof uncertainty: sampling uncertainty in the underlyingmeasurements of TB mortality rates from data sources,uncertainty in estimates of incidence rates and rates ofHIV prevalence among both incident and notified TBcases, and parameter uncertainty in the Bayesian model.Time-series of TB mortality were generated for eachcountry through Monte Carlo simulations.Unless otherwise specified, uncertainty bounds andranges were defined as the 2.5th and 97.5th centiles ofoutcome distributions. Throughout this report, rangeswith upper and lower bounds defined by these centilesare provided for all estimates established with the use ofsimulations. When uncertainty was established with theuse of observed or other empirical data, 95% confidenceintervals are reported.The model used the following sequence: (1) cleaningand adjustment of raw mortality data from VR systems,followed by imputation of missing values in countrieswith VR data; (2) cleaning and adjustment of measurementsof HIV prevalence among TB patients followed byimputation of missing values in countries with measurementsof HIV prevalence in TB patients; (3) estimationof HIV prevalence among incident cases of TB throughmodelling in countries with no measurements; (4) TBincidence estimation; (5) estimation of TB mortality incountries with no VR data; (6) estimation of HIV-associatedTB mortality; (7) estimation of prevalence.The general approach to uncertainty analyses was todraw values from specified distributions for every parameter(except for notifications and population values) inMonte Carlo simulations, with the number of simulationruns set so that they were sufficient to ensure stabilityin the outcome distributions. For each country, the samerandom generator seed was used for every year, and errorswere assumed to be time-dependent within countries(thus generating autocorrelation in time-series). Regionalparameters were used in some instances (for example, forCFRs). Summaries of quantities of interest were obtainedby extracting the 2.5th, 50th and 97.5th centiles of posteriordistributions. Wherever possible, uncertainty waspropagated analytically by approximating the momentsof functions of random variables using Taylor expansions– such as when taking the product or the ratio of two randomvariables – rather than through Monte Carlo simulations.Appendix 1. Epidemiological regionsused for analysesAfrica – countries with high HIV prevalence: Botswana,Burundi, Cameroon, the Central African Republic,the Congo, Côte d’Ivoire, the Democratic Republic ofthe Congo, Ethiopia, Gabon, Kenya, Lesotho, Malawi,Mozambique, Namibia, Nigeria, Rwanda, South Africa,South Sudan, Swaziland, Uganda, the United Republic ofTanzania, Zambia, Zimbabwe.Africa – countries with low HIV prevalence: Algeria,Angola, Benin, Burkina Faso, Cape Verde, Chad, theComoros, Djibouti, Eritrea, the Gambia, Ghana, Guinea,Guinea-Bissau, Liberia, Madagascar, Mali, Mauritania,Mauritius, the Niger, Sao Tome and Principe, Senegal,Seychelles, Sierra Leone, Somalia, Sudan, Togo.Central Europe: Albania, Bosnia and Herzegovina,Montenegro, Serbia, the former Yugoslav Republic ofMacedonia, Turkey.Eastern Europe: Armenia, Azerbaijan, Belarus, Bulgaria,Georgia, Kazakhstan, Kyrgyzstan, Latvia, Lithuania,102 GLOBAL TUBERCULOSIS REPORT 2012
the Republic of Moldova, Romania, the Russian Federation,Tajikistan, Turkmenistan, Ukraine, Uzbekistan.High-income countries: Andorra, Aruba, Australia,Austria, the Bahamas, Bahrain, Barbados, Belgium, Bermuda,Brunei Darussalam, Canada, the Cayman Islands,China, Hong Kong SAR, China Macao SAR, Croatia,Cyprus, the Czech Republic, Denmark, Equatorial Guinea,Estonia, Finland, France, French Polynesia, Germany,Greece, Greenland, Guam, Hungary, Iceland, Ireland,Israel, Italy, Japan, Kuwait, Luxembourg, Malta, Monaco,the Netherlands, the Netherlands Antilles, New Caledonia,New Zealand, Northern Mariana Islands, Norway,Oman, Poland, Portugal, Puerto Rico, Qatar, the Republicof Korea, Saint Kitts and Nevis, San Marino, SaudiArabia, Singapore, Slovakia, Slovenia, Spain, Sweden,Switzerland, Trinidad and Tobago, the Turks and CaicosIslands, US Virgin Islands, United Arab Emirates, theUnited Kingdom, the United States.Eastern Mediterranean: Afghanistan, Egypt, Iran(Islamic Republic of), Iraq, Jordan, Lebanon, Libya,Morocco, Pakistan, Syrian Arab Republic, Tunisia, WestBank and the Gaza Strip, Yemen,Latin America: Anguilla, Antigua and Barbuda, Argentina,Belize, Bolivia (Plurinational State of), Bonaire,Saint Eustatius and Saba, Brazil, British Virgin Islands,Chile, Colombia, Costa Rica, Cuba, Curaçao, Dominica,the Dominican Republic, Ecuador, El Salvador, Grenada,Guatemala, Guyana, Haiti, Honduras, Jamaica, Mexico,Montserrat, Nicaragua, Panama, Paraguay, Peru, SaintKitts and Nevis, Saint Lucia, Saint Vincent and the Grenadines,Sint Maarten (Dutch part), Suriname, Uruguay,Venezuela (Bolivarian Republic of).South East Asia: Bangladesh, Bhutan, DemocraticPeople’s Republic of Korea, India, Indonesia, Maldives,Myanmar, Nepal, Sri Lanka, Thailand, Timor-Leste.West Pacific: American Samoa, Cambodia, China, CookIslands, Fiji, Kiribati, Lao People’s Democratic Republic,Malaysia, Marshall Islands, Micronesia (Federated Stateof), Mongolia, Nauru, Niue, Palau, Papua New Guinea,the Philippines, Samoa, Solomon Islands, Tokelau, Tonga,Tuvalu, Vanuatu, Viet Nam, Wallis and Futuna Islands.GLOBAL TUBERCULOSIS REPORT 2012 103
ANNEX 2Country profiles
AFGHANISTANPopulation 2011 32 millionHIGH TB BURDENEstimates of TB burden a 2011NUMBER (thousands) RATE (per 100 000 population)Mortality (excludes HIV+TB) 13 (5.3–23) 39 (16–71)Prevalence (includes HIV+TB) 110 (55–190) 351 (169–597)Incidence (includes HIV+TB) 61 (51–73) 189 (156–225)Incidence (HIV+TB) 0.30 (0.18–0.45) 0.93 (0.56–1.4)Case detection, all forms (%) 46 (38–55)TB case notifications 2011NEW CASES (%) RETREATMENT CASES (%)Smear-positive 13 789 (51) Relapse 1 130 (86)Smear-negative 4 166 (16) Treatment after failure 136 (10)Smear-unknown/not done 1 989 (7) Treatment after default 48 (4)Extrapulmonary 6 286 (23) OtherOther 623 (2)Total new 26 853 Total retreatment 1 314Mortality (excludes HIV+TB) (rateper 100 000 population per year)Prevalence(rate per 100 000 population)1008060402001990 1995 2000 2005 201080060040020001990 1995 2000 2005 2010Other (history unknown)Total new and relapse 27 983 Total cases notifi ed 28 167New casesSMEAR-NEGATIVE/SMEAR-POSITIVE UNKNOWN/NOT DONE EXTRAPULMONARYM:F ratio 0.5 1.1Age < 15 669 1 753Incidence (rate per 100 000population per year)30025020015010050Laboratories 2011Smear (per 100 000 population) 1.9Culture (per 5 million population) 0.5Drug susceptibility testing (per 5 million population)Is second-line drug susceptibility testing available?Yes, outside countryIs there a national reference laboratory?YesTreatment success rate 2010 (%)New smear-positiveIs rifampicin used throughout(and/or culture-positive) 90 treatment for new patients? NoNew smear-negative/extrapulmonary 82Retreatment 79TB/HIV 2011 NUMBER (%)TB patients with known HIV status 6 445 (23)HIV-positive TB patients 5 (
BANGLADESHPopulation 2011 150 millionHIGH TB BURDEN | HIGH MDR-TB BURDENEstimates of TB burden a 2011NUMBER (thousands) RATE (per 100 000 population)Mortality (excludes HIV+TB) 68 (29–120) 45 (19–82)Prevalence (includes HIV+TB) 620 (300–1 100) 411 (199–698)Incidence (includes HIV+TB) 340 (280–400) 225 (185–268)Incidence (HIV+TB) 0.63 (0.34–1.0) 0.42 (0.23–0.67)Case detection, all forms (%) 45 (37–54)TB case notifications 2011NEW CASES (%) RETREATMENT CASES (%)Smear-positive 98 948 (67) Relapse 2 701 (37)Smear-negative 21 921 (15) Treatment after failure 886 (12)Smear-unknown/not done 0 (0) Treatment after default 320 (4)Extrapulmonary 27 329 (18) Other 3 459 (47)Other 0 (0)Total new 148 198 Total retreatment 7 366Mortality (excludes HIV+TB) (rateper 100 000 population per year)Prevalence(rate per 100 000 population)1201008060402001990 1995 2000 2005 201080060040020001990 1995 2000 2005 2010Other (history unknown) 3 459Total new and relapse 150 899 Total cases notifi ed 159 023New casesSMEAR-NEGATIVE/SMEAR-POSITIVE UNKNOWN/NOT DONE EXTRAPULMONARYM:F ratio 2.0 1.9 1.0Age < 15 932 1 152 2 583Laboratories 2011Smear (per 100 000 population) 0.7Culture (per 5 million population)
BRAZILPopulation 2011 197 millionHIGH TB BURDEN | HIGH HIV BURDENEstimates of TB burden a 2011NUMBER (thousands) RATE (per 100 000 population)Mortality (excludes HIV+TB) 5.6 (4.6–6.8) 2.9 (2.3–3.4)Prevalence (includes HIV+TB) 91 (36–170) 46 (18–87)Incidence (includes HIV+TB) 83 (69–97) 42 (35–50)Incidence (HIV+TB) 16 (13–19) 8.2 (6.8–9.7)Case detection, all forms (%) 91 (77–110)TB case notifications 2011NEW CASES (%) RETREATMENT CASES (%)Smear-positive 40 294 (56) Relapse 3 555 (35)Smear-negative 12 683 (18) Treatment after failure 199 (2)Smear-unknown/not done 8 278 (12) Treatment after default 3 344 (33)Extrapulmonary 10 067 (14) Other 2 947 (29)Other 15 (
CAMBODIAPopulation 2011 14 millionHIGH TB BURDEN | HIGH HIV BURDENEstimates of TB burden a 2011NUMBER (thousands) RATE (per 100 000 population)Mortality (excludes HIV+TB) 9.1 (4.2–16) 63 (29–111)Prevalence (includes HIV+TB) 120 (99–140) 817 (690–954)Incidence (includes HIV+TB) 61 (52–70) 424 (364–489)Incidence (HIV+TB) 3.1 (2.6–3.6) 22 (18–25)Case detection, all forms (%) 64 (55–74)TB case notifications 2011NEW CASES (%) RETREATMENT CASES (%)Smear-positive 15 812 (41) Relapse 367 (25)Smear-negative 7 686 (20) Treatment after failure 49 (3)Smear-unknown/not done 0 (0) Treatment after default 30 (2)Extrapulmonary 14 690 (38) Other 1 036 (70)Other 0 (0)Total new 38 188 Total retreatment 1 482Mortality (excludes HIV+TB) (rateper 100 000 population per year)Prevalence(rate per 100 000 population)3002502001501005020001500100001990 1995 2000 2005 201050001990 1995 2000 2005 2010Other (history unknown) 0Total new and relapse 38 555 Total cases notifi ed 39 670New casesSMEAR-NEGATIVE/SMEAR-POSITIVE UNKNOWN/NOT DONE EXTRAPULMONARYM:F ratio 1.2Age < 15 73Laboratories 2011Smear (per 100 000 population) 1.5Culture (per 5 million population) 1.0Drug susceptibility testing (per 5 million population) 0.3Is second-line drug susceptibility testing available?Yes, outside countryIs there a national reference laboratory?YesTreatment success rate 2010 (%)New smear-positiveIs rifampicin used throughout(and/or culture-positive) 94 treatment for new patients? YesNew smear-negative/extrapulmonary 85Retreatment 75TB/HIV 2011 NUMBER (%)TB patients with known HIV status 32 544 (82)HIV-positive TB patients 1 650 (5)HIV-positive TB patients on co-trimoxazole preventive therapy (CPT) 1 456 (88)HIV-positive TB patients on antiretroviral therapy (ART) 1 306 (79)HIV-positive people screened for TB 4 747HIV-positive people provided with IPT 1 305Estimates of MDR-TB burden 2011 a NEW RETREATMENT% of TB cases with MDR-TB 1.4 (0.71–2.5) 11 (4.0–22)MDR-TB cases among notifi edpulmonary TB cases 330 (170–590) 160 (60–320)<strong>Report</strong>ed cases of MDR-TB 2011 NEW RETREATMENT TOTALCases tested for MDR-TB 18 (
CHINAPopulation 2011 1 348 millionHIGH TB BURDEN | HIGH HIV BURDEN | HIGH MDR-TB BURDENEstimates of TB burden a 2011NUMBER (thousands) RATE (per 100 000 population)Mortality (excludes HIV+TB) 47 (45–49) 3.5 (3.4–3.6)Prevalence (includes HIV+TB) 1 400 (1 200–1 600) 104 (91–119)Incidence (includes HIV+TB) 1 000 (890–1 100) 75 (66–85)Incidence (HIV+TB) 13 (8.6–17) 0.93 (0.63–1.3)Case detection, all forms (%) 89 (79–100)TB case notifications 2011NEW CASES (%) RETREATMENT CASES (%)Smear-positive 377 005 (44) Relapse 34 610 (74)Smear-negative 479 486 (55) Treatment after failure 2 499 (5)Smear-unknown/not done 2 028 (
DEMOCRATIC REPUBLIC OF THE CONGOPopulation 2011 68 millionHIGH TB BURDEN | HIGH HIV BURDEN | HIGH MDR-TB BURDENEstimates of TB burden a 2011NUMBER (thousands) RATE (per 100 000 population)Mortality (excludes HIV+TB) 36 (16–65) 54 (24–96)Prevalence (includes HIV+TB) 350 (180–570) 512 (263–842)Incidence (includes HIV+TB) 220 (190–250) 327 (282–375)Incidence (HIV+TB) 34 (27–41) 49 (40–60)Case detection, all forms (%) 50 (43–58)TB case notifications 2011NEW CASES (%) RETREATMENT CASES (%)Smear-positive 71 321 (67) Relapse 3 761 (47)Smear-negative 13 471 (13) Treatment after failure 573 (7)Smear-unknown/not done Treatment after default 587 (7)Extrapulmonary 21 579 (20) Other 2 998 (38)OtherTotal new 106 371 Total retreatment 7 919Mortality (excludes HIV+TB) (rateper 100 000 population per year)Prevalence(rate per 100 000 population)1201008060402001990 1995 2000 2005 2010100080060040020001990 1995 2000 2005 2010Other (history unknown)Total new and relapse 110 132 Total cases notifi ed 114 290New casesM:F ratio 1.2SMEAR-NEGATIVE/SMEAR-POSITIVE UNKNOWN/NOT DONE EXTRAPULMONARYAge < 15 3 379 3 280 7 667Laboratories 2011Smear (per 100 000 population) 2.2Culture (per 5 million population)
ETHIOPIAPopulation 2011 85 millionHIGH TB BURDEN | HIGH HIV BURDEN | HIGH MDR-TB BURDENEstimates of TB burden a 2011NUMBER (thousands) RATE (per 100 000 population)Mortality (excludes HIV+TB) 15 (11–20) 18 (14–24)Prevalence (includes HIV+TB) 200 (160–240) 237 (191–288)Incidence (includes HIV+TB) 220 (160–280) 258 (191–335)Incidence (HIV+TB) 38 (28–49) 45 (33–58)Case detection, all forms (%) 72 (55–96)TB case notifications 2011NEW CASES (%) RETREATMENT CASES (%)Smear-positive 49 594 (32) Relapse 2 143 (46)Smear-negative 52 967 (34) Treatment after failure 658 (14)Smear-unknown/not done 2 530 (2) Treatment after default 492 (11)Extrapulmonary 49 305 (32) Other 1 328 (29)Other 0 (0)Total new 154 396 Total retreatment 4 621Mortality (excludes HIV+TB) (rateper 100 000 population per year)Prevalence(rate per 100 000 population)60402001990 1995 2000 2005 201060050040030020010001990 1995 2000 2005 2010Other (history unknown) 0Total new and relapse 156 539 Total cases notifi ed 159 017New casesSMEAR-NEGATIVE/SMEAR-POSITIVE UNKNOWN/NOT DONE EXTRAPULMONARYM:F ratio 1.2Age < 15 3 830 6 025 6 617Incidence (rate per 100 000population per year)800600400200Laboratories 2011Smear (per 100 000 population) 2.3Culture (per 5 million population) 0.1Drug susceptibility testing (per 5 million population)
INDIAPopulation 2011 1 241 millionHIGH TB BURDEN | HIGH HIV BURDEN | HIGH MDR-TB BURDENEstimates of TB burden a 2011NUMBER (thousands) RATE (per 100 000 population)Mortality (excludes HIV+TB) 300 (190–430) 24 (15–35)Prevalence (includes HIV+TB) 3 100 (2 100–4 300) 249 (168–346)Incidence (includes HIV+TB) 2 200 (2 000–2 500) 181 (163–199)Incidence (HIV+TB) 94 (72–120) 7.6 (5.8–9.6)Case detection, all forms (%) 59 (54–65)TB case notifications 2011NEW CASES (%) RETREATMENT CASES (%)Smear-positive 642 321 (53) Relapse 112 508 (37)Smear-negative 340 203 (28) Treatment after failure 17 304 (6)Smear-unknown/not done Treatment after default 72 787 (24)Extrapulmonary 226 965 (19) Other 101 832 (33)Other 1 952 (
INDONESIAPopulation 2011 242 millionHIGH TB BURDEN | HIGH HIV BURDEN | HIGH MDR-TB BURDENEstimates of TB burden a 2011NUMBER (thousands) RATE (per 100 000 population)Mortality (excludes HIV+TB) 65 (29–120) 27 (12–48)Prevalence (includes HIV+TB) 680 (310–1 200) 281 (130–489)Incidence (includes HIV+TB) 450 (370–540) 187 (155–222)Incidence (HIV+TB) 15 (11–20) 6.2 (4.4–8.3)Case detection, all forms (%) 70 (59–85)TB case notifications 2011NEW CASES (%) RETREATMENT CASES (%)Smear-positive 197 797 (63) Relapse 5 348 (69)Smear-negative 101 750 (32) Treatment after failure 432 (6)Smear-unknown/not done Treatment after default 933 (12)Extrapulmonary 14 054 (4) Other 994 (13)OtherTotal new 313 601 Total retreatment 7 707Mortality (excludes HIV+TB) (rateper 100 000 population per year)Prevalence(rate per 100 000 population)1008060402001990 1995 2000 2005 201080060040020001990 1995 2000 2005 2010Other (history unknown)Total new and relapse 318 949 Total cases notifi ed 321 308New casesSMEAR-NEGATIVE/SMEAR-POSITIVE UNKNOWN/NOT DONE EXTRAPULMONARYM:F ratio 1.5 1.3 0.9Age < 15 1 714 23 469 2 776Laboratories 2011Smear (per 100 000 population) 2.3Culture (per 5 million population) 0.9Drug susceptibility testing (per 5 million population) 0.1Is second-line drug susceptibility testing available?Yes, in countryIs there a national reference laboratory?YesTreatment success rate 2010 (%)New smear-positiveIs rifampicin used throughout(and/or culture-positive) 90 treatment for new patients? YesNew smear-negative/extrapulmonary 86Retreatment 73TB/HIV 2011 NUMBER (%)TB patients with known HIV status 3 511 (1)HIV-positive TB patients 1 280 (36)HIV-positive TB patients on co-trimoxazole preventive therapy (CPT) 1 182 (92)HIV-positive TB patients on antiretroviral therapy (ART) 544 (43)HIV-positive people screened for TBHIV-positive people provided with IPTEstimates of MDR-TB burden 2011 a NEW RETREATMENT% of TB cases with MDR-TB 1.9 (1.4–2.5) 12 (8.1–17)MDR-TB cases among notifi edpulmonary TB cases 5 700 (4 200–7 500) 920 (620–1 300)<strong>Report</strong>ed cases of MDR-TB 2011 NEW RETREATMENT TOTALCases tested for MDR-TB 5 (
KENYAPopulation 2011 42 millionHIGH TB BURDEN | HIGH HIV BURDENEstimates of TB burden a 2011NUMBER (thousands) RATE (per 100 000 population)Mortality (excludes HIV+TB) 9.2 (4.7–15) 22 (11–36)Prevalence (includes HIV+TB) 120 (63–200) 291 (152–475)Incidence (includes HIV+TB) 120 (110–120) 288 (276–300)Incidence (HIV+TB) 47 (45–49) 113 (109–118)Case detection, all forms (%) 81 (78–85)TB case notifications 2011NEW CASES (%) RETREATMENT CASES (%)Smear-positive 37 085 (39) Relapse 3 356 (34)Smear-negative 30 394 (32) Treatment after failure 263 (3)Smear-unknown/not done 9 416 (10) Treatment after defaultExtrapulmonary 17 069 (18) Other 6 398 (64)Other 0 (0)Total new 93 964 Total retreatment 10 017Mortality (excludes HIV+TB) (rateper 100 000 population per year)Prevalence(rate per 100 000 population)504030201001990 1995 2000 2005 201050040030020010001990 1995 2000 2005 2010Other (history unknown) 0Total new and relapse 97 320 Total cases notifi ed 103 981New casesSMEAR-NEGATIVE/SMEAR-POSITIVE UNKNOWN/NOT DONE EXTRAPULMONARYM:F ratio 1.6 1.2 1.2Age < 15 985 2 008 2 795Laboratories 2011Smear (per 100 000 population) 3.8Culture (per 5 million population) 0.7Drug susceptibility testing (per 5 million population) 0.1Is second-line drug susceptibility testing available?Is there a national reference laboratory?Treatment success rate 2010 (%)Yes, outside countryNew smear-positiveIs rifampicin used throughout(and/or culture-positive) 87 treatment for new patients? YesNew smear-negative/extrapulmonary 85Retreatment 79TB/HIV 2011 NUMBER (%)TB patients with known HIV status 97 136 (93)HIV-positive TB patients 38 172 (39)HIV-positive TB patients on co-trimoxazole preventive therapy (CPT) 37 147 (97)HIV-positive TB patients on antiretroviral therapy (ART) 24 497 (64)HIV-positive people screened for TBHIV-positive people provided with IPTEstimates of MDR-TB burden 2011 a NEW RETREATMENT% of TB cases with MDR-TB 3.1 (0.10–7.1) 10 (2.1–18)MDR-TB cases among notifi edpulmonary TB cases 2 400 (77–5 500) 1 000 (210–1 800)YesIncidence (rate per 100 000population per year)Treatment success rate (%)Number of patients40030020010001990 1995 2000 2005 201110080604020060 00050 00040 00030 00020 00010 0000Incidence Incidence (HIV+TB) Notifications1996 1998 2000 2002 2004 2006 2008 2010New smear-positive (and/or culture-positive)New smear-negative/extrapulmonaryRetreatment2003 2004 2005 2006 2007 2008 2009 2010 2011<strong>Report</strong>ed cases of MDR-TB 2011 NEW RETREATMENT TOTALHIV-positive TB patients on CPT on ARTCases tested for MDR-TB 92 (
MOZAMBIQUEPopulation 2011 24 millionHIGH TB BURDEN | HIGH HIV BURDENEstimates of TB burden a 2011NUMBER (thousands) RATE (per 100 000 population)Mortality (excludes HIV+TB) 11 (4.0–22) 47 (17–91)Prevalence (includes HIV+TB) 120 (56–200) 490 (235–837)Incidence (includes HIV+TB) 130 (91–180) 548 (380–747)Incidence (HIV+TB) 83 (58–110) 347 (241–473)Case detection, all forms (%) 34 (25–49)TB case notifications 2011NEW CASES (%) RETREATMENT CASES (%)Smear-positive 19 537 (45) Relapse 1 427 (34)Smear-negative 18 159 (42) Treatment after failure 238 (6)Smear-unknown/not done 0 (0) Treatment after default 242 (6)Extrapulmonary 5 504 (13) Other 2 345 (55)Other 0 (0)Total new 43 200 Total retreatment 4 252Mortality (excludes HIV+TB) (rateper 100 000 population per year)Prevalence(rate per 100 000 population)2502001501005001990 1995 2000 2005 2010250020001500100050001990 1995 2000 2005 2010Other (history unknown) 0Total new and relapse 44 627 Total cases notifi ed 47 452New casesSMEAR-NEGATIVE/SMEAR-POSITIVE UNKNOWN/NOT DONE EXTRAPULMONARYM:F ratioAge < 15 324 2 180 710Incidence (rate per 100 000population per year)12001000800600400200Laboratories 2011Smear (per 100 000 population) 1.8Culture (per 5 million population) 0.4Drug susceptibility testing (per 5 million population) 0.4Is second-line drug susceptibility testing available?Yes, in and outside countryIs there a national reference laboratory?YesTreatment success rate 2010 (%)New smear-positiveIs rifampicin used throughout(and/or culture-positive) 85 treatment for new patients? YesNew smear-negative/extrapulmonaryRetreatmentTB/HIV 2011 NUMBER (%)TB patients with known HIV status 41 896 (88)HIV-positive TB patients 26 538 (63)HIV-positive TB patients on co-trimoxazole preventive therapy (CPT) 24 095 (91)HIV-positive TB patients on antiretroviral therapy (ART) 7 661 (29)HIV-positive people screened for TBHIV-positive people provided with IPT 17 064Estimates of MDR-TB burden 2011 a NEW RETREATMENT% of TB cases with MDR-TB 3.5 (2.2–4.8) 12 (0.0–25)MDR-TB cases among notifi edpulmonary TB cases 1 300 (830–1 800) 510 (0–1 100)<strong>Report</strong>ed cases of MDR-TB 2011 NEW RETREATMENT TOTALCases tested for MDR-TB 206 (1%) 443 (10%) 663Laboratory-confi rmed MDR-TB cases 76 202 283Patients started on MDR-TB treatment 146Treatment success rate (%)Number of patients01990 1995 2000 2005 2011908070605040302010030 00020 00010 000040Incidence Incidence (HIV+TB) Notifications1996 1998 2000 2002 2004 2006 2008 2010New smear-positive (and/or culture-positive)New smear-negative/extrapulmonaryRetreatment2003 2004 2005 2006 2007 2008 2009 2010 2011HIV-positive TB patients on CPT on ARTFinancing TB control 2012 2013Total budget (US$ millions) 37 35Available funding (US$ millions) 8.5 8.1% of budget funded 23 23% available funding from domestic sources 29 24% available funding from the <strong>Global</strong> Fund 42 46US$ millions30201002006 2007 2008 2009 2010 2011 2012 2013aRanges represent uncertainty intervals.Total budgetAvailable fundingGLOBAL TUBERCULOSIS REPORT 2012 Data can be downloaded from www.who.int/tb/data 117
MYANMARPopulation 2011 48 millionHIGH TB BURDEN | HIGH HIV BURDEN | HIGH MDR-TB BURDENEstimates of TB burden a 2011NUMBER (thousands) RATE (per 100 000 population)Mortality (excludes HIV+TB) 23 (11–40) 48 (22–84)Prevalence (includes HIV+TB) 240 (190–310) 506 (390–637)Incidence (includes HIV+TB) 180 (160–210) 381 (326–439)Incidence (HIV+TB) 18 (15–22) 38 (31–45)Case detection, all forms (%) 74 (64–87)Mortality (excludes HIV+TB) (rateper 100 000 population per year)2001501005001990 1995 2000 2005 2010TB case notifications 2011NEW CASES (%) RETREATMENT CASES (%)Smear-positive 42 324 (32) Relapse 4 606 (42)Smear-negative 62 038 (47) Treatment after failure 1 525 (14)Smear-unknown/not done Treatment after default 542 (5)Extrapulmonary 27 769 (21) Other 4 336 (39)OtherTotal new 132 131 Total retreatment 11 009Prevalence(rate per 100 000 population)1500100050001990 1995 2000 2005 2010Other (history unknown)Total new and relapse 136 737 Total cases notifi ed 143 140New casesM:F ratio 1.9Age < 15 307SMEAR-NEGATIVE/SMEAR-POSITIVE UNKNOWN/NOT DONE EXTRAPULMONARYLaboratories 2011Smear (per 100 000 population) 0.9Culture (per 5 million population) 0.2Drug susceptibility testing (per 5 million population) 0.2Is second-line drug susceptibility testing available?Is there a national reference laboratory?Treatment success rate 2010 (%)Yes, outside countryNew smear-positiveIs rifampicin used throughout(and/or culture-positive) 86 treatment for new patients? YesNew smear-negative/extrapulmonary 89Retreatment 73YesIncidence (rate per 100 000population per year)Treatment success rate (%)50040030020010001990 1995 2000 2005 2011Incidence Incidence (HIV+TB) Notifications1008060402001996 1998 2000 2002 2004 2006 2008 2010TB/HIV 2011 NUMBER (%)TB patients with known HIV status 4 496 (3)HIV-positive TB patients 900 (20)HIV-positive TB patients on co-trimoxazole preventive therapy (CPT) 900 (100)HIV-positive TB patients on antiretroviral therapy (ART) 724 (80)HIV-positive people screened for TB 12 120HIV-positive people provided with IPT 361Estimates of MDR-TB burden 2011 a NEW RETREATMENT% of TB cases with MDR-TB 4.2 (3.1–5.6) 10 (6.9–14)MDR-TB cases among notifi edpulmonary TB cases 4 400 (3 200–5 800) 1 100 (760–1 500)Number of patients6000500040003000200010000New smear-positive (and/or culture-positive) RetreatmentNew smear-negative/extrapulmonary2003 2004 2005 2006 2007 2008 2009 2010 2011<strong>Report</strong>ed cases of MDR-TB 2011 NEW RETREATMENT TOTALHIV-positive TB patients on CPT on ARTCases tested for MDR-TBLaboratory-confi rmed MDR-TB cases 690Patients started on MDR-TB treatment 163Financing TB control 2012 2013Total budget (US$ millions) 29 31Available funding (US$ millions) 10 9.3% of budget funded 34 30% available funding from domestic sources 7% available funding from the <strong>Global</strong> Fund 79 89US$ millions353025201510502006 2007 2008 2009 2010 2011 2012 2013aRanges represent uncertainty intervals.Total budgetAvailable funding118 Data can be downloaded from www.who.int/tb/data GLOBAL TUBERCULOSIS REPORT 2012
NIGERIAPopulation 2011 162 millionHIGH TB BURDEN | HIGH HIV BURDEN | HIGH MDR-TB BURDENEstimates of TB burden a 2011NUMBER (thousands) RATE (per 100 000 population)Mortality (excludes HIV+TB) 27 (6.1–64) 17 (3.7–40)Prevalence (includes HIV+TB) 280 (71–620) 171 (44–382)Incidence (includes HIV+TB) 190 (90–330) 118 (55–204)Incidence (HIV+TB) 50 (23–86) 30 (14–53)Case detection, all forms (%) 45 (26–96)TB case notifications 2011NEW CASES (%) RETREATMENT CASES (%)Smear-positive 47 436 (56) Relapse 2 515 (29)Smear-negative 33 034 (39) Treatment after failure 719 (8)Smear-unknown/not done 0 (0) Treatment after default 1 587 (18)Extrapulmonary 3 793 (5) Other 3 966 (45)Other 0 (0)Total new 84 263 Total retreatment 8 787Mortality (excludes HIV+TB) (rateper 100 000 population per year)Prevalence(rate per 100 000 population)1201008060402001990 1995 2000 2005 20101200100080060040020001990 1995 2000 2005 2010Other (history unknown) 0Total new and relapse 86 778 Total cases notifi ed 93 050New casesSMEAR-NEGATIVE/SMEAR-POSITIVE UNKNOWN/NOT DONE EXTRAPULMONARYM:F ratio 1.6Age < 15 1 107Incidence (rate per 100 000population per year)700600500400300200100Laboratories 2011Smear (per 100 000 population) 0.8Culture (per 5 million population) 0.2Drug susceptibility testing (per 5 million population) 0.1Is second-line drug susceptibility testing available?Yes, outside countryIs there a national reference laboratory?YesTreatment success rate 2010 (%)New smear-positiveIs rifampicin used throughout(and/or culture-positive) 84 treatment for new patients? YesNew smear-negative/extrapulmonary 77Retreatment 82TB/HIV 2011 NUMBER (%)TB patients with known HIV status 75 772 (81)HIV-positive TB patients 19 553 (26)HIV-positive TB patients on co-trimoxazole preventive therapy (CPT) 13 301 (68)HIV-positive TB patients on antiretroviral therapy (ART) 8 410 (43)HIV-positive people screened for TB 223 933HIV-positive people provided with IPT 969Estimates of MDR-TB burden 2011 a NEW RETREATMENT% of TB cases with MDR-TB 3.1 (0.10–7.1) 10 (2.1–18)MDR-TB cases among notifi edpulmonary TB cases 2 500 (80–5 700) 890 (180–1 600)<strong>Report</strong>ed cases of MDR-TB 2011 NEW RETREATMENT TOTALCases tested for MDR-TB 12 (
PAKISTANPopulation 2011 177 millionHIGH TB BURDEN | HIGH MDR-TB BURDENEstimates of TB burden a 2011NUMBER (thousands) RATE (per 100 000 population)Mortality (excludes HIV+TB) 59 (26–110) 33 (15–60)Prevalence (includes HIV+TB) 620 (280–1 100) 350 (158–618)Incidence (includes HIV+TB) 410 (340–490) 231 (190–276)Incidence (HIV+TB) 1.5 (0.99–2.1) 0.84 (0.56–1.2)Case detection, all forms (%) 64 (54–78)TB case notifications 2011NEW CASES (%) RETREATMENT CASES (%)Smear-positive 105 733 (41) Relapse 5 947 (52)Smear-negative 103 824 (41) Treatment after failure 896 (8)Smear-unknown/not done 0 (0) Treatment after default 1 282 (11)Extrapulmonary 45 537 (18) Other 3 282 (29)Other 0 (0)Total new 255 094 Total retreatment 11 407Mortality (excludes HIV+TB) (rateper 100 000 population per year)Prevalence(rate per 100 000 population)1005001990 1995 2000 2005 2010100080060040020001990 1995 2000 2005 2010Other (history unknown) 3 893Total new and relapse 261 041 Total cases notifi ed 270 394New casesSMEAR-NEGATIVE/SMEAR-POSITIVE UNKNOWN/NOT DONE EXTRAPULMONARYM:F ratio 1.1 1.0 0.8Age < 15 3 895 14 142 7 696Laboratories 2011Smear (per 100 000 population) 0.7Culture (per 5 million population) 0.3Drug susceptibility testing (per 5 million population) 0.3Is second-line drug susceptibility testing available?Yes, in countryIs there a national reference laboratory?YesTreatment success rate 2010 (%)New smear-positiveIs rifampicin used throughout(and/or culture-positive) 91 treatment for new patients? YesNew smear-negative/extrapulmonary 90Retreatment 84Incidence (rate per 100 000population per year)Treatment success rate (%)30020010001990 1995 2000 2005 2011Incidence Incidence (HIV+TB) Notifications1008060402001996 1998 2000 2002 2004 2006 2008 2010TB/HIV 2011 NUMBER (%)TB patients with known HIV status 8 322 (3)HIV-positive TB patients 33 (
PHILIPPINESPopulation 2011 95 millionHIGH TB BURDEN | HIGH MDR-TB BURDENEstimates of TB burden a 2011NUMBER (thousands) RATE (per 100 000 population)Mortality (excludes HIV+TB) 28 (25–31) 29 (26–33)Prevalence (includes HIV+TB) 460 (400–520) 484 (425–546)Incidence (includes HIV+TB) 260 (210–310) 270 (223–322)Incidence (HIV+TB) 1.1 (0.65–1.6) 1.1 (0.68–1.7)Case detection, all forms (%) 75 (63–91)TB case notifications 2011NEW CASES (%) RETREATMENT CASES (%)Smear-positive 90 876 (48) Relapse 3 190 (23)Smear-negative 95 297 (51) Treatment after failure 468 (3)Smear-unknown/not done Treatment after default 896 (7)Extrapulmonary 2 202 (1) Other 9 104 (67)Other 0 (0)Total new 188 375 Total retreatment 13 658Mortality (excludes HIV+TB) (rateper 100 000 population per year)Prevalence(rate per 100 000 population)60504030201001990 1995 2000 2005 20101200100080060040020001990 1995 2000 2005 2010Other (history unknown) 0Total new and relapse 191 565 Total cases notifi ed 202 033New casesSMEAR-NEGATIVE/SMEAR-POSITIVE UNKNOWN/NOT DONE EXTRAPULMONARYM:F ratio 2.4Age < 15 953Laboratories 2011Smear (per 100 000 population) 2.1Culture (per 5 million population) 0.5Drug susceptibility testing (per 5 million population) 0.1Is second-line drug susceptibility testing available?Yes, in countryIs there a national reference laboratory?YesTreatment success rate 2010 (%)New smear-positiveIs rifampicin used throughout(and/or culture-positive) 91 treatment for new patients? YesNew smear-negative/extrapulmonary 88Retreatment 69TB/HIV 2011 NUMBER (%)TB patients with known HIV status 3 917 (2)HIV-positive TB patients 9 (
RUSSIAN FEDERATIONPopulation 2011 143 millionHIGH TB BURDEN | HIGH HIV BURDEN | HIGH MDR-TB BURDENEstimates of TB burden a 2011NUMBER (thousands) RATE (per 100 000 population)Mortality (excludes HIV+TB) 22 (22–23) 16 (15–16)Prevalence (includes HIV+TB) 180 (72–330) 124 (50–229)Incidence (includes HIV+TB) 140 (120–160) 97 (82–114)Incidence (HIV+TB) 9.3 (7.4–11) 6.5 (5.1–8.0)Case detection, all forms (%) 81 (70–96)TB case notifications 2011NEW CASES (%) RETREATMENT CASES (%)Smear-positive 29 191 (28) Relapse 8 590 (16)Smear-negative 63 917 (61) Treatment after failure 9 879 (18)Smear-unknown/not done 1 189 (1) Treatment after default 2 745 (5)Extrapulmonary 10 023 (10) Other 33 945 (62)OtherTotal new 104 320 Total retreatment 55 159Mortality (excludes HIV+TB) (rateper 100 000 population per year)Prevalence(rate per 100 000 population)201510501990 1995 2000 2005 201030020010001990 1995 2000 2005 2010Other (history unknown)Total new and relapse 112 910 Total cases notifi ed 159 479New casesSMEAR-NEGATIVE/SMEAR-POSITIVE UNKNOWN/NOT DONE EXTRAPULMONARYM:F ratio 2.7 2.2 1.3Age < 15 51 593 2 901Laboratories 2011Smear (per 100 000 population) 2.6Culture (per 5 million population) 4.1Drug susceptibility testing (per 5 million population)Is second-line drug susceptibility testing available?Yes, in countryIs there a national reference laboratory?NoTreatment success rate 2010 (%)New smear-positiveIs rifampicin used throughout(and/or culture-positive) 53 treatment for new patients? YesNew smear-negative/extrapulmonary 73Retreatment 34Incidence (rate per 100 000population per year)Treatment success rate (%)1501005001990 1995 2000 2005 2011Incidence Incidence (HIV+TB) Notifications8060402001996 1998 2000 2002 2004 2006 2008 2010TB/HIV 2011 NUMBER (%)TB patients with known HIV status b 79 494HIV-positive TB patients 4 104New smear-positive (and/or culture-positive)New smear-negative/extrapulmonaryRetreatmentEstimates of MDR-TB burden 2011 a NEW RETREATMENT8000% of TB cases with MDR-TB 20 (18–22) 46 (41–52)MDR-TB cases among notifi edpulmonary TB cases 19 000 (17 000–21 000) 25 000 (23 000–29 000)<strong>Report</strong>ed cases of MDR-TB 2011 NEW RETREATMENT TOTALCases tested for MDR-TB 34 007 (78%) 13 620 (25%) 47 627Laboratory-confi rmed MDR-TB cases 6 596 7 189 13 785Patients started on MDR-TB treatment 18 902Number of patients60004000200002003 2004 2005 2006 2007 2008 2009 2010 2011HIV-positive TB patients on CPT on ARTFinancing TB control c 2012 2013Total budget (US$ millions) 1 204Available funding (US$ millions) 1 2041400% of budget funded 100% available funding from domestic sources 100% available funding from the <strong>Global</strong> Fund 0aRanges represent uncertainty intervals.bThe reported number of TB patients with known HIV status is for new TB patients only. It was not possibleto calculate the percentage of all TB patients with known HIV status.c Funding of US$ 340 million is available from the budgets of the Federal Targeted Program and NationalProject “Health” in 2012. The remaining funding is from local (oblast) and other budgets and wasestimated using data reported to WHO in previous years. Estimates of non-federal and other sources offunding will be reviewed in 2013.US$ millions1200100080060040020002006 2007 2008 2009 2010 2011 2012 2013Total budget Available funding122 Data can be downloaded from www.who.int/tb/data GLOBAL TUBERCULOSIS REPORT 2012
SOUTH AFRICAPopulation 2011 50 millionHIGH TB BURDEN | HIGH HIV BURDEN | HIGH MDR-TB BURDENEstimates of TB burden a 2011NUMBER (thousands) RATE (per 100 000 population)Mortality (excludes HIV+TB) 25 (11–44) 49 (21–87)Prevalence (includes HIV+TB) 390 (200–630) 768 (399–1 250)Incidence (includes HIV+TB) 500 (410–600) 993 (819–1 180)Incidence (HIV+TB) 330 (270–390) 650 (536–774)Case detection, all forms (%) 69 (58–83)TB case notifications 2011NEW CASES (%) RETREATMENT CASES (%)Smear-positive 129 770 (40) Relapse 18 394 (40)Smear-negative 70 341 (22) Treatment after failure 2 578 (6)Smear-unknown/not done 77 925 (24) Treatment after default 4 642 (10)Extrapulmonary 47 285 (15) Other 20 301 (44)Other 0 (0)Total new 325 321 Total retreatment 45 915Mortality (excludes HIV+TB) (rateper 100 000 population per year)Prevalence(rate per 100 000 population)1008060402001990 1995 2000 2005 20101200100080060040020001990 1995 2000 2005 2010Other (history unknown) 18 738Total new and relapse 343 715 Total cases notifi ed 389 974New casesSMEAR-NEGATIVE/SMEAR-POSITIVE UNKNOWN/NOT DONE EXTRAPULMONARYM:F ratio 1.2 1.0 1.0Age < 15 3 404 32 080 2 399Laboratories 2011Smear (per 100 000 population) 0.5Culture (per 5 million population) 1.5Drug susceptibility testing (per 5 million population) 1.5Is second-line drug susceptibility testing available?Yes, in countryIs there a national reference laboratory?YesTreatment success rate 2010 b (%)New smear-positiveIs rifampicin used throughout(and/or culture-positive) 79 treatment for new patients? YesNew smear-negative/extrapulmonary 37Retreatment 35TB/HIV 2011 NUMBER (%)TB patients with known HIV status 323 440 (83)HIV-positive TB patients 211 800 (65)HIV-positive TB patients on co-trimoxazole preventive therapy (CPT) 161 298 (76)HIV-positive TB patients on antiretroviral therapy (ART) 92 376 (44)HIV-positive people screened for TB 1 256 212HIV-positive people provided with IPT 372 994Estimates of MDR-TB burden 2011 a NEW RETREATMENT% of TB cases with MDR-TB 1.8 (1.4–2.3) 6.7 (5.5–8.1)MDR-TB cases among notifi edpulmonary TB cases 5 000 (4 000–6 300) 3 100 (2 500–3 700)<strong>Report</strong>ed cases of MDR-TB 2011 NEW RETREATMENT TOTALCases tested for MDR-TB 33 576Laboratory-confi rmed MDR-TB cases 10 085Patients started on MDR-TB treatment 5 643Financing TB control 2012 2013Total budget (US$ millions)Available funding (US$ millions)% of budget funded% available funding from domestic sources% available funding from the <strong>Global</strong> FundabRanges represent uncertainty intervals.Treatment success rates are based on incomplete data.Incidence (rate per 100 000population per year)Treatment success rate (%)Number of patientsUS$ millions14001200100080060040020001990 1995 2000 2005 2011908070605040302010025 000020 000015 000010 000050 0000450400350300250200150100500Incidence Incidence (HIV+TB) Notifications1996 1998 2000 2002 2004 2006 2008 2010New smear-positive (and/or culture-positive)New smear-negative/extrapulmonaryRetreatment2003 2004 2005 2006 2007 2008 2009 2010 2011HIV-positive TB patients on CPT on ART2006 2007 2008 2009 2010 2011 2012 2013Total budgetAvailable fundingGLOBAL TUBERCULOSIS REPORT 2012 Data can be downloaded from www.who.int/tb/data 123
THAILANDPopulation 2011 70 millionHIGH TB BURDEN | HIGH HIV BURDENEstimates of TB burden a 2011NUMBER (thousands) RATE (per 100 000 population)Mortality (excludes HIV+TB) 9.8 (4.2–18) 14 (6.1–25)Prevalence (includes HIV+TB) 110 (51–200) 161 (73–282)Incidence (includes HIV+TB) 86 (71–100) 124 (102–147)Incidence (HIV+TB) 13 (10–15) 18 (15–22)Case detection, all forms (%) 76 (64–93)TB case notifications 2011NEW CASES (%) RETREATMENT CASES (%)Smear-positive 33 169 (52) Relapse 1 915 (51)Smear-negative 20 726 (32) Treatment after failure 406 (11)Smear-unknown/not done Treatment after default 556 (15)Extrapulmonary 10 014 (16) Other 890 (24)Other 0 (0)Total new 63 909 Total retreatment 3 767Mortality (excludes HIV+TB) (rateper 100 000 population per year)Prevalence(rate per 100 000 population)504030201001990 1995 2000 2005 201040030020010001990 1995 2000 2005 2010Other (history unknown) 0Total new and relapse 65 824 Total cases notifi ed 67 676New casesM:F ratio 2.4Age < 15 114SMEAR-NEGATIVE/SMEAR-POSITIVE UNKNOWN/NOT DONE EXTRAPULMONARYLaboratories 2011Smear (per 100 000 population) 1.6Culture (per 5 million population) 4.7Drug susceptibility testing (per 5 million population) 1.1Is second-line drug susceptibility testing available?Is there a national reference laboratory?Treatment success rate 2010 (%)Yes, in and outside countryNew smear-positiveIs rifampicin used throughout(and/or culture-positive) 85 treatment for new patients? YesNew smear-negative/extrapulmonary 79Retreatment 66YesIncidence (rate per 100 000population per year)Treatment success rate (%)2001501005001990 1995 2000 2005 2011Incidence Incidence (HIV+TB) Notifications1008060402001996 1998 2000 2002 2004 2006 2008 2010TB/HIV 2011 NUMBER (%)TB patients with known HIV status 49 770 (74)HIV-positive TB patients 7 326 (15)HIV-positive TB patients on co-trimoxazole preventive therapy (CPT) 5 509 (75)HIV-positive TB patients on antiretroviral therapy (ART) 4 348 (59)HIV-positive people screened for TB 41 131HIV-positive people provided with IPTEstimates of MDR-TB burden 2011 a NEW RETREATMENT% of TB cases with MDR-TB 1.7 (1.0–2.6) 35 (28–42)MDR-TB cases among notifi edpulmonary TB cases 890 (540–1 400) 1 300 (1 000–1 600)Number of patients10 00080006000400020000New smear-positive (and/or culture-positive) RetreatmentNew smear-negative/extrapulmonary2003 2004 2005 2006 2007 2008 2009 2010 2011<strong>Report</strong>ed cases of MDR-TB 2011 NEW RETREATMENT TOTALHIV-positive TB patients on CPT on ARTCases tested for MDR-TB 4 939Laboratory-confi rmed MDR-TB cases 510Patients started on MDR-TB treatment 12360Financing TB control 2012 2013Total budget (US$ millions) 44 44Available funding (US$ millions) 41 41% of budget funded 94 94% available funding from domestic sources 98 98% available funding from the <strong>Global</strong> Fund 2 2US$ millions504030201002006 2007 2008 2009 2010 2011 2012 2013aRanges represent uncertainty intervals.Total budgetAvailable funding124 Data can be downloaded from www.who.int/tb/data GLOBAL TUBERCULOSIS REPORT 2012
UGANDAPopulation 2011 35 millionHIGH TB BURDEN | HIGH HIV BURDENEstimates of TB burden a 2011NUMBER (thousands) RATE (per 100 000 population)Mortality (excludes HIV+TB) 5.0 (2.1–9.0) 14 (6.2–26)Prevalence (includes HIV+TB) 63 (33–100) 183 (95–298)Incidence (includes HIV+TB) 67 (54–81) 193 (156–234)Incidence (HIV+TB) 35 (28–42) 102 (82–123)Case detection, all forms (%) 69 (57–86)TB case notifications 2011NEW CASES (%) RETREATMENT CASES (%)Smear-positive 25 614 (57) Relapse 1 302 (32)Smear-negative 12 830 (29) Treatment after failure 306 (8)Smear-unknown/not done 1 559 (3) Treatment after default 1 206 (30)Extrapulmonary 5 001 (11) Other 1 198 (30)OtherTotal new 45 004 Total retreatment 4 012Mortality (excludes HIV+TB) (rateper 100 000 population per year)Prevalence(rate per 100 000 population)8060402001990 1995 2000 2005 201080060040020001990 1995 2000 2005 2010Other (history unknown)Total new and relapse 46 306 Total cases notifi ed 49 016New casesSMEAR-NEGATIVE/SMEAR-POSITIVE UNKNOWN/NOT DONE EXTRAPULMONARYM:F ratio 1.8Age < 15 695Incidence (rate per 100 000population per year)12001000800600400200Laboratories 2011Smear (per 100 000 population) 3.1Culture (per 5 million population) 1.0Drug susceptibility testing (per 5 million population) 1.2Is second-line drug susceptibility testing available?Yes, in countryIs there a national reference laboratory?YesTreatment success rate 2010 (%)New smear-positiveIs rifampicin used throughout(and/or culture-positive) 71 treatment for new patients? YesNew smear-negative/extrapulmonary 62Retreatment 65TB/HIV 2011 NUMBER (%)TB patients with known HIV status 39 394 (80)HIV-positive TB patients 20 725 (53)HIV-positive TB patients on co-trimoxazole preventive therapy (CPT) 19 258 (93)HIV-positive TB patients on antiretroviral therapy (ART) 6 720 (32)HIV-positive people screened for TB 553 057HIV-positive people provided with IPTEstimates of MDR-TB burden 2011 a NEW RETREATMENT% of TB cases with MDR-TB 1.4 (0.60–2.2) 12 (6.8–19)MDR-TB cases among notifi edpulmonary TB cases 560 (240–900) 480 (270–780)<strong>Report</strong>ed cases of MDR-TB 2011 NEW RETREATMENT TOTALCases tested for MDR-TB 316 (1%) 360 (9%) 797Laboratory-confi rmed MDR-TB cases 7 43 71Patients started on MDR-TB treatment 7Treatment success rate (%)Number of patients01990 1995 2000 2005 2011908070605040302010025 00020 00015 00010 0005000025Incidence Incidence (HIV+TB) Notifications1996 1998 2000 2002 2004 2006 2008 2010New smear-positive (and/or culture-positive)New smear-negative/extrapulmonaryRetreatment2003 2004 2005 2006 2007 2008 2009 2010 2011HIV-positive TB patients on CPT on ARTFinancing TB control 2012 2013Total budget (US$ millions) 20Available funding (US$ millions) 6.2% of budget funded 31% available funding from domestic sources 5% available funding from the <strong>Global</strong> Fund 56US$ millions201510502006 2007 2008 2009 2010 2011 2012 2013aRanges represent uncertainty intervals.Total budgetAvailable fundingGLOBAL TUBERCULOSIS REPORT 2012 Data can be downloaded from www.who.int/tb/data 125
UNITED REPUBLIC OF TANZANIAPopulation 2011 46 millionHIGH TB BURDEN | HIGH HIV BURDENEstimates of TB burden a 2011NUMBER (thousands) RATE (per 100 000 population)Mortality (excludes HIV+TB) 6.4 (3.3–11) 14 (7.1–23)Prevalence (includes HIV+TB) 82 (43–130) 177 (93–286)Incidence (includes HIV+TB) 78 (73–83) 169 (159–180)Incidence (HIV+TB) 30 (28–32) 65 (61–69)Case detection, all forms (%) 76 (71–81)TB case notifications 2011NEW CASES (%) RETREATMENT CASES (%)Smear-positive 24 115 (41) Relapse 1 079 (38)Smear-negative 20 438 (35) Treatment after failure 144 (5)Smear-unknown/not done 0 (0) Treatment after default 212 (7)Extrapulmonary 13 725 (24) Other 1 435 (50)Other 0 (0)Total new 58 278 Total retreatment 2 870Mortality (excludes HIV+TB) (rateper 100 000 population per year)Prevalence(rate per 100 000 population)60504030201001990 1995 2000 2005 201050040030020010001990 1995 2000 2005 2010Other (history unknown) 0Total new and relapse 59 357 Total cases notifi ed 61 148New casesSMEAR-NEGATIVE/SMEAR-POSITIVE UNKNOWN/NOT DONE EXTRAPULMONARYM:F ratio 1.8 1.3 1.1Age < 15 411 2 317 2 155Incidence (rate per 100 000population per year)30025020015010050Laboratories 2011Smear (per 100 000 population) 2.0Culture (per 5 million population) 0.5Drug susceptibility testing (per 5 million population) 0.1Is second-line drug susceptibility testing available?Yes, in and outside countryIs there a national reference laboratory?YesTreatment success rate 2010 (%)New smear-positiveIs rifampicin used throughout(and/or culture-positive) 90 treatment for new patients? YesNew smear-negative/extrapulmonary 89Retreatment 84TB/HIV 2011 NUMBER (%)TB patients with known HIV status 53 531 (88)HIV-positive TB patients 20 525 (38)HIV-positive TB patients on co-trimoxazole preventive therapy (CPT) 19 499 (95)HIV-positive TB patients on antiretroviral therapy (ART) 7 706 (38)HIV-positive people screened for TB 148 177HIV-positive people provided with IPTEstimates of MDR-TB burden 2011 a NEW RETREATMENT% of TB cases with MDR-TB 1.1 (0.30–2.8) 0.0 (0.0–7.3)MDR-TB cases among notifi edpulmonary TB cases 480 (130–1 200) 0 (0–210)<strong>Report</strong>ed cases of MDR-TB 2011 NEW RETREATMENT TOTALCases tested for MDR-TB 83 (
VIET NAMPopulation 2011 89 millionHIGH TB BURDEN | HIGH HIV BURDEN | HIGH MDR-TB BURDENEstimates of TB burden a 2011NUMBER (thousands) RATE (per 100 000 population)Mortality (excludes HIV+TB) 30 (12–55) 33 (14–62)Prevalence (includes HIV+TB) 290 (130–500) 323 (148–563)Incidence (includes HIV+TB) 180 (140–220) 199 (153–250)Incidence (HIV+TB) 14 (11–18) 16 (12–20)Case detection, all forms (%) 56 (44–73)TB case notifications 2011NEW CASES (%) RETREATMENT CASES (%)Smear-positive 50 719 (55) Relapse 6 925 (80)Smear-negative 20 205 (22) Treatment after failure 621 (7)Smear-unknown/not done Treatment after default 376 (4)Extrapulmonary 17 934 (20) Other 717 (8)Other 2 679 (3)Total new 91 537 Total retreatment 8 639Mortality (excludes HIV+TB) (rateper 100 000 population per year)Prevalence(rate per 100 000 population)8060402001990 1995 2000 2005 201060040020001990 1995 2000 2005 2010Other (history unknown)Total new and relapse 98 462 Total cases notifi ed 100 176New casesM:F ratio 3.0Age < 15 95SMEAR-NEGATIVE/SMEAR-POSITIVE UNKNOWN/NOT DONE EXTRAPULMONARYLaboratories 2011Smear (per 100 000 population) 0.9Culture (per 5 million population) 1.4Drug susceptibility testing (per 5 million population) 0.1Is second-line drug susceptibility testing available?Is there a national reference laboratory?Treatment success rate 2010 (%)Yes, in countryNew smear-positiveIs rifampicin used throughout(and/or culture-positive) 92 treatment for new patients? NoNew smear-negative/extrapulmonary 92Retreatment 69YesIncidence (rate per 100 000population per year)Treatment success rate (%)2502001501005001990 1995 2000 2005 2011Incidence Incidence (HIV+TB) Notifications1008060402001996 1998 2000 2002 2004 2006 2008 2010TB/HIV 2011 NUMBER (%)TB patients with known HIV status 59 094 (59)HIV-positive TB patients 4 713 (8)HIV-positive TB patients on co-trimoxazole preventive therapy (CPT) 3 396 (72)HIV-positive TB patients on antiretroviral therapy (ART) 2 258 (48)HIV-positive people screened for TBHIV-positive people provided with IPTEstimates of MDR-TB burden 2011 a NEW RETREATMENT% of TB cases with MDR-TB 2.7 (2.0–3.6) 19 (14–25)MDR-TB cases among notifi edpulmonary TB cases 2 000 (1 500–2 700) 1 700 (1 200–2 200)Number of patients70006000500040003000200010000New smear-positive (and/or culture-positive) RetreatmentNew smear-negative/extrapulmonary2003 2004 2005 2006 2007 2008 2009 2010 2011<strong>Report</strong>ed cases of MDR-TB 2011 NEW RETREATMENT TOTALHIV-positive TB patients on CPT on ARTCases tested for MDR-TBLaboratory-confi rmed MDR-TB cases 601Patients started on MDR-TB treatment 57880Financing TB control 2012 2013Total budget (US$ millions) 73 63Available funding (US$ millions) 16 18% of budget funded 22 29% available funding from domestic sources 32% available funding from the <strong>Global</strong> Fund 68 69US$ millions60402002006 2007 2008 2009 2010 2011 2012 2013aRanges represent uncertainty intervals.Total budgetAvailable fundingGLOBAL TUBERCULOSIS REPORT 2012 Data can be downloaded from www.who.int/tb/data 127
ZIMBABWEPopulation 2011 13 millionHIGH TB BURDEN | HIGH HIV BURDENEstimates of TB burden a 2011NUMBER (thousands) RATE (per 100 000 population)Mortality (excludes HIV+TB) 6.0 (2.4–11) 47 (19–88)Prevalence (includes HIV+TB) 70 (37–110) 547 (287–889)Incidence (includes HIV+TB) 77 (59–96) 603 (466–757)Incidence (HIV+TB) 46 (36–58) 360 (279–452)Case detection, all forms (%) 50 (40–65)TB case notifications 2011NEW CASES (%) RETREATMENT CASES (%)Smear-positive 12 596 (34) Relapse 1 444 (33)Smear-negative 15 303 (41) Treatment after failure 176 (4)Smear-unknown/not done 3 869 (10) Treatment after default 152 (3)Extrapulmonary 5 192 (14) Other 2 573 (59)Other 0 (0)Total new 36 960 Total retreatment 4 345Mortality (excludes HIV+TB) (rateper 100 000 population per year)Prevalence(rate per 100 000 population)8060402001990 1995 2000 2005 201080060040020001990 1995 2000 2005 2010Other (history unknown) 0Total new and relapse 38 404 Total cases notifi ed 41 305New casesSMEAR-NEGATIVE/SMEAR-POSITIVE UNKNOWN/NOT DONE EXTRAPULMONARYM:F ratio 1.2 1.1 1.1Age < 15 326 2 635 459Laboratories 2011Smear (per 100 000 population) 1.2Culture (per 5 million population) 0.8Drug susceptibility testing (per 5 million population) 0.8Is second-line drug susceptibility testing available?NoIs there a national reference laboratory?YesTreatment success rate 2010 (%)New smear-positiveIs rifampicin used throughout(and/or culture-positive) 81 treatment for new patients? YesNew smear-negative/extrapulmonary 75Retreatment 74TB/HIV 2011 NUMBER (%)TB patients with known HIV status 35 361 (86)HIV-positive TB patients 21 125 (60)HIV-positive TB patients on co-trimoxazole preventive therapy (CPT) 6 203 (29)HIV-positive TB patients on antiretroviral therapy (ART) 14 090 (67)HIV-positive people screened for TBHIV-positive people provided with IPTEstimates of MDR-TB burden 2011 a NEW RETREATMENT% of TB cases with MDR-TB 1.9 (1.0–3.3) 8.3 (1.8–22)MDR-TB cases among notifi edpulmonary TB cases 610 (330–1 000) 360 (76–980)Incidence (rate per 100 000population per year)Treatment success rate (%)Number of patients100080060040020001990 1995 2000 2005 2011908070605040302010035 00030 00025 00020 00015 00010 00050000Incidence Incidence (HIV+TB) Notifications1996 1998 2000 2002 2004 2006 2008 2010New smear-positive (and/or culture-positive)New smear-negative/extrapulmonaryRetreatment2003 2004 2005 2006 2007 2008 2009 2010 2011<strong>Report</strong>ed cases of MDR-TB 2011 NEW RETREATMENT TOTALHIV-positive TB patients on CPT on ARTCases tested for MDR-TB 0 (0%) 0 (0%) 1 197Laboratory-confi rmed MDR-TB cases 0 0 118Patients started on MDR-TB treatment 64Financing TB control 2012 2013Total budget (US$ millions) 40 38Available funding (US$ millions) 14 14% of budget funded 36 37% available funding from domestic sources 17 20% available funding from the <strong>Global</strong> Fund 58 55US$ millions4540353025201510502006 2007 2008 2009 2010 2011 2012 2013aRanges represent uncertainty intervals.Total budgetAvailable funding128 Data can be downloaded from www.who.int/tb/data GLOBAL TUBERCULOSIS REPORT 2012
ANNEX 3Regional profiles
WHO AFRICAN REGIONPopulation 2011 857 millionWHO MEMBER STATES 46Estimates of TB burden a 2011 NUMBER (thousands)RATE (per 100 000 population)Mortality (excludes HIV+TB) 220 (180–270) 26 (21–31)Prevalence (includes HIV+TB) 2 500 (2 100–3 000) 293 (243–347)Incidence (includes HIV+TB) 2 300 (2 100–2 400) 262 (242–283)Incidence (HIV+TB) 870 (800–950) 102 (93–111)Case detection, all forms (%) 61 (56–66)TB case notifications 2011NEW CASES (%) RETREATMENT CASES (%)Smear-positive 605 929 (46) Relapse 52 283 (41)Smear-negative 357 811 (27) Treatment after failure 9 271 (7.3)Smear-unknown/not done 109 258 (8.3) Treatment after default 13 498 (11)Extrapulmonary 240 843 (18) Other 51 853 (41)Other 1 069 (
WHO REGION OF THE AMERICASPopulation 2011 943 millionWHO MEMBER STATES 35OTHER COUNTRIES AND TERRITORIES 11Estimates of TB burden a 2011 NUMBER (thousands)RATE (per 100 000 population)Mortality (excludes HIV+TB) 21 (18–24) 2.2 (1.9–2.5)Prevalence (includes HIV+TB) 330 (250–420) 35 (26–44)Incidence (includes HIV+TB) 260 (240–280) 28 (26–29)Incidence (HIV+TB) 37 (34–40) 3.9 (3.6–4.2)Case detection, all forms (%) 84 (79–89)TB case notifications 2011NEW CASES (%) RETREATMENT CASES (%)Smear-positive 121 130 (59) Relapse 10 004 (46)Smear-negative 36 371 (18) Treatment after failure 1 066 (4.9)Smear-unknown/not done 14 254 (6.9) Treatment after default 6 506 (30)Extrapulmonary 33 757 (16) Other 4 041 (19)Other 1 315 (
WHO EASTERN MEDITERRANEAN REGIONPopulation 2011 609 millionWHO MEMBER STATES 22OTHER COUNTRIES AND TERRITORIES 1Estimates of TB burden a 2011 NUMBER (thousands) RATE (per 100 000 population)Mortality (excludes HIV+TB) 99 (61–150) 16 (10–24)Prevalence (includes HIV+TB) 1 000 (660–1 500) 170 (108–246)Incidence (includes HIV+TB) 660 (590–740) 109 (97–122)Incidence (HIV+TB) 9 (8–10) 1.4 (1.3–1.6)Case detection, all forms (%) 62 (55–70)TB case notifications 2011NEW CASES (%) RETREATMENT CASES (%)Smear-positive 170 748 (43) Relapse 11 223 (53)Smear-negative 128 182 (32) Treatment after failure 1 977 (9.3)Smear-unknown/not done 7 206 (1.8) Treatment after default 2 867 (13)Extrapulmonary 93 605 (23) Other 5 258 (25)Other 623 (
WHO EUROPEAN REGIONPopulation 2011 899 millionWHO MEMBER STATES 53OTHER COUNTRIES AND TERRITORIES 1Estimates of TB burden a 2011 NUMBER (thousands) RATE (per 100 000 population)Mortality (excludes HIV+TB) 45 (44–46) 5 (4.9–5.1)Prevalence (includes HIV+TB) 500 (370–650) 56 (41–73)Incidence (includes HIV+TB) 380 (350–400) 42 (39–45)Incidence (HIV+TB) 23 (20–25) 2.5 (2.2–2.8)Case detection, all forms (%) 73 (69–78)TB case notifications 2011NEW CASES (%) RETREATMENT CASES (%)Smear-positive 79 831 (31) Relapse 22 838 (24)Smear-negative 121 362 (48) Treatment after failure 12 140 (13)Smear-unknown/not done 6 896 (2.7) Treatment after default 4 625 (4.8)Extrapulmonary 42 489 (17) Other 56 531 (59)Other 3 191 (1.3)Total new 253 769 Total retreatment 96 134Mortality (excludes HIV+TB) (rateper 100 000 population per year)Prevalence(rate per 100 000 population)864201990 1995 2000 2005 20101501005001990 1995 2000 2005 2010Other (history unknown) 7 502Total new and relapse 275 872 Total cases notifi ed 356 670New casesSMEAR-NEGATIVE/SMEAR-POSITIVE UNKNOWN/NOT DONE EXTRAPULMONARYM:F ratio 2.3 1.9 1.2age < 15 391 2 850 6 638Laboratories 2011NUMBER OF MEMBER STATES bSmear (per 100 000 population) ≥ 1 8 out of 53Culture (per 5 million population) ≥ 1 30 out of 53Drug susceptibility testing (per 5 million population) ≥ 1 25 out of 53Treatment success rate 2010 (%)New smear-positive (and/or culture-positive) 67New smear-negative/extrapulmonary 78Retreament 51MDR-TB (2009 cohort) 48TB/HIV 2011 NUMBER (%) cTB patients with known HIV status 187 233 (52)HIV-positive TB patients 12 317 (6.5)HIV-positive TB patients on co-trimoxazole preventive therapy (CPT) 828 (64)HIV-positive TB patients on antiretroviral therapy (ART) 3 487 (47)HIV-positive people screened for TB 9 173HIV-positive people provided with IPT 4 565Estimates of MDR-TB burden 2011 a NEW RETREATMENT% of TB cases with MDR-TB 15 (10–20) 44 (40–49)MDR-TB cases among notifi edpulmonary TB cases 32 000 (21 000–42 000) 42 000 (38 000–47 000)<strong>Report</strong>ed cases of MDR-TB 2011 NEW RETREATMENT TOTALCases tested for MDR-TB 69 467 (56%) 25 561 (27%) 99 470Laboratory-confi rmed MDR-TB cases 10 290 12 097 32 348Patients started on MDR-TB treatment 34 769Incidence (rate per 100 000population per year)Treatment success rate (%)Number of patients (thousands)8060402001990 1995 2000 2005 2011Incidence Incidence (HIV+TB) Notifications1008060402001996 1998 2000 2002 2004 2006 2008 2010New smear-positive (and/or culture-positive) RetreatmentNew smear-negative/extrapulmonary16128402004 2005 2006 2007 2008 2009 2010 2011HIV-positive TB patients on CPT on ARTFinancing TB control (low- and middle-income countries) d 2012 2013Total budget (US$ millions) 1 380 1 670Available funding (US$ millions) 1 350 1 550% of budget funded 98 92% available funding from domestic sources 96 98% available funding from <strong>Global</strong> Fund 3.7 1.9US$ millions(constant 2012 US$)200016001200800400abcdRanges represent uncertainty intervals.Data are not collected from all Member States.Calculations exclude countries with missing numerators or denominators.Financing indicators exclude funding for general healthcare services provided outside NTPs.02006 2007 2008 2009 2010 2011 2012 2013Total budgetAvailable funding134 Data can be downloaded from www.who.int/tb/data GLOBAL TUBERCULOSIS REPORT 2012
WHO SOUTH-EAST ASIA REGIONPopulation 2011 1 830 millionWHO MEMBER STATES 11Estimates of TB burden a 2011 NUMBER (thousands)RATE (per 100 000 population)Mortality (excludes HIV+TB) 480 (350–630) 26 (19–34)Prevalence (includes HIV+TB) 5 000 (3 800–6 300) 271 (206–344)Incidence (includes HIV+TB) 3 500 (3 200–3 700) 189 (176–203)Incidence (HIV+TB) 140 (120–170) 7.7 (6.4–9.1)Case detection, all forms (%) 62 (58–66)TB case notifications 2011NEW CASES (%) RETREATMENT CASES (%)Smear-positive 1 067 367 (53) Relapse 135 650 (39)Smear-negative 598 800 (30) Treatment after failure 23 252 (6.6)Smear-unknown/not done 0 (0) Treatment after default 76 666 (22)Extrapulmonary 333 993 (17) Other 115 636 (33)Other 2 878 (
WHO WESTERN PACIFIC REGIONPopulation 2011 1 809 millionWHO MEMBER STATES 27OTHER COUNTRIES AND TERRITORIES 9Estimates of TB burden a 2011 NUMBER (thousands) RATE (per 100 000 population)Mortality (excludes HIV+TB) 130 (100–150) 6.9 (5.7–8.3)Prevalence (includes HIV+TB) 2 500 (2 200–2 800) 138 (123–154)Incidence (includes HIV+TB) 1 700 (1 500–1 800) 92 (84–100)Incidence (HIV+TB) 36 (31–42) 2 (1.7–2.3)Case detection, all forms (%) 81 (75–89)TB case notifications 2011NEW CASES (%) RETREATMENT CASES (%)Smear-positive 576 044 (44) Relapse 50 841 (60)Smear-negative 630 219 (49) Treatment after failure 3 967 (4.7)Smear-unknown/not done 17 435 (1.3) Treatment after default 3 371 (4.0)Extrapulmonary 68 949 (5.3) Other 25 919 (31)Other 2 708 (
ANNEX 4<strong>Global</strong>, regionaland country-specific datafor key indicatorsSummary by WHO region 139African Region 147Region of the Americas 171Eastern Mediterranean Region 195European Region 211South-East Asia Region 239Western Pacific Region 251
SUMMARY BY WHO REGIONTable A4.1 Estimates of the burden of disease caused by TB, 1990–2011 141Table A4.2 Incidence, notification and case detection rates, all forms, 1990–2011 142Table A4.3 Case notifi cations, 1990–2011 143Table A4.4 Treatment outcomes, new smear-positive cases, 1995–2010 144Table A4.5 Treatment outcomes, retreatment cases, 1995–2010 144Table A4.6 HIV testing and provision of CPT, ART and IPT, 2005–2011 145Table A4.7 Testing for MDR-TB and number of confi rmed cases of MDR-TB, 2005–2011 145Table A4.8 New smear-positive case notifi cation by age and sex, 1995–2011 146
Estimates of mortality, prevalence and incidenceEstimated values are shown as best estimates followed by lower and upper bounds. The lower and upper bounds aredefined as the 2.5th and 97.5th centiles of outcome distributions produced in simulations. See Annex 1 for furtherdetails.Estimated numbers are shown rounded to two significant figures. Estimated rates are shown rounded to three significantfigures unless the value is under 100, in which case rates are shown rounded to two significant figures. Blank cellsindicate that estimates are not available.Estimates for all years are recalculated as new information becomes available and techniques are refined, so they maydiffer from those published in previous reports in this series. Estimates published in previous global TB control reportsshould no longer be used.Data sourceData shown in this annex are taken from the WHO global TB database on 25 September 2012. Data shown in the mainpart of the report were taken from the database in July 2012. As a result, data in this annex may differ slightly fromthose in the main part of the report.Data can be downloaded from www.who.int/tb/data.140 Data can be downloaded from www.who.int/tb/data GLOBAL TUBERCULOSIS REPORT 2012
MORTALITY (EXCLUDING HIV) PREVALENCE (INCLUDING HIV) INCIDENCE (INCLUDING HIV)YEARPOPULATION(MILLIONS)NUMBER(THOUSANDS)RATE aNUMBER(THOUSANDS)RATE aNUMBER(THOUSANDS)<strong>Global</strong> 1990 5 283 1 300 (1 100–1 500) 24 (20–28) 14 000 (13 000–16 000) 268 (243–294) 7 800 (7 100–8 400) 147 (135–159)1995 5 702 1 300 (1 100–1 600) 24 (20–28) 15 000 (14 000–17 000) 269 (246–293) 8 400 (7 900–8 900) 148 (139–157)2000 6 097 1 400 (1 100–1 600) 22 (19–26) 16 000 (14 000–17 000) 257 (234–282) 9 100 (8 500–9 600) 148 (140–157)2005 6 481 1 200 (1 100–1 400) 19 (16–22) 14 000 (13 000–16 000) 221 (199–244) 9 200 (8 700–9 700) 142 (135–150)2009 6 792 1 100 (900–1 200) 16 (13–18) 12 000 (11 000–14 000) 184 (163–206) 8 800 (8 500–9 200) 130 (125–135)2010 6 870 1 000 (870–1 200) 15 (13–17) 12 000 (11 000–14 000) 177 (156–200) 8 800 (8 400–9 100) 128 (123–133)2011 6 948 990 (840–1 100) 14 (12–17) 12 000 (10 000–13 000) 170 (150–192) 8 700 (8 300–9 000) 125 (120–130)Africa 1990 507 200 (130–290) 40 (25–57) 1 900 (1 200–2 800) 372 (231–545) 1 200 (950–1 600) 245 (188–310)1995 580 230 (150–310) 39 (26–54) 2 200 (1 500–2 900) 372 (262–500) 1 600 (1 300–1 900) 276 (227–330)2000 656 240 (160–340) 37 (25–51) 2 500 (1 700–3 300) 374 (266–500) 2 000 (1 700–2 400) 311 (256–371)2005 742 240 (170–330) 32 (22–44) 2 600 (1 900–3 400) 352 (256–462) 2 300 (1 900–2 700) 310 (263–361)2009 817 220 (180–270) 27 (22–33) 2 500 (2 100–2 900) 304 (255–358) 2 300 (2 100–2 400) 276 (256–296)2010 837 220 (180–280) 27 (21–33) 2 500 (2 100–3 000) 303 (250–361) 2 300 (2 100–2 500) 271 (249–293)2011 857 220 (180–270) 26 (21–31) 2 500 (2 100–3 000) 293 (243–347) 2 300 (2 100–2 400) 262 (242–283)The Americas 1990 723 41 (34–49) 5.7 (4.7–6.8) 680 (480–910) 94 (67–126) 430 (360–490) 59 (50–68)1995 777 37 (33–42) 4.8 (4.2–5.5) 540 (420–670) 69 (54–87) 380 (350–410) 49 (46–53)2000 834 30 (26–34) 3.6 (3.2–4.0) 460 (360–580) 55 (43–70) 340 (320–370) 41 (38–44)2005 885 25 (22–28) 2.8 (2.4–3.1) 410 (320–520) 46 (36–59) 310 (290–330) 34 (32–37)2009 924 22 (19–25) 2.3 (2.0–2.7) 350 (260–440) 38 (29–48) 270 (260–290) 30 (28–32)2010 933 21 (18–24) 2.3 (1.9–2.6) 340 (260–430) 36 (27–46) 270 (250–280) 29 (27–30)2011 943 21 (18–24) 2.2 (1.9–2.5) 330 (250–420) 35 (26–44) 260 (240–280) 28 (26–29)Eastern 1990 381 120 (58–200) 32 (15–54) 1 000 (570–1 600) 269 (149–425) 470 (360–590) 123 (95–154)Mediterranean 1995 433 130 (68–210) 30 (16–49) 1 100 (680–1 700) 260 (158–388) 530 (480–590) 123 (110–137)2000 484 140 (71–230) 29 (15–47) 1 200 (700–1 800) 245 (145–371) 570 (510–640) 118 (104–132)2005 538 120 (67–190) 23 (12–36) 1 100 (700–1 600) 207 (130–302) 610 (540–680) 113 (100–126)2009 585 100 (61–150) 17 (10–26) 1 000 (660–1 500) 177 (113–255) 640 (570–720) 109 (97–123)2010 597 99 (61–150) 17 (10–25) 1 000 (660–1 500) 173 (110–249) 650 (580–730) 109 (97–122)2011 609 99 (61–150) 16 (10–24) 1 000 (660–1 500) 170 (108–246) 660 (590–740) 109 (97–122)Europe 1990 846 37 (34–41) 4.4 (4.0–4.8) 580 (480–690) 68 (56–82) 360 (350–380) 43 (41–45)1995 862 58 (56–60) 6.7 (6.5–7.0) 970 (780–1 200) 112 (90–137) 560 (530–590) 65 (62–69)2000 868 69 (67–71) 8 (7.7–8.2) 1 100 (840–1 300) 123 (96–153) 640 (600–680) 74 (69–78)2005 880 65 (63–66) 7.3 (7.2–7.5) 860 (660–1 100) 98 (75–124) 560 (520–600) 64 (60–68)2009 893 52 (51–54) 5.9 (5.7–6.0) 610 (460–790) 69 (52–88) 440 (410–470) 49 (46–53)2010 897 49 (47–50) 5.4 (5.3–5.6) 560 (410–730) 63 (46–81) 410 (380–440) 46 (43–49)2011 899 45 (44–46) 5 (4.9–5.1) 500 (370–650) 56 (41–73) 380 (350–400) 42 (39–45)South-East 1990 1 317 570 (410–750) 43 (31–57) 6 100 (5 300–7 100) 465 (400–536) 2 900 (2 500–3 200) 217 (191–245)Asia 1995 1 446 630 (460–840) 44 (32–58) 6 800 (5 800–7 800) 468 (404–538) 3 100 (2 800–3 400) 217 (197–238)2000 1 572 680 (500–890) 43 (31–57) 7 000 (6 000–8 100) 445 (383–513) 3 400 (3 200–3 700) 218 (202–235)2005 1 694 620 (480–780) 37 (28–46) 6 300 (5 200–7 400) 370 (309–436) 3 600 (3 300–3 900) 212 (196–228)2009 1 785 530 (390–690) 30 (22–39) 5 400 (4 200–6 700) 301 (235–376) 3 500 (3 300–3 800) 197 (182–211)2010 1 808 500 (370–660) 28 (20–37) 5 200 (3 900–6 600) 285 (217–363) 3 500 (3 200–3 700) 193 (179–207)2011 1 830 480 (350–630) 26 (19–34) 5 000 (3 800–6 300) 271 (206–344) 3 500 (3 200–3 700) 189 (176–203)Western 1990 1 510 310 (270–350) 21 (18–23) 3 900 (3 600–4 200) 255 (236–276) 2 400 (2 000–2 800) 159 (133–187)Pacific 1995 1 605 260 (220–300) 16 (14–19) 3 800 (3 400–4 100) 236 (214–258) 2 200 (1 900–2 500) 137 (119–157)2000 1 683 200 (160–240) 12 (9.5–14) 3 500 (3 100–3 900) 209 (186–233) 2 000 (1 800–2 300) 120 (107–134)2005 1 743 160 (130–180) 9 (7.7–10) 3 100 (2 700–3 400) 176 (157–195) 1 800 (1 700–2 000) 106 (96–116)2009 1 788 130 (110–160) 7.5 (6.2–8.9) 2 600 (2 300–2 900) 147 (131–163) 1 700 (1 600–1 900) 96 (88–105)2010 1 798 130 (110–150) 7.2 (5.9–8.6) 2 600 (2 300–2 900) 143 (127–159) 1 700 (1 500–1 800) 94 (86–102)2011 1 809 130 (100–150) 6.9 (5.7–8.3) 2 500 (2 200–2 800) 138 (123–154) 1 700 (1 500–1 800) 92 (84–100)RATE aSUMMARY BY WHO REGIONaRates are per 100 000 population.GLOBAL TUBERCULOSIS REPORT 2012 Data can be downloaded from www.who.int/tb/data 141
YEARPOPULATION(MILLIONS)INCIDENCE (INCLUDING HIV) INCIDENCE HIV-POSITIVE NOTIFIED NEW AND RELAPSE CASE DETECTIONNUMBER(THOUSANDS)RATE aNUMBER(THOUSANDS)RATE a NUMBER RATE a PERCENT<strong>Global</strong> 1990 5 283 7 800 (7 100–8 400) 147 (135–159) 350 (310–410) 6.7 (5.8–7.7) 3 740 193 71 48 (45–52)1995 5 702 8 400 (7 900–8 900) 148 (139–157) 710 (640–790) 12 (11–14) 3 400 234 60 40 (38–43)2000 6 097 9 100 (8 500–9 600) 148 (140–157) 1 100 (990–1 200) 18 (16–20) 3 746 673 61 41 (39–44)2005 6 481 9 200 (8 700–9 700) 142 (135–150) 1 200 (1 100–1 300) 19 (17–21) 5 130 170 79 56 (53–59)2009 6 792 8 800 (8 500–9 200) 130 (125–135) 1 100 (1 100–1 200) 17 (16–18) 5 803 251 85 66 (63–68)2010 6 870 8 800 (8 400–9 100) 128 (123–133) 1 100 (1 000–1 200) 16 (15–17) 5 763 310 84 66 (63–68)2011 6 948 8 700 (8 300–9 000) 125 (120–130) 1 100 (1 000–1 200) 16 (15–17) 5 772 224 83 67 (64–69)Africa 1990 507 1 200 (950–1 600) 245 (188–310) 290 (240–340) 57 (48–67) 418 520 83 34 (27–44)1995 580 1 600 (1 300–1 900) 276 (227–330) 560 (490–630) 96 (84–109) 504 377 87 31 (26–38)2000 656 2 000 (1 700–2 400) 311 (256–371) 850 (740–960) 129 (113–147) 792 911 121 39 (33–47)2005 742 2 300 (1 900–2 700) 310 (263–361) 960 (850–1 100) 130 (115–145) 1 186 801 160 52 (44–61)2009 817 2 300 (2 100–2 400) 276 (256–296) 900 (830–980) 110 (101–119) 1 380 577 169 61 (57–66)2010 837 2 300 (2 100–2 500) 271 (249–293) 880 (810–960) 105 (97–114) 1 380 294 165 61 (56–66)2011 857 2 300 (2 100–2 400) 262 (242–283) 870 (800–950) 102 (93–111) 1 367 193 159 61 (56–66)The Americas 1990 723 430 (360–490) 59 (50–68) 30 (24–37) 4.2 (3.3–5.2) 231 186 32 54 (47–64)1995 777 380 (350–410) 49 (46–53) 44 (37–51) 5.6 (4.8–6.5) 258 188 33 68 (63–73)2000 834 340 (320–370) 41 (38–44) 45 (38–52) 5.3 (4.6–6.2) 238 580 29 70 (65–75)2005 885 310 (290–330) 34 (32–37) 33 (30–36) 3.8 (3.4–4.1) 228 018 26 75 (70–80)2009 924 270 (260–290) 30 (28–32) 34 (30–37) 3.7 (3.3–4.0) 201 608 22 73 (69–78)2010 933 270 (250–280) 29 (27–30) 31 (28–34) 3.3 (3.0–3.6) 214 045 23 80 (75–86)2011 943 260 (240–280) 28 (26–29) 37 (34–40) 3.9 (3.6–4.2) 218 328 23 84 (79–90)Eastern 1990 381 470 (360–590) 123 (95–154) 3 (2.5–3.5) 0.8 (0.65–0.93) 234 620 62 50 (40–65)Mediterranean 1995 433 530 (480–590) 123 (110–137) 4.9 (4.2–5.8) 1.1 (0.96–1.3) 121 745 28 23 (21–26)2000 484 570 (510–640) 118 (104–132) 6.9 (5.9–7.9) 1.4 (1.2–1.6) 141 748 29 25 (22–28)2005 538 610 (540–680) 113 (100–126) 8 (6.9–9.2) 1.5 (1.3–1.7) 287 158 53 47 (42–54)2009 585 640 (570–720) 109 (97–123) 8.6 (7.4–9.9) 1.5 (1.3–1.7) 411 172 70 64 (57–73)2010 597 650 (580–730) 109 (97–122) 9.1 (7.9–10) 1.5 (1.3–1.7) 409 834 69 63 (56–71)2011 609 660 (590–740) 109 (97–122) 8.7 (7.6–9.9) 1.4 (1.3–1.6) 411 587 68 62 (55–70)Europe 1990 846 360 (350–380) 43 (41–45) 2.7 (2.6–2.8) 0.3 (0.31–0.34) 242 429 29 67 (64–70)1995 862 560 (530–590) 65 (62–69) 4.6 (4.2–5.1) 0.5 (0.49–0.59) 289 874 34 52 (49–54)2000 868 640 (600–680) 74 (69–78) 12 (10–13) 1.3 (1.2–1.5) 372 921 43 58 (55–62)2005 880 560 (520–600) 64 (60–68) 21 (19–24) 2.4 (2.1–2.7) 364 961 41 65 (61–70)2009 893 440 (410–470) 49 (46–53) 24 (21–26) 2.6 (2.3–3.0) 328 862 37 75 (70–80)2010 897 410 (380–440) 46 (43–49) 19 (17–21) 2.1 (1.9–2.3) 309 727 35 76 (71–81)2011 899 380 (350–400) 42 (39–45) 23 (20–25) 2.5 (2.2–2.8) 285 789 32 76 (71–81)South-East 1990 1 317 2 900 (2 500–3 200) 217 (191–245) 25 (22–28) 1.9 (1.7–2.1) 1 719 365 131 60 (53–68)Asia 1995 1 446 3 100 (2 800–3 400) 217 (197–238) 90 (72–110) 6.2 (5.0–7.5) 1 401 096 97 45 (41–49)2000 1 572 3 400 (3 200–3 700) 218 (202–235) 160 (130–190) 10 (8.5–12) 1 414 228 90 41 (38–44)2005 1 694 3 600 (3 300–3 900) 212 (196–228) 170 (140–200) 10 (8.4–12) 1 789 186 106 50 (46–54)2009 1 785 3 500 (3 300–3 800) 197 (182–211) 150 (120–180) 8.4 (7.0–10) 2 124 371 119 61 (56–65)2010 1 808 3 500 (3 200–3 700) 193 (179–207) 140 (120–170) 8 (6.7–9.5) 2 123 119 117 61 (57–66)2011 1 830 3 500 (3 200–3 700) 189 (176–203) 140 (120–170) 7.7 (6.4–9.1) 2 138 688 117 62 (58–66)Western 1990 1 510 2 400 (2 000–2 800) 159 (133–187) 3.3 (2.7–3.9) 0.2 (0.18–0.26) 894 073 59 37 (32–45)Pacific 1995 1 605 2 200 (1 900–2 500) 137 (119–157) 14 (11–17) 0.9 (0.69–1.0) 824 954 51 37 (33–43)2000 1 683 2 000 (1 800–2 300) 120 (107–134) 23 (19–27) 1.4 (1.1–1.6) 786 285 47 39 (35–43)2005 1 743 1 800 (1 700–2 000) 106 (96–116) 32 (26–37) 1.8 (1.5–2.1) 1 274 046 73 69 (63–76)2009 1 788 1 700 (1 600–1 900) 96 (88–105) 33 (28–39) 1.9 (1.5–2.2) 1 356 661 76 79 (72–87)2010 1 798 1 700 (1 500–1 800) 94 (86–102) 33 (28–39) 1.8 (1.5–2.2) 1 326 291 74 79 (72–86)2011 1 809 1 700 (1 500–1 800) 92 (84–100) 36 (31–42) 2 (1.7–2.3) 1 350 639 75 81 (75–89)aRates are per 100 000 population.142 Data can be downloaded from www.who.int/tb/data GLOBAL TUBERCULOSIS REPORT 2012
NEW AND RELAPSENOTIFICATION RATE aYEARNEW ANDNEW CASESSMEAR- SMEAR-NEGATIVE/POSITIVE UNKNOWNEXTRA-RE-TREAT EXCL.OTHER RELAPSEPULMONARY RELAPSETOTALRETREATHISTORYUNKNOWN% SMEAR-POS AMONGNEW PULM1990–2011RELAPSE<strong>Global</strong> 1990 3 740 193 30 046 22 393 4 237 0 734 49 783 29 571995 3 400 234 1 175 290 1 811 850 262 728 5 59 240 0 59 240 44 392000 3 746 673 1 540 688 1 614 748 399 578 37 115 314 236 074 351 388 229 492005 5 130 170 2 413 708 1 722 281 686 525 8 111 259 937 406 355 666 292 18 172 582009 5 803 251 2 662 591 2 010 641 831 391 9 998 288 630 385 232 673 862 36 641 572010 5 763 310 2 655 557 2 002 463 806 373 12 951 285 966 418 071 704 037 28 846 57• 71 83 • 2011 5 772 224 2 627 059 2 033 911 815 756 11 913 283 585 418 016 701 601 39 409 56Africa 1990 418 520 24 064 6 137 2 067 0 554 49 603 0 801995 504 377 212 910 191 477 72 689 0 15 133 0 15 133 0 532000 792 911 367 831 221 715 141 156 0 19 153 68 085 87 238 0 622005 1 186 801 550 004 364 785 208 979 2 941 60 092 66 449 126 541 2 075 602009 1 380 577 607 257 473 217 244 806 346 54 951 89 377 144 328 305 562010 1 380 294 601 149 477 516 247 020 642 53 967 94 506 148 473 317 56• 83 159 • 2011 1 367 193 605 929 467 069 240 843 1 069 52 283 74 624 126 907 18 951 56The Americas 1990 231 186 1 542 516 723 0 180 0 180 29 751995 258 188 138 932 72 312 32 991 5 1 723 0 1 723 44 662000 238 580 131 294 60 392 32 037 37 10 834 14 344 25 178 56 682005 228 018 124 840 56 056 33 285 3 685 10 152 12 481 22 633 2 106 692009 201 608 110 614 45 034 31 422 4 363 10 175 11 317 21 492 3 829 712010 214 045 116 994 52 265 32 240 2 133 10 413 12 133 22 546 885 69• 32 23 • 2011 218 328 121 572 51 089 34 235 1 364 10 068 11 694 21 762 3 165 70Eastern 1990 234 620 1 587 12 394 754 0 0 0 0 0 11Mediterranean 1995 121 745 46 851 51 823 33 382 0 2 407 0 2 407 0 472000 141 748 60 959 34 289 40 754 0 5 568 0 5 568 0 642005 287 158 113 765 102 274 64 612 12 6 495 5 334 11 829 20 532009 411 172 168 013 143 633 87 726 76 11 724 6 240 17 964 737 542010 409 834 168 627 137 301 92 070 633 11 203 8 713 19 916 3 079 55• 62 68 • 2011 411 587 170 748 135 388 93 605 623 11 223 10 102 21 325 4 132 56Europe 1990 242 429 0 0 0 0 0 0 0 01995 289 874 104 444 146 592 29 866 0 7 927 0 7 927 0 422000 372 921 94 442 208 147 35 081 0 21 607 19 127 40 734 173 312005 364 961 96 121 157 237 49 747 0 22 248 64 831 87 079 3 663 382009 328 862 100 493 152 468 47 202 3 393 25 306 41 884 67 190 24 937 402010 309 727 91 324 145 140 40 951 8 008 24 304 60 736 85 040 18 527 39• 29 32 • 2011 285 789 82 641 132 474 43 912 3 272 23 490 72 722 96 212 5 501 38South-East 1990 1 719 365 2 769 3 241 656 0 0 0 0 0 46Asia 1995 1 401 096 357 882 939 945 76 865 0 5 546 0 5 546 0 282000 1 414 228 510 053 741 471 120 708 0 27 095 80 444 107 539 0 412005 1 789 186 857 371 594 185 242 332 1 439 93 859 158 215 252 074 202 592009 2 124 371 1 028 656 636 755 329 338 1 796 127 826 203 598 331 424 261 622010 2 123 119 1 047 013 615 463 328 421 1 508 130 714 208 542 339 256 1 118 63• 131 117 • 2011 2 138 688 1 067 367 598 800 333 993 2 878 135 650 215 554 351 204 3 885 64Western 1990 894 073 84 105 37 0 0 0 0 0 44Pacific 1995 824 954 314 271 409 701 16 935 0 26 504 0 26 504 0 432000 786 285 376 109 348 734 29 842 0 31 057 54 074 85 131 0 522005 1 274 046 671 607 447 744 87 570 34 67 091 99 045 166 136 10 106 602009 1 356 661 647 558 559 534 90 897 24 58 648 32 816 91 464 6 572 542010 1 326 291 630 450 574 778 65 671 27 55 365 33 441 88 806 4 920 52• 59 75 • 2011 1 350 639 578 802 649 091 69 168 2 707 50 871 33 320 84 191 3 775 47SUMMARY BY WHO REGIONaRates are per 100 000 population.GLOBAL TUBERCULOSIS REPORT 2012 Data can be downloaded from www.who.int/tb/data 143
TREATMENT SUCCESS (%) a1995–2010YEARNUMBERNOTIFIEDSIZE OFCOHORTCOHORT AS% NOTIFIED% OF COHORTCURED COMPLETED DIED FAILED DEFAULTEDNOTEVALUATED<strong>Global</strong> 1995 1 175 290 1 000 581 85 40 17 3 1 5 342000 1 540 688 1 452 991 94 60 9 4 1 7 192005 2 413 708 2 396 387 99 77 7 4 2 5 42008 2 656 276 2 648 749 100 79 7 4 2 5 42009 2 662 591 2 664 704 100 80 7 4 2 4 4• 57 87 • 2010 2 655 557 2 694 992 101 79 8 4 2 4 3Africa 1995 212 910 177 567 83 46 14 6 2 12 202000 367 831 364 804 99 59 12 7 1 11 102005 550 004 563 750 102 62 13 7 1 9 72008 595 394 590 866 99 70 11 6 2 7 62009 607 257 605 932 100 70 10 5 1 6 7• 60 82 • 2010 601 149 634 962 106 68 13 5 1 6 6The Americas 1995 138 932 128 531 93 37 14 3 1 6 392000 131 294 110 642 84 60 17 5 1 8 112005 124 840 118 840 95 55 24 5 1 7 92008 119 863 109 007 91 56 21 5 1 7 102009 110 614 122 534 111 53 23 5 1 8 11• 50 75 • 2010 116 994 126 450 108 53 22 5 1 8 11Eastern 1995 46 851 46 318 99 60 19 2 3 13 4Mediterranean 2000 60 959 63 749 105 69 12 4 2 8 62005 113 765 113 742 100 72 11 3 1 8 52008 166 558 166 719 100 74 13 2 1 5 42009 168 013 167 317 100 74 14 3 1 5 3• 79 88 • 2010 168 627 169 872 101 74 14 2 1 5 3Europe 1995 104 444 33 823 32 58 10 6 6 4 162000 94 442 41 480 44 47 28 5 6 6 72005 96 121 81 410 85 59 13 8 7 7 52008 105 160 114 234 109 54 15 8 10 6 62009 100 493 105 441 105 56 13 8 12 6 5• 67 67 • 2010 91 324 96 051 105 54 13 8 12 6 7South-East 1995 357 882 318 410 89 9 23 1 0 2 64Asia 2000 510 053 512 286 100 44 6 2 1 7 402005 857 371 855 962 100 83 4 4 2 6 12008 1 007 382 1 011 353 100 84 4 4 2 5 12009 1 028 656 1 022 380 99 85 3 4 2 5 1• 33 88 • 2010 1 047 013 1 045 179 100 85 4 4 2 5 1Western 1995 314 271 295 932 94 67 13 2 1 4 13Pacific 2000 376 109 360 030 96 85 5 2 1 2 42005 671 607 662 683 99 89 3 2 1 1 32008 661 919 656 570 99 89 3 2 1 1 42009 647 558 641 100 99 90 3 2 1 1 3• 80 93 • 2010 630 450 622 478 99 90 3 2 1 1 3TREATMENT SUCCESS (%) a1995–2010YEARNUMBERNOTIFIEDSIZE OFCOHORTCOHORT AS% NOTIFIED% OF COHORTCURED COMPLETED DIED FAILED DEFAULTEDNOTEVALUATED<strong>Global</strong> 1995 59 240 71 395 121 82 4 3 3 3 42000 351 388 188 509 54 60 10 6 4 11 102005 666 292 546 182 82 51 19 7 4 12 62008 776 099 594 939 77 50 22 7 5 11 52009 673 862 594 019 88 49 23 7 6 10 5• 86 69 • 2010 704 037 603 489 86 47 22 6 4 10 10Africa 1995 15 133 5 756 38 57 12 9 3 12 62000 87 238 44 147 51 47 11 9 3 16 142005 126 541 114 838 91 35 27 11 3 13 122008 136 263 98 414 72 48 21 9 3 10 92009 144 328 94 342 65 50 20 9 3 9 10• 69 54 • 2010 148 473 113 405 76 41 13 6 3 7 31The Americas 1995 1 723 1 104 64 61 11 6 4 11 82000 25 178 15 302 61 47 8 5 3 12 252005 22 633 18 603 82 38 16 6 2 15 212008 23 201 15 483 67 29 23 8 2 20 172009 21 492 19 158 89 29 22 8 3 19 21• 72 49 • 2010 22 546 17 499 78 26 23 7 2 20 21Eastern 1995 2 407 1 860 77 61 14 3 4 12 5Mediterranean 2000 5 568 4 217 76 51 11 6 7 15 112005 11 829 12 860 109 60 15 5 4 10 62008 16 441 14 990 91 57 19 4 3 11 62009 17 964 16 332 91 56 21 4 3 10 6• 75 75 • 2010 19 916 18 326 92 54 21 4 3 10 8Europe 1995 7 927 480 6 20 20 11 8 32 82000 40 734 10 739 26 39 19 9 14 11 82005 87 079 39 497 45 32 18 11 13 14 102008 135 384 60 077 44 30 18 11 20 12 92009 67 190 58 966 88 27 22 11 22 11 7• 40 51 • 2010 85 040 48 292 57 26 24 10 15 10 14South-East 1995 5 546 3 271 59 62 6 4 5 15 8Asia 2000 107 539 59 337 55 57 14 6 5 15 32005 252 074 254 378 101 49 22 7 5 15 22008 332 296 323 436 97 47 28 7 4 12 22009 331 424 332 286 100 48 27 7 4 12 2• 68 75 • 2010 339 256 338 748 100 47 28 7 4 12 2Western 1995 26 504 58 924 222 88 2 3 3 1 3Pacific 2000 85 131 54 767 64 83 3 2 2 1 92005 166 136 106 006 64 81 6 3 3 2 62008 132 514 82 539 62 80 6 3 2 2 72009 91 464 72 935 80 79 7 3 2 2 7• 90 86 • 2010 88 806 67 219 76 79 7 3 2 2 7a TREATMENT SUCCESS = percent cured + percent completed then rounded to the nearest digit.144 Data can be downloaded from www.who.int/tb/data GLOBAL TUBERCULOSIS REPORT 2012
–% OF TB PATIENTS WITHKNOWN HIV STATUS2005–2011YEAR% OF TBPATIENTS WITHKNOWN HIVSTATUSNUMBER OF TBPATIENTS WITHKNOWN HIVSTATUSPATIENTSNOTIFIED(NEW ANDRETREAT)NUMBER OFHIV-POSITIVETB PATIENTS% OF TESTEDTB PATIENTSHIV-POSITIVE% OF HIV-POSITIVE TBPATIENTS ONCPT% OF HIV-POSITIVE TBPATIENTS ONARTNUMBER OFHIV-POSITIVEPEOPLEPROVIDED IPT<strong>Global</strong> 2005 8 463 027 5 554 697 103 683 22 76 35 25 9382009 28 1 736 632 6 225 124 463 826 27 77 39 89 0832010 33 2 074 510 6 210 227 493 138 24 81 46 204 802• 8 40 • 2011 40 2 468 364 6 229 649 562 026 23 79 48 446 598Africa 2005 11 140 713 1 255 325 73 332 52 78 29 22 2112009 56 816 338 1 470 259 370 245 45 77 36 63 2902010 60 888 765 1 475 117 394 332 44 81 44 182 524• 11 69 • 2011 69 1 001 512 1 460 768 458 657 46 79 46 438 121The Americas 2005 35 84 032 242 605 14 232 17 10 81 3 7272009 50 107 980 216 754 18 143 17 36 61 5 3902010 53 121 421 227 063 19 615 16 50 63 12 906• 35 53 • 2011 53 124 576 233 187 20 906 17 43 64 1 705Eastern 2005 1 2 582 292 512 330 13 18 16 0Mediterranean 2009 11 45 408 418 149 1 625 4 41 41 4642010 11 44 596 421 626 1 360 3 50 44 253• 1 11 • 2011 11 44 973 425 821 1 781 4 59 48 52Europe 2005 40 171 248 433 455 6 543 3 25 16 02009 71 280 985 395 683 13 496 5 54 60 17 8262010 53 206 391 388 990 12 810 6 58 61 6 575• 40 54 • 2011 54 195 306 364 012 12 583 6 59 44 4 565South-East 2005 2 31 847 1 947 603 7 025 22 50 31 0Asia 2009 14 318 237 2 328 230 46 089 14 86 50 4672010 23 546 350 2 332 779 52 519 10 86 56 581• 2 32 • 2011 32 750 315 2 358 127 54 314 7 89 59 368Western 2005 2 32 605 1 383 197 2 221 7 31 33 0Pacific 2009 12 167 684 1 396 049 14 228 8 64 16 1 6462010 20 266 987 1 364 652 12 502 5 55 41 1 963• 2 25 • 2011 25 351 682 1 387 734 13 785 4 71 47 1 787SUMMARY BY WHO REGIONYEARTOTALCONFIRMEDCASES OFMDR-TB aESTIMATED CASESOF MDR-TB AMONGNOTIFIEDESTIMATED CASESOF MDR-TB AMONGNOTIFIEDNEW PULMONARY CASESNUMBER OFBACT+VE bTESTED FORMDR-TB% OFBACT+VE bTESTED FORMDR-TBESTIMATED CASESOF MDR-TB AMONGNOTIFIEDPREVIOUSLY TREATED CASESNUMBER OF% OF NOTIFIEDNOTIFIEDTESTED FORTESTED FORMDR-TBMDR-TB<strong>Global</strong> 2005 11988 72870 2.9 24002 3.62009 46897 111226 4 42307 6.32010 54987 119428 4 47584 6.82011 61690 310 000 (220 000–400 000) 170 000 (98 000–240 000) 127537 4.3 140 000 (92 000–180 000) 47568 6.8Africa 2005 2445 1826 0.32 3922 3.12009 10741 3878 0.61 4340 32010 9340 2732 0.36 4294 2.92011 12384 45 000 (7 900–82 000) 31 000 (1 100–67 000) 1311 0.18 14 000 (4 300–23 000) 3707 2.9The Americas 2005 4427 14568 11 11003 492009 2884 11638 9.2 3069 142010 2661 11309 8.6 4234 192011 3474 5 900 (3 400–8 400) 3 500 (1 400–5 700) 13334 10 2 400 (980–3 800) 4234 19Eastern 2005 350 1442 1.3 94 0.79Mediterranean 2009 496 1760 0.97 1274 7.12010 886 2397 1.4 1257 6.32011 841 17 000 (0–38 000) 10 000 (310–32 000) 2264 1.2 6 400 (1 500–11 000) 1466 6.9Europe 2005 4347 34527 27 7024 8.12009 28157 87815 66 27618 412010 33863 89841 69 34491 412011 33984 76 000 (64 000–87 000) 33 000 (22 000–44 000) 84140 66 43 000 (38 000–47 000) 31095 32South-East 2005 68 661
MALEFEMALEYEAR 0–14 15–24 25–34 35–44 45–54 55–64 65+0–14 15–24 25–34 35–44 45–54 55–64 65+UN-KNOWNUN-KNOWNMALE:FEMALERATIO<strong>Global</strong> 1995 7 491 48 816 76 799 65 678 49 514 41 756 34 776 0 7 730 41 378 50 102 32 741 22 688 17 816 16 686 0 1.72000 12 387 115 250 172 896 156 274 121 277 82 844 75 156 0 14 749 94 641 110 306 74 705 49 823 33 696 33 829 0 1.82005 18 415 242 356 329 720 312 526 261 233 184 836 166 858 42 26 178 199 700 220 530 153 503 106 029 72 022 65 717 15 1.82010 20 239 268 884 345 937 336 981 298 715 227 530 186 815 7 502 28 825 210 729 225 986 163 260 118 565 86 264 75 368 2 601 1.92011 19 689 265 246 349 403 333 327 300 208 229 464 183 477 575 28 124 209 651 224 345 162 737 119 546 87 605 73 843 311 1.9Africa 1995 2 910 16 754 28 172 20 240 12 017 7 008 4 104 0 3 167 15 873 19 005 11 339 6 643 3 655 1 734 0 1.52000 3 625 29 522 47 654 34 435 17 923 8 970 5 751 0 4 315 29 530 35 386 20 037 9 402 4 581 2 578 0 1.42005 7 635 54 066 94 388 71 072 40 974 18 931 12 143 0 10 023 57 115 75 056 43 213 22 855 11 047 7 163 0 1.32010 8 393 57 146 98 636 78 660 48 543 24 094 14 478 17 10 287 55 537 76 051 47 070 26 299 13 522 8 685 9 1.42011 8 551 59 072 105 549 81 247 49 967 24 393 14 732 516 10 632 57 027 76 968 47 873 26 401 13 543 8 843 301 1.4The Americas 1995 437 2 888 3 443 3 157 2 448 1 866 2 251 0 431 2 293 2 434 1 654 1 109 912 1 311 0 1.62000 3 464 18 564 21 869 19 787 15 138 9 899 9 717 0 3 535 15 305 14 961 10 323 7 294 5 038 5 894 0 1.62005 1 520 16 410 16 671 14 369 12 340 7 801 7 951 0 1 718 12 405 11 563 7 891 5 933 3 788 4 751 0 1.62010 1 050 11 461 14 267 11 332 10 627 7 433 7 084 59 1 137 8 405 8 496 5 818 4 880 3 467 4 068 22 1.72011 1 103 12 436 15 023 11 704 11 234 7 709 7 198 56 1 241 8 517 8 766 5 875 4 973 3 690 4 243 9 1.8Eastern 1995 2 010 6 796 8 673 5 475 3 731 3 732 2 604 0 1 881 5 035 5 797 3 679 3 047 2 742 1 902 0 1.4Mediterranean 2000 1 339 8 135 9 002 6 525 4 409 2 990 3 036 0 1 711 6 710 5 780 3 922 2 851 2 039 1 893 0 1.42005 1 546 13 558 14 609 10 798 8 729 6 581 5 595 0 2 766 13 529 12 098 8 386 6 245 4 383 3 399 0 1.22010 2 316 19 526 19 993 14 908 13 086 10 596 9 521 0 4 377 21 108 17 151 12 183 9 776 7 532 7 032 0 1.12011 1 924 19 630 20 303 14 984 13 857 11 049 9 871 0 3 839 21 322 17 214 12 380 10 060 7 770 6 432 0 1.2Europe 1995 553 3 588 7 046 10 157 7 625 5 716 4 842 0 548 2 906 3 636 2 594 1 549 1 560 3 289 0 2.52000 201 4 636 8 322 9 862 8 065 4 313 3 321 0 290 3 506 4 405 2 945 1 798 1 243 2 490 0 2.32005 299 6 170 9 151 9 150 8 704 4 443 4 089 42 422 4 667 5 101 3 161 2 242 1 336 3 176 15 2.12010 156 7 319 13 259 12 447 12 270 6 916 4 125 7 423 301 4 958 6 559 4 218 3 051 2 033 3 398 2 567 2.42011 152 6 279 13 304 13 033 12 508 7 277 4 024 3 248 4 564 6 560 4 360 3 097 2 229 3 532 1 2.3South-East 1995 165 3 179 6 467 6 508 5 241 4 682 3 523 0 250 2 187 2 834 2 404 2 003 1 866 1 480 0 2.3Asia 2000 2 453 30 093 45 720 47 107 38 058 25 080 16 208 0 3 222 21 518 25 653 19 241 13 019 8 142 5 468 0 2.12005 5 064 94 638 120 560 122 256 107 228 74 084 45 533 0 8 591 71 923 76 779 54 000 37 709 24 289 12 975 0 2.02010 6 737 114 806 136 683 142 080 132 411 101 728 67 131 0 10 923 84 006 84 704 63 272 48 470 34 052 20 004 0 2.02011 6 490 114 254 136 142 141 636 135 592 106 420 72 264 0 10 654 85 376 84 383 64 868 50 920 36 755 21 593 0 2.0Western 1995 1 416 15 611 22 998 20 141 18 452 18 752 17 452 0 1 453 13 084 16 396 11 071 8 337 7 081 6 970 0 1.8Pacific 2000 1 305 24 300 40 329 38 558 37 684 31 592 37 123 0 1 676 18 072 24 121 18 237 15 459 12 653 15 506 0 2.02005 2 351 57 514 74 341 84 881 83 258 72 996 91 547 0 2 658 40 061 39 933 36 852 31 045 27 179 34 253 0 2.22010 1 587 58 626 63 099 77 554 81 778 76 763 84 476 3 1 800 36 715 33 025 30 699 26 089 25 658 32 181 3 2.42011 1 469 53 575 59 082 70 723 77 050 72 616 75 388 0 1 510 32 845 30 454 27 381 24 095 23 618 29 200 0 2.4146 Data can be downloaded from www.who.int/tb/data GLOBAL TUBERCULOSIS REPORT 2012
AFRICAN REGIONTable A4.1 Estimates of the burden of disease caused by TB, 1990–2011 149Table A4.2 Incidence, notification and case detection rates, all forms, 1990–2011 152Table A4.3 Case notifi cations, 1990–2011 155Table A4.4 Treatment outcomes, new smear-positive cases, 1995–2010 158Table A4.5 Treatment outcomes, retreatment cases, 1995–2010 161Table A4.6 HIV testing and provision of CPT, ART and IPT, 2005–2011 164Table A4.7 Testing for MDR-TB and number of confi rmed cases of MDR-TB, 2005–2011 166Table A4.8 New smear-positive case notifi cation by age and sex, 1995–2011 168Table A4.9 Laboratories, NTP services, drug management and infection control, 2011 170
Estimates of mortality, prevalence and incidenceEstimated values are shown as best estimates followed by lower and upper bounds. The lower and upper bounds aredefined as the 2.5th and 97.5th centiles of outcome distributions produced in simulations. See Annex 1 for furtherdetails.Estimated numbers are shown rounded to two significant figures. Estimated rates are shown rounded to three significantfigures unless the value is under 100, in which case rates are shown rounded to two significant figures. Blank cellsindicate that estimates are not available.Estimates for all years are recalculated as new information becomes available and techniques are refined, so they maydiffer from those published in previous reports in this series. Estimates published in previous global TB control reportsshould no longer be used.Data sourceData shown in this annex are taken from the WHO global TB database on 25 September 2012. Data shown in the mainpart of the report were taken from the database in July 2012. As a result, data in this annex may differ slightly fromthose in the main part of the report.Data can be downloaded from www.who.int/tb/data.Country notesSouth AfricaTreatment outcomes in Table A4.5 for 2010 are based on incomplete data.148 Data can be downloaded from www.who.int/tb/data GLOBAL TUBERCULOSIS REPORT 2012
MORTALITY (EXCLUDING HIV) PREVALENCE (INCLUDING HIV) INCIDENCE (INCLUDING HIV)YEARPOPULATION(MILLIONS)NUMBER(THOUSANDS)RATE aNUMBER(THOUSANDS)RATE aNUMBER(THOUSANDS)Algeria 1990 25 2.5 (0.930–4.9) 9.9 (3.7–19) 26 (10–49) 102 (41–192) 17 (12–22) 66 (48–86)1995 28 2.6 (0.890–5.2) 9.2 (3.1–18) 28 (11–55) 100 (37–193) 19 (14–25) 68 (50–89)2000 31 4 (1.5–7.8) 13 (4.8–26) 41 (16–78) 136 (54–254) 27 (19–35) 87 (64–114)2005 33 4.5 (1.7–8.8) 14 (5.0–27) 47 (19–88) 143 (57–268) 30 (22–40) 93 (68–121)2009 35 4.4 (1.6–8.7) 13 (4.5–25) 47 (18–89) 134 (53–254) 31 (23–41) 89 (65–116)2010 35 4.7 (1.7–9.2) 13 (4.8–26) 49 (19–92) 138 (55–259) 32 (23–42) 90 (66–118)2011 36 4.8 (1.8–9.3) 13 (4.9–26) 50 (20–93) 139 (55–260) 32 (24–42) 90 (66–117)Angola 1990 10 3.7 (1.2–7.6) 35 (11–73) 35 (12–70) 342 (119–680) 21 (13–31) 205 (127–303)1995 12 5.5 (2.2–10) 46 (19–85) 49 (23–84) 404 (194–690) 27 (22–33) 226 (185–272)2000 14 5.1 (2.2–9.3) 37 (16–67) 51 (25–86) 366 (180–617) 35 (28–42) 250 (204–300)2005 16 3.7 (1.3–7.4) 22 (7.9–45) 50 (20–95) 305 (120–574) 45 (37–54) 276 (227–329)2009 19 5 (2.0–9.2) 27 (11–49) 63 (27–110) 340 (147–613) 55 (46–65) 298 (250–349)2010 19 5.7 (2.5–10) 30 (13–54) 69 (31–120) 361 (165–632) 58 (49–68) 304 (256–355)2011 20 7.3 (3.3–13) 37 (17–66) 81 (38–140) 413 (195–712) 61 (51–71) 310 (261–362)Benin 1990 5 0.91 (0.370–1.7) 19 (7.8–35) 8.4 (4.2–14) 176 (89–293) 6.1 (5.1–7.3) 128 (106–153)1995 6 0.88 (0.370–1.6) 16 (6.5–29) 8.2 (4.1–14) 146 (73–244) 5.6 (4.7–6.7) 100 (82–119)2000 7 0.88 (0.370–1.6) 13 (5.7–25) 8.3 (4.2–14) 128 (64–214) 5.6 (4.6–6.7) 86 (71–102)2005 8 0.8 (0.350–1.4) 11 (4.6–19) 8.1 (4.0–14) 106 (52–178) 5.6 (4.6–6.7) 74 (61–88)2009 9 0.8 (0.350–1.4) 9.3 (4.1–17) 8.4 (4.1–14) 97 (48–165) 6 (5.0–7.1) 70 (58–83)2010 9 0.81 (0.360–1.4) 9.1 (4.0–16) 8.5 (4.1–14) 96 (46–163) 6.1 (5.0–7.2) 69 (57–82)2011 9 0.83 (0.370–1.5) 9.2 (4.0–16) 8.8 (4.3–15) 96 (47–163) 6.3 (5.2–7.5) 70 (58–83)Botswana 1990 1 1.1 (0.210–2.6) 77 (15–189) 10 (2.3–25) 757 (168–1 780) 7.4 (2.9–14) 533 (212–997)1995 2 1.2 (0.400–2.4) 74 (25–149) 13 (5.7–23) 813 (357–1 450) 14 (8.8–19) 855 (553–1 220)2000 2 0.95 (0.390–1.8) 54 (22–100) 13 (6.7–21) 724 (382–1 170) 16 (13–20) 918 (736–1 120)2005 2 0.67 (0.310–1.2) 36 (17–62) 10 (5.6–17) 560 (298–901) 14 (13–15) 733 (667–802)2009 2 0.52 (0.250–0.900) 26 (13–45) 8.4 (4.4–13) 422 (224–681) 11 (9.6–12) 545 (486–608)2010 2 0.5 (0.240–0.850) 25 (12–42) 7.8 (4.2–13) 389 (209–624) 10 (9.0–11) 503 (449–560)2011 2 0.49 (0.230–0.830) 24 (11–41) 7.3 (4.0–12) 360 (196–574) 9.2 (8.3–10) 455 (406–507)Burkina Faso 1990 9 1.3 (0.490–2.4) 14 (5.2–26) 11 (5.3–19) 117 (56–200) 8.1 (6.9–9.4) 87 (74–101)1995 11 1.5 (0.560–2.8) 14 (5.3–26) 13 (6.1–22) 118 (57–201) 8.8 (7.5–10) 82 (70–96)2000 12 1.5 (0.610–2.9) 13 (5.0–24) 13 (6.5–23) 109 (53–186) 8.8 (7.4–10) 71 (60–83)2005 14 1.5 (0.640–2.8) 11 (4.5–20) 14 (7.0–23) 98 (49–164) 8.9 (7.5–10) 63 (53–73)2009 16 1.5 (0.660–2.7) 9.5 (4.1–17) 14 (7.4–24) 90 (46–149) 9.5 (8.1–11) 59 (50–69)2010 16 1.5 (0.650–2.7) 9.1 (4.0–16) 14 (7.3–24) 87 (44–144) 9.5 (8.1–11) 58 (49–67)2011 17 1.5 (0.650–2.6) 8.7 (3.8–15) 14 (7.4–24) 85 (43–141) 9.7 (8.2–11) 57 (48–66)Burundi 1990 6 1.3 (0.560–2.2) 23 (10–40) 12 (6.6–20) 223 (119–359) 9.1 (8.0–10) 162 (143–183)1995 6 2.9 (1.1–5.4) 48 (19–89) 26 (13–43) 422 (209–710) 20 (17–22) 323 (284–364)2000 6 2.5 (1.0–4.6) 39 (16–72) 23 (12–38) 368 (190–604) 18 (16–21) 289 (255–326)2005 7 2 (0.880–3.7) 28 (12–50) 20 (10–32) 271 (143–439) 14 (13–16) 198 (174–223)2009 8 1.7 (0.760–2.9) 20 (9.3–36) 17 (8.9–27) 206 (109–334) 12 (11–14) 150 (132–169)2010 8 1.6 (0.750–2.9) 20 (9.0–34) 17 (8.7–27) 199 (104–323) 12 (11–14) 144 (127–163)2011 9 1.6 (0.740–2.8) 19 (8.6–33) 16 (8.6–27) 192 (100–313) 12 (10–13) 139 (122–157)Cameroon 1990 12 2.3 (0.980–4.1) 19 (8.0–33) 22 (11–37) 178 (88–300) 14 (11–16) 112 (92–133)1995 14 5.7 (2.2–11) 41 (16–79) 48 (22–84) 345 (159–602) 29 (24–34) 206 (170–246)2000 16 7.9 (3.0–15) 50 (19–97) 68 (32–120) 433 (202–749) 49 (40–58) 310 (255–369)2005 18 7 (2.8–13) 40 (16–74) 67 (34–110) 381 (193–633) 55 (45–65) 313 (258–373)2009 19 6.1 (2.6–11) 32 (13–58) 62 (32–100) 323 (169–527) 51 (42–61) 268 (221–319)2010 20 6.2 (2.6–11) 32 (13–58) 63 (33–100) 321 (168–522) 54 (44–64) 274 (226–327)2011 20 5.9 (2.5–11) 29 (13–53) 60 (31–98) 299 (155–490) 49 (40–58) 243 (200–290)Cape Verde 1990 < 1 0.12 (0.040–0.250) 35 (11–71) 1.1 (0.400–2.1) 313 (114–609) 0.61 (0.380–0.900) 175 (108–259)1995 < 1 0.13 (0.055–0.250) 34 (14–63) 1.2 (0.570–2.0) 302 (145–513) 0.66 (0.540–0.800) 168 (137–201)2000 < 1 0.15 (0.058–0.270) 33 (13–62) 1.3 (0.610–2.2) 291 (139–498) 0.7 (0.570–0.840) 160 (131–193)2005 < 1 0.15 (0.063–0.280) 32 (13–60) 1.4 (0.650–2.3) 286 (137–489) 0.72 (0.590–0.870) 153 (125–184)2009 < 1 0.13 (0.055–0.240) 27 (11–49) 1.2 (0.600–2.0) 247 (121–416) 0.73 (0.600–0.870) 148 (121–177)2010 < 1 0.13 (0.054–0.230) 26 (11–47) 1.2 (0.590–2.0) 241 (119–405) 0.73 (0.600–0.870) 147 (121–175)2011 < 1 0.12 (0.052–0.220) 24 (10–44) 1.1 (0.560–1.9) 230 (113–387) 0.73 (0.600–0.870) 145 (120–173)Central African 1990 3 3.5 (1.3–6.9) 121 (45–234) 30 (14–52) 1 020 (472–1 780) 25 (21–30) 864 (712–1 030)Republic 1995 3 5.1 (1.9–10) 154 (56–300) 44 (20–77) 1 330 (610–2 320) 40 (33–48) 1 200 (990–1 430)2000 4 5.2 (1.9–10) 142 (52–275) 45 (21–79) 1 220 (566–2 130) 40 (33–47) 1 070 (885–1 280)2005 4 3.9 (1.5–7.6) 98 (37–189) 35 (16–59) 859 (408–1 480) 28 (23–33) 690 (569–823)2009 4 2.8 (1.1–5.2) 65 (26–121) 26 (13–43) 601 (300–1 010) 20 (17–24) 469 (387–559)2010 4 2.6 (1.0–4.8) 59 (24–109) 24 (12–41) 553 (277–922) 19 (16–23) 433 (357–516)2011 4 2.4 (0.980–4.4) 53 (22–98) 23 (12–38) 510 (259–844) 18 (15–21) 400 (330–477)Chad 1990 6 0.85 (0.370–1.5) 14 (6.1–26) 8.3 (4.2–14) 138 (69–229) 5.7 (4.7–6.8) 94 (78–112)1995 7 1.5 (0.610–2.9) 22 (8.7–41) 14 (6.6–23) 194 (95–329) 9 (7.4–11) 128 (106–153)2000 8 1.9 (0.780–3.6) 24 (9.5–44) 18 (8.8–30) 216 (107–363) 12 (10–15) 151 (125–180)2005 10 2.2 (0.910–4.1) 23 (9.3–42) 21 (10–34) 211 (106–353) 15 (12–17) 150 (124–178)2009 11 2.3 (0.960–4.1) 21 (8.8–38) 22 (11–37) 204 (104–338) 17 (14–20) 151 (125–180)2010 11 2.2 (0.940–3.9) 19 (8.4–35) 22 (11–37) 198 (100–327) 17 (14–20) 151 (125–179)2011 12 2.1 (0.910–3.7) 18 (7.9–32) 22 (11–36) 191 (97–316) 17 (14–21) 151 (125–179)Comoros 1990 < 1 0.045 (0.019–0.080) 10 (4.4–18) 0.42 (0.200–0.710) 95 (46–161) 0.24 (0.190–0.280) 54 (44–64)1995 < 1 0.04 (0.018–0.072) 8.1 (3.5–15) 0.38 (0.180–0.660) 78 (37–133) 0.23 (0.190–0.270) 46 (38–55)2000 < 1 0.038 (0.017–0.069) 6.8 (3.0–12) 0.37 (0.180–0.630) 66 (31–112) 0.22 (0.180–0.260) 39 (32–46)2005 < 1 0.048 (0.020–0.088) 7.5 (3.1–14) 0.43 (0.210–0.740) 67 (33–115) 0.23 (0.190–0.280) 36 (30–43)2009 < 1 0.048 (0.020–0.086) 6.6 (2.8–12) 0.43 (0.210–0.740) 61 (29–104) 0.24 (0.200–0.290) 33 (28–40)2010 < 1 0.048 (0.020–0.087) 6.5 (2.8–12) 0.44 (0.210–0.750) 60 (29–102) 0.25 (0.200–0.290) 33 (28–40)2011 < 1 0.048 (0.021–0.088) 6.4 (2.7–12) 0.45 (0.220–0.760) 60 (29–101) 0.26 (0.210–0.310) 34 (28–41)Congo 1990 2 0.7 (0.220–1.4) 29 (9.3–60) 5.9 (2.3–11) 246 (95–469) 4 (2.5–6.0) 169 (104–250)1995 3 0.82 (0.340–1.5) 30 (12–55) 8.2 (4.2–14) 299 (152–495) 6.7 (5.5–8.0) 245 (200–294)2000 3 1.1 (0.490–2.0) 35 (16–62) 13 (6.4–21) 403 (205–665) 11 (9.3–13) 353 (298–412)2005 4 1.7 (0.710–3.0) 47 (20–84) 18 (9.0–30) 513 (256–858) 15 (12–18) 425 (347–510)2009 4 1.7 (0.750–3.1) 44 (19–80) 19 (9.5–32) 484 (242–809) 16 (13–19) 395 (323–474)2010 4 1.8 (0.760–3.2) 44 (19–79) 19 (9.6–33) 480 (238–806) 16 (13–19) 391 (320–470)2011 4 1.8 (0.770–3.2) 43 (19–77) 20 (9.7–33) 473 (235–794) 16 (13–19) 387 (317–465)Côte d'Ivoire 1990 13 4.9 (2.0–9.2) 39 (16–73) 43 (21–72) 345 (170–579) 30 (26–34) 238 (206–272)1995 15 8.4 (3.3–16) 57 (23–108) 74 (37–130) 506 (249–853) 56 (48–64) 380 (329–434)2000 17 9.2 (3.6–17) 55 (22–104) 82 (41–140) 493 (244–828) 61 (53–70) 370 (321–423)2005 18 6.8 (2.9–12) 38 (16–69) 65 (34–110) 359 (187–585) 48 (42–55) 268 (232–306)2009 19 5.2 (2.4–9.3) 27 (12–48) 53 (28–86) 276 (146–447) 41 (36–47) 212 (184–242)2010 20 4.8 (2.2–8.4) 24 (11–42) 50 (26–82) 253 (131–414) 38 (33–43) 190 (165–217)2011 20 4.8 (2.2–8.5) 24 (11–42) 50 (26–82) 250 (131–407) 38 (33–44) 191 (165–218)Democratic 1990 36 27 (10–51) 73 (28–139) 220 (100–390) 616 (281–1 080) 120 (95–150) 327 (262–398)Republic 1995 44 29 (12–55) 66 (26–125) 250 (120–440) 576 (274–987) 140 (120–170) 327 (268–392)of the Congo 2000 50 30 (12–55) 60 (25–111) 270 (130–450) 543 (267–914) 160 (140–190) 327 (273–385)2005 57 31 (13–55) 54 (23–96) 290 (150–480) 507 (259–838) 190 (160–220) 327 (279–379)2009 64 34 (15–60) 53 (23–94) 320 (170–530) 503 (258–828) 210 (180–240) 327 (283–374)2010 66 35 (15–62) 53 (23–95) 330 (170–550) 506 (259–834) 220 (190–250) 327 (282–375)2011 68 36 (16–65) 54 (24–96) 350 (180–570) 512 (263–842) 220 (190–250) 327 (282–375)Equatorial 1990 < 1 0.076 (0–0.540) 20 (0–145) 1.7 (0.850–2.9) 463 (227–780) 0.9 (0.790–1.0) 241 (211–273)Guinea 1995 < 1 0.1 (0–0.740) 23 (0–168) 2.3 (1.1–4.0) 527 (257–893) 1.2 (1.1–1.4) 279 (245–316)2000 < 1 0.1 (0–0.740) 20 (0–143) 2.4 (1.2–4.1) 465 (231–780) 1.4 (1.2–1.6) 268 (235–304)2005 < 1 0.077 (0–0.500) 13 (0–82) 1.9 (0.970–3.1) 307 (160–502) 1.3 (1.1–1.4) 206 (181–234)2009 < 1 0.073 (0–0.440) 11 (0–65) 1.9 (0.980–3.0) 272 (144–440) 1.4 (1.2–1.6) 202 (177–229)2010 < 1 0.08 (0–0.490) 11 (0–70) 2 (1.1–3.3) 288 (152–466) 1.5 (1.3–1.7) 215 (189–244)2011 < 1 0.075 (
YEARPOPULATION(MILLIONS)MORTALITY (EXCLUDING HIV) PREVALENCE (INCLUDING HIV) INCIDENCE (INCLUDING HIV)NUMBER(THOUSANDS)RATE aNUMBER(THOUSANDS)RATE aNUMBER(THOUSANDS)Ethiopia 1990 48 24 (14–36) 49 (29–73) 210 (140–290) 425 (285–593) 180 (110–270) 367 (218–553)1995 57 27 (16–41) 48 (28–72) 270 (200–370) 480 (342–642) 240 (140–360) 419 (249–633)2000 66 27 (16–41) 41 (25–63) 280 (210–370) 430 (318–560) 280 (160–420) 421 (251–636)2005 74 21 (13–32) 29 (17–44) 250 (190–320) 333 (251–425) 250 (150–380) 342 (203–516)2009 81 17 (12–24) 21 (14–29) 220 (170–270) 265 (208–329) 230 (160–310) 280 (191–385)2010 83 16 (12–22) 20 (14–26) 210 (170–250) 251 (200–307) 220 (160–300) 269 (191–359)2011 85 15 (11–20) 18 (14–24) 200 (160–240) 237 (191–288) 220 (160–280) 258 (191–335)Gabon 1990 < 1 0.37 (0.160–0.680) 40 (17–74) 3.4 (1.7–5.8) 370 (182–623) 2 (1.7–2.4) 220 (182–262)1995 1 0.62 (0.250–1.2) 57 (23–106) 5.5 (2.7–9.3) 502 (244–851) 3.4 (2.8–4.1) 314 (259–374)2000 1 0.99 (0.390–1.9) 80 (32–151) 8.9 (4.4–15) 722 (354–1 220) 6.5 (5.4–7.7) 527 (435–627)2005 1 1.1 (0.430–2.0) 77 (31–144) 10 (5.1–17) 732 (369–1 220) 8 (6.6–9.6) 586 (484–698)2009 1 0.86 (0.360–1.6) 58 (25–106) 8.9 (4.6–15) 602 (311–987) 7.5 (6.2–9.0) 511 (422–609)2010 2 0.76 (0.330–1.4) 51 (22–92) 8.2 (4.2–13) 545 (282–893) 7.2 (5.9–8.5) 475 (392–566)2011 2 0.69 (0.300–1.3) 45 (20–82) 7.8 (4.0–13) 505 (259–831) 6.9 (5.7–8.2) 450 (372–536)Gambia 1990 < 1 0.35 (0.110–0.710) 36 (12–73) 3.2 (1.1–6.4) 335 (117–664) 1.8 (1.1–2.6) 185 (114–273)1995 1 0.44 (0.180–0.790) 39 (16–70) 4 (2.0–6.8) 358 (173–607) 2.3 (1.9–2.8) 204 (167–245)2000 1 0.48 (0.210–0.860) 37 (16–66) 4.6 (2.2–7.9) 357 (173–608) 2.9 (2.4–3.5) 225 (184–271)2005 2 0.61 (0.260–1.1) 40 (17–73) 5.8 (2.8–9.9) 388 (189–656) 3.7 (3.1–4.5) 248 (203–298)2009 2 0.77 (0.330–1.4) 46 (19–84) 7.2 (3.6–12) 430 (212–722) 4.5 (3.7–5.4) 269 (221–321)2010 2 0.82 (0.350–1.5) 48 (20–87) 7.6 (3.8–13) 442 (218–743) 4.7 (3.9–5.6) 273 (226–325)2011 2 0.88 (0.370–1.6) 49 (21–90) 8.1 (4.0–14) 455 (225–764) 4.9 (4.1–5.9) 279 (230–331)Ghana 1990 15 4.8 (1.1–11) 32 (7.8–74) 42 (11–95) 286 (74–641) 23 (10–41) 155 (69–275)1995 17 4.6 (1.4–9.9) 27 (8.1–58) 43 (14–88) 256 (85–518) 28 (16–45) 167 (93–263)2000 19 4.5 (1.5–9.0) 23 (7.9–47) 42 (17–79) 219 (86–412) 29 (19–42) 152 (97–220)2005 22 3.6 (1.4–6.8) 17 (6.5–31) 35 (16–62) 163 (75–285) 26 (19–33) 119 (88–154)2009 24 2.7 (1.3–4.7) 11 (5.3–20) 29 (15–47) 121 (63–197) 22 (19–25) 92 (81–103)2010 24 2.2 (1.1–3.8) 9.1 (4.3–16) 25 (13–42) 104 (53–172) 21 (18–24) 86 (75–97)2011 25 1.9 (0.880–3.2) 7.5 (3.5–13) 23 (11–39) 92 (44–158) 20 (17–22) 79 (69–89)Guinea 1990 6 3.5 (1.3–6.8) 62 (23–118) 29 (13–51) 503 (226–887) 14 (12–17) 247 (204–295)1995 8 4.1 (1.6–7.7) 54 (21–102) 34 (16–59) 450 (208–784) 19 (16–22) 249 (205–297)2000 8 3.7 (1.4–6.9) 44 (17–83) 32 (15–55) 383 (183–654) 20 (16–23) 234 (193–279)2005 9 3.1 (1.3–5.7) 34 (14–63) 28 (14–48) 315 (156–530) 19 (16–23) 211 (173–251)2009 10 2.6 (1.1–4.6) 26 (11–47) 26 (13–43) 262 (132–438) 18 (15–22) 187 (154–223)2010 10 2.5 (1.1–4.5) 25 (11–45) 25 (13–42) 255 (129–424) 19 (15–22) 188 (155–224)2011 10 2.4 (1.0–4.3) 23 (10–42) 25 (12–41) 242 (121–404) 19 (15–22) 183 (151–219)Guinea-Bissau 1990 1 0.21 (0.061–0.450) 21 (6.0–44) 2.3 (0.790–4.7) 229 (78–459) 1.6 (1.1–2.2) 158 (108–217)1995 1 0.25 (0.110–0.460) 22 (9.5–40) 2.7 (1.2–4.9) 244 (109–432) 2 (1.6–2.3) 174 (142–209)2000 1 0.39 (0.170–0.700) 31 (13–57) 3.7 (1.8–6.3) 300 (147–506) 2.4 (1.9–2.9) 192 (157–230)2005 1 0.37 (0.160–0.660) 27 (12–48) 3.9 (1.9–6.6) 285 (137–485) 2.9 (2.4–3.5) 211 (173–254)2009 1 0.42 (0.180–0.760) 29 (12–51) 4.5 (2.2–7.6) 303 (149–510) 3.4 (2.8–4.1) 229 (188–274)2010 2 0.45 (0.200–0.810) 30 (13–54) 4.7 (2.3–7.9) 312 (155–523) 3.5 (2.9–4.2) 233 (192–278)2011 2 0.38 (0.160–0.680) 24 (11–44) 4.1 (2.2–6.8) 268 (139–437) 3.7 (3.0–4.4) 238 (196–283)Kenya 1990 23 6.5 (2.7–12) 28 (11–51) 57 (28–96) 243 (120–408) 33 (28–37) 139 (121–159)1995 27 3.9 (1.8–6.7) 14 (6.6–24) 46 (25–73) 168 (92–266) 46 (43–50) 169 (155–184)2000 31 6 (2.9–10) 19 (9.2–33) 82 (44–130) 261 (140–420) 89 (84–95) 286 (267–305)2005 36 8.5 (4.2–14) 24 (12–41) 120 (62–200) 340 (174–559) 130 (120–140) 359 (339–380)2009 39 7.7 (4.0–13) 20 (10–32) 110 (57–190) 291 (145–486) 120 (120–130) 312 (299–325)2010 41 8.2 (4.2–13) 20 (10–33) 120 (59–190) 288 (146–477) 120 (120–130) 298 (286–311)2011 42 9.2 (4.7–15) 22 (11–36) 120 (63–200) 291 (152–475) 120 (110–120) 288 (276–300)Lesotho 1990 2 0.35 (0.110–0.730) 21 (6.6–44) 4.1 (1.5–8.0) 249 (90–487) 3 (2.2–3.9) 184 (135–240)1995 2 0.27 (0.098–0.530) 15 (5.5–29) 4.8 (2.2–8.5) 268 (121–473) 5.8 (5.1–6.6) 323 (283–367)2000 2 0.3 (0.100–0.590) 15 (5.3–30) 7 (3.1–12) 357 (160–632) 11 (9.5–12) 553 (484–626)2005 2 0.3 (0.075–0.690) 15 (3.6–33) 8.5 (3.5–16) 412 (169–761) 13 (11–16) 639 (535–752)2009 2 0.32 (0.130–0.590) 15 (6.0–28) 8.8 (3.8–16) 410 (178–737) 14 (12–15) 634 (553–721)2010 2 0.34 (0.140–0.610) 16 (6.6–28) 8.9 (3.9–16) 408 (180–727) 14 (12–16) 633 (553–719)2011 2 0.38 (0.170–0.670) 17 (7.7–31) 9 (4.2–16) 411 (190–716) 14 (12–16) 632 (551–717)Liberia 1990 2 0.75 (0.240–1.6) 35 (11–73) 7.3 (2.5–14) 341 (118–680) 4.2 (2.6–6.2) 199 (123–293)1995 2 1 (0.410–1.9) 49 (19–92) 8.8 (4.2–15) 421 (199–725) 4.6 (3.8–5.5) 219 (179–263)2000 3 1.5 (0.590–2.8) 53 (21–99) 13 (6.0–22) 449 (211–774) 6.9 (5.6–8.3) 242 (197–290)2005 3 1.5 (0.650–2.8) 49 (20–89) 14 (6.9–24) 447 (218–756) 8.5 (6.9–10) 266 (218–320)2009 4 1.8 (0.790–3.3) 48 (21–86) 18 (8.6–30) 462 (225–781) 11 (9.1–13) 288 (237–344)2010 4 1.9 (0.830–3.4) 48 (21–85) 19 (9.0–31) 465 (226–788) 12 (9.7–14) 293 (242–349)2011 4 1.9 (0.820–3.4) 45 (20–81) 19 (9.1–32) 453 (222–766) 12 (10–15) 299 (247–356)Madagascar 1990 11 13 (4.8–25) 113 (42–218) 100 (45–180) 911 (402–1 620) 44 (36–53) 391 (322–466)1995 13 11 (4.3–20) 82 (33–153) 91 (43–160) 695 (327–1 200) 44 (36–52) 335 (276–400)2000 15 10 (4.2–19) 68 (28–126) 90 (43–150) 587 (280–1 010) 45 (37–54) 293 (241–349)2005 18 10 (4.2–18) 56 (23–102) 89 (43–150) 498 (240–847) 47 (39–56) 262 (216–313)2009 20 9.9 (4.2–18) 49 (21–89) 90 (43–150) 448 (216–762) 49 (41–59) 245 (202–293)2010 21 9.9 (4.2–18) 48 (20–87) 91 (44–150) 439 (212–745) 50 (41–60) 242 (199–288)2011 21 9.9 (4.2–18) 46 (20–84) 91 (44–160) 428 (207–729) 51 (42–61) 238 (196–284)Malawi 1990 9 3.3 (1.2–6.3) 35 (13–67) 33 (16–58) 354 (166–613) 31 (22–41) 326 (230–438)1995 10 3.5 (1.4–6.5) 35 (14–66) 39 (21–63) 395 (210–638) 46 (38–54) 462 (383–548)2000 11 3.3 (1.3–6.1) 29 (12–54) 40 (21–65) 357 (191–575) 52 (43–62) 467 (387–554)2005 13 2.5 (1.0–4.6) 19 (7.9–36) 34 (18–56) 268 (140–436) 45 (37–54) 354 (292–421)2009 14 2 (0.980–3.4) 14 (6.8–24) 28 (16–44) 195 (110–304) 35 (33–38) 243 (227–260)2010 15 1.9 (0.940–3.3) 13 (6.3–22) 27 (15–42) 180 (101–281) 33 (30–35) 219 (203–236)2011 15 1.9 (0.910–3.2) 12 (5.9–21) 25 (14–39) 164 (93–255) 29 (27–32) 191 (177–206)Mali 1990 9 1.2 (0.540–2.2) 14 (6.3–26) 11 (5.9–18) 129 (67–211) 6.6 (6.3–6.9) 76 (72–80)1995 10 1.3 (0.580–2.3) 13 (5.9–24) 12 (6.5–20) 125 (66–201) 7.9 (7.5–8.3) 80 (76–84)2000 11 1.3 (0.610–2.3) 12 (5.4–21) 13 (7.0–21) 114 (62–183) 8.7 (8.3–9.2) 77 (74–81)2005 13 1.4 (0.650–2.5) 11 (4.9–19) 14 (7.3–22) 103 (56–165) 9.1 (8.7–9.6) 69 (66–73)2009 15 1.4 (0.670–2.4) 9.4 (4.5–16) 14 (7.5–22) 93 (50–150) 9.5 (9.0–10) 64 (61–67)2010 15 1.4 (0.670–2.4) 9.2 (4.4–16) 14 (7.6–23) 92 (49–147) 9.6 (9.2–10) 63 (60–66)2011 16 1.4 (0.680–2.4) 9 (4.3–15) 14 (7.6–23) 90 (48–145) 9.8 (9.3–10) 62 (59–65)Mauritania 1990 2 0.29 (
MORTALITY (EXCLUDING HIV) PREVALENCE (INCLUDING HIV) INCIDENCE (INCLUDING HIV)YEARPOPULATION(MILLIONS)NUMBER(THOUSANDS)RATE aNUMBER(THOUSANDS)RATE aNUMBER(THOUSANDS)Niger 1990 8 7.7 (2.9–15) 98 (37–189) 62 (28–110) 795 (354–1 410) 28 (23–33) 358 (295–426)1995 9 6.7 (2.5–13) 73 (27–141) 54 (24–97) 591 (261–1 050) 25 (20–29) 270 (223–321)2000 11 4.9 (1.9–9.3) 45 (18–86) 41 (19–72) 379 (177–656) 21 (17–25) 191 (157–227)2005 13 3.6 (1.5–6.6) 28 (11–51) 32 (16–55) 249 (121–423) 19 (15–22) 142 (118–170)2009 15 2.9 (1.3–5.3) 20 (8.5–35) 28 (14–48) 189 (93–319) 18 (15–21) 119 (98–142)2010 16 2.8 (1.2–5.0) 18 (7.8–32) 27 (13–46) 176 (86–298) 18 (15–21) 113 (94–135)2011 16 2.7 (1.2–4.8) 17 (7.3–30) 27 (13–45) 166 (81–281) 17 (14–21) 108 (90–129)Nigeria 1990 98 28 (0.063–130) 29 (
YEARPOPULATION(MILLIONS)INCIDENCE (INCLUDING HIV) INCIDENCE HIV-POSITIVE NOTIFIED NEW AND RELAPSE CASE DETECTIONNUMBER(THOUSANDS)RATE aNUMBER(THOUSANDS)RATE a NUMBER RATE a PERCENTAlgeria 1990 25 17 (12–22) 66 (48–86) 0.012 (
INCIDENCE (INCLUDING HIV) INCIDENCE HIV-POSITIVE NOTIFIED NEW AND RELAPSE CASE DETECTIONYEARPOPULATION(MILLIONS)NUMBER(THOUSANDS)RATE aNUMBER(THOUSANDS)RATE a NUMBER RATE a PERCENTEthiopia 1990 48 180 (110–270) 367 (218–553) 22 (13–34) 46 (27–70) 88 634 183 50 (33–84)1995 57 240 (140–360) 419 (249–633) 65 (38–100) 114 (66–175) 26 034 46 11 (7.2–18)2000 66 280 (160–420) 421 (251–636) 93 (54–140) 141 (82–215) 91 101 139 33 (22–55)2005 74 250 (150–380) 342 (203–516) 72 (42–110) 97 (56–148) 124 262 167 49 (32–82)2009 81 230 (160–310) 280 (191–385) 47 (31–66) 58 (38–81) 148 936 183 66 (48–96)2010 83 220 (160–300) 269 (191–359) 42 (29–58) 51 (35–70) 154 694 186 69 (52–97)2011 85 220 (160–280) 258 (191–335) 38 (28–49) 45 (33–58) 156 539 185 72 (55–96)Gabon 1990 < 1 2 (1.7–2.4) 220 (182–262) 0.24 (0.200–0.290) 26 (21–31) 917 99 45 (38–54)1995 1 3.4 (2.8–4.1) 314 (259–374) 0.86 (0.680–1.1) 79 (63–98) 1 115 103 33 (27–40)2000 1 6.5 (5.4–7.7) 527 (435–627) 2.5 (2.0–3.1) 203 (162–249)2005 1 8 (6.6–9.6) 586 (484–698) 3.5 (2.8–4.2) 252 (202–307) 2 512 183 31 (26–38)2009 1 7.5 (6.2–9.0) 511 (422–609) 3.2 (2.5–3.9) 214 (172–262) 3 073 208 41 (34–49)2010 2 7.2 (5.9–8.5) 475 (392–566) 3 (2.4–3.6) 197 (158–241) 3 473 231 49 (41–59)2011 2 6.9 (5.7–8.2) 450 (372–536) 2.8 (2.3–3.5) 185 (148–226) 4 404 287 64 (54–77)Gambia 1990 < 1 1.8 (1.1–2.6) 185 (114–273) 0.03 (0.018–0.044) 3.1 (1.9–4.5)1995 1 2.3 (1.9–2.8) 204 (167–245) 0.089 (0.064–0.120) 7.9 (5.6–10) 1 023 91 44 (37–54)2000 1 2.9 (2.4–3.5) 225 (184–271) 0.23 (0.170–0.300) 18 (13–23)2005 2 3.7 (3.1–4.5) 248 (203–298) 0.5 (0.380–0.630) 33 (26–42) 2 031 135 54 (45–67)2009 2 4.5 (3.7–5.4) 269 (221–321) 0.72 (0.580–0.880) 43 (34–52) 2 145 128 48 (40–58)2010 2 4.7 (3.9–5.6) 273 (226–325) 0.75 (0.590–0.940) 44 (34–54) 2 070 120 44 (37–53)2011 2 4.9 (4.1–5.9) 279 (230–331) 0.8 (0.620–0.990) 45 (35–56) 2 248 127 45 (38–55)Ghana 1990 15 23 (10–41) 155 (69–275) 3.4 (1.5–6.0) 23 (10–41) 6 407 43 28 (16–63)1995 17 28 (16–45) 167 (93–263) 7.3 (4.0–12) 43 (23–69) 8 636 51 30 (19–55)2000 19 29 (19–42) 152 (97–220) 9 (5.6–13) 47 (29–69) 10 933 57 37 (26–59)2005 22 26 (19–33) 119 (88–154) 7.6 (5.5–10) 35 (25–47) 12 124 56 47 (36–63)2009 24 22 (19–25) 92 (81–103) 4.9 (4.3–5.5) 21 (18–23) 14 892 63 68 (61–77)2010 24 21 (18–24) 86 (75–97) 5.5 (4.8–6.3) 23 (20–26) 14 607 60 70 (62–79)2011 25 20 (17–22) 79 (69–89) 4.6 (4.0–5.2) 18 (16–21) 15 389 62 78 (69–89)Guinea 1990 6 14 (12–17) 247 (204–295) 1.8 (1.4–2.1) 31 (25–36) 1 988 35 14 (12–17)1995 8 19 (16–22) 249 (205–297) 3.8 (2.9–4.7) 50 (38–63) 3 523 47 19 (16–23)2000 8 20 (16–23) 234 (193–279) 4.9 (3.8–6.1) 58 (45–73) 5 440 65 28 (23–34)2005 9 19 (16–23) 211 (173–251) 5 (3.9–6.2) 55 (43–69) 6 863 76 36 (30–44)2009 10 18 (15–22) 187 (154–223) 4.3 (3.5–5.2) 44 (36–53) 8 357 86 46 (38–56)2010 10 19 (15–22) 188 (155–224) 4.8 (3.9–5.8) 48 (40–58) 11 038 111 59 (49–71)2011 10 19 (15–22) 183 (151–219) 4.8 (3.9–5.7) 47 (38–56) 11 359 111 61 (51–74)Guinea-Bissau 1990 1 1.6 (1.1–2.2) 158 (108–217) 0.05 (0.034–0.070) 5 (3.4–6.8) 1 163 114 73 (53–110)1995 1 2 (1.6–2.3) 174 (142–209) 0.14 (0.100–0.180) 12 (9.0–16) 1 613 143 82 (69–100)2000 1 2.4 (1.9–2.9) 192 (157–230) 0.31 (0.240–0.390) 25 (19–31) 1 273 103 54 (45–65)2005 1 2.9 (2.4–3.5) 211 (173–254) 0.55 (0.430–0.690) 41 (32–51) 1 774 130 61 (51–75)2009 1 3.4 (2.8–4.1) 229 (188–274) 0.78 (0.610–0.960) 52 (41–65) 2 171 146 64 (53–78)2010 2 3.5 (2.9–4.2) 233 (192–278) 0.84 (0.660–1.0) 56 (44–69) 2 183 144 62 (52–75)2011 2 3.7 (3.0–4.4) 238 (196–283) 1.5 (1.2–1.9) 99 (81–120) 2 063 133 56 (47–68)Kenya 1990 23 33 (28–37) 139 (121–159) 5.5 (4.8–6.4) 24 (20–27) 11 788 50 36 (32–41)1995 27 46 (43–50) 169 (155–184) 23 (20–26) 84 (74–95) 28 142 103 61 (56–66)2000 31 89 (84–95) 286 (267–305) 47 (42–52) 149 (133–166) 64 159 205 72 (67–77)2005 36 130 (120–140) 359 (339–380) 59 (52–66) 165 (147–184) 102 680 288 80 (76–85)2009 39 120 (120–130) 312 (299–325) 54 (52–56) 136 (131–142) 102 997 261 84 (80–87)2010 41 120 (120–130) 298 (286–311) 50 (48–52) 123 (118–129) 99 272 245 82 (79–86)2011 42 120 (110–120) 288 (276–300) 47 (45–49) 113 (109–118) 97 320 234 81 (78–85)Lesotho 1990 2 3 (2.2–3.9) 184 (135–240) 0.16 (0.120–0.210) 9.8 (7.1–13) 2 525 154 84 (64–110)1995 2 5.8 (5.1–6.6) 323 (283–367) 3.1 (2.6–3.6) 172 (146–201) 5 181 289 89 (79–100)2000 2 11 (9.5–12) 553 (484–626) 8.3 (7.2–9.5) 425 (367–486) 9 746 496 90 (79–100)2005 2 13 (11–16) 639 (535–752) 10 (8.4–12) 490 (406–581) 10 802 523 82 (70–98)2009 2 14 (12–15) 634 (553–721) 10 (9.1–12) 485 (423–552) 12 213 568 90 (79–100)2010 2 14 (12–16) 633 (553–719) 11 (9.2–12) 487 (425–553) 11 674 538 85 (75–97)2011 2 14 (12–16) 632 (551–717) 11 (9.2–12) 481 (420–547) 11 432 521 82 (73–94)Liberia 1990 2 4.2 (2.6–6.2) 199 (123–293) 0.16 (0.098–0.240) 7.5 (4.6–11)1995 2 4.6 (3.8–5.5) 219 (179–263) 0.43 (0.330–0.540) 20 (16–26) 1 393 67 30 (25–37)2000 3 6.9 (5.6–8.3) 242 (197–290) 0.94 (0.740–1.2) 33 (26–41) 1 500 53 22 (18–27)2005 3 8.5 (6.9–10) 266 (218–320) 1.1 (0.830–1.3) 33 (26–41) 3 432 108 40 (34–50)2009 4 11 (9.1–13) 288 (237–344) 0.98 (0.760–1.2) 25 (20–32) 5 918 154 54 (45–65)2010 4 12 (9.7–14) 293 (242–349) 0.94 (0.750–1.1) 23 (19–29) 6 597 165 56 (47–68)2011 4 12 (10–15) 299 (247–356) 1.3 (1.0–1.6) 31 (25–38) 7 906 191 64 (54–78)Madagascar 1990 11 44 (36–53) 391 (322–466) 0.062 (0.051–0.074) 0.6 (0.45–0.66) 6 261 56 14 (12–17)1995 13 44 (36–52) 335 (276–400) 0.097 (0.071–0.130) 0.7 (0.54–0.97) 21 616 165 49 (41–60)2000 15 45 (37–54) 293 (241–349) 0.12 (0.092–0.160) 0.8 (0.60–1.0)2005 18 47 (39–56) 262 (216–313) 0.13 (0.097–0.170) 0.7 (0.54–0.95) 18 993 106 41 (34–49)2009 20 49 (41–59) 245 (202–293) 0.12 (0.090–0.160) 0.6 (0.45–0.79) 22 758 113 46 (39–56)2010 21 50 (41–60) 242 (199–288) 0.12 (0.079–0.170) 0.6 (0.38–0.80) 24 432 118 49 (41–59)2011 21 51 (42–61) 238 (196–284) 0.13 (0.087–0.180) 0.6 (0.41–0.86) 26 019 122 51 (43–62)Malawi 1990 9 31 (22–41) 326 (230–438) 16 (11–21) 166 (117–223) 12 395 132 41 (30–57)1995 10 46 (38–54) 462 (383–548) 29 (24–36) 298 (242–360) 19 155 194 42 (35–51)2000 11 52 (43–62) 467 (387–554) 36 (30–44) 324 (264–390) 23 604 210 45 (38–54)2005 13 45 (37–54) 354 (292–421) 31 (25–38) 244 (198–295) 25 491 199 56 (47–68)2009 14 35 (33–38) 243 (227–260) 23 (21–24) 157 (146–168) 22 674 157 65 (60–69)2010 15 33 (30–35) 219 (203–236) 21 (19–22) 138 (128–149) 21 092 142 65 (60–70)2011 15 29 (27–32) 191 (177–206) 18 (16–19) 114 (105–123) 19 361 126 66 (61–71)Mali 1990 9 6.6 (6.3–6.9) 76 (72–80) 0.88 (0.830–0.920) 10 (9.6–11) 2 933 34 45 (42–47)1995 10 7.9 (7.5–8.3) 80 (76–84) 1.6 (1.3–1.8) 16 (14–18) 3 087 31 39 (37–41)2000 11 8.7 (8.3–9.2) 77 (74–81) 1.8 (1.6–2.1) 16 (14–19) 4 216 37 48 (46–51)2005 13 9.1 (8.7–9.6) 69 (66–73) 1.7 (1.4–1.9) 13 (11–15) 4 704 36 52 (49–54)2009 15 9.5 (9.0–10) 64 (61–67) 1.5 (1.3–1.6) 9.9 (9.0–11) 6 611 44 70 (66–73)2010 15 9.6 (9.2–10) 63 (60–66) 1.5 (1.3–1.8) 9.8 (8.3–11) 5 291 34 55 (52–58)2011 16 9.8 (9.3–10) 62 (59–65) 1.5 (1.3–1.7) 9.4 (7.9–11) 5 428 34 56 (53–58)Mauritania 1990 2 4.5 (2.8–6.7) 228 (140–336) 0.18 (0.110–0.260) 9 (5.5–13) 5 284 265 120 (79–190)1995 2 5.8 (4.7–6.9) 251 (205–302) 0.35 (0.250–0.450) 15 (11–20) 3 849 168 67 (56–82)2000 3 7.3 (6.0–8.8) 277 (226–333) 0.55 (0.410–0.710) 21 (16–27) 3 067 116 42 (35–51)2005 3 9.3 (7.6–11) 305 (250–367) 0.83 (0.630–1.1) 27 (21–35) 2 162 71 23 (19–28)2009 3 11 (9.2–13) 330 (271–395) 1.2 (0.940–1.6) 37 (28–46) 2 640 78 24 (20–29)2010 3 12 (9.6–14) 337 (277–402) 1.4 (1.1–1.7) 40 (31–50) 2 461 71 21 (18–26)2011 4 12 (10–15) 344 (283–410) 1.5 (1.2–1.9) 43 (33–55) 1 776 50 15 (12–18)Mauritius 1990 1 0.29 (0.180–0.430) 28 (17–41)
YEARPOPULATION(MILLIONS)INCIDENCE (INCLUDING HIV) INCIDENCE HIV-POSITIVE NOTIFIED NEW AND RELAPSE CASE DETECTIONNUMBER(THOUSANDS)RATE aNUMBER(THOUSANDS)RATE a NUMBER RATE a PERCENTNiger 1990 8 28 (23–33) 358 (295–426) 1.3 (1.0–1.5) 16 (13–19) 5 200 67 19 (16–23)1995 9 25 (20–29) 270 (223–321) 1.8 (1.3–2.3) 19 (15–25) 1 980 22 8 (6.7–9.7)2000 11 21 (17–25) 191 (157–227) 2 (1.5–2.5) 18 (14–23) 4 701 43 23 (19–27)2005 13 19 (15–22) 142 (118–170) 1.9 (1.5–2.4) 15 (11–19) 7 873 61 43 (36–52)2009 15 18 (15–21) 119 (98–142) 1.8 (1.3–2.4) 12 (8.5–16) 9 904 66 56 (47–67)2010 16 18 (15–21) 113 (94–135) 1.8 (1.3–2.2) 11 (8.7–14) 10 130 65 58 (48–70)2011 16 17 (14–21) 108 (90–129) 1.7 (1.3–2.2) 11 (8.2–14) 10 325 64 59 (50–72)Nigeria 1990 98 130 (1.3–510) 128 (1.3–526) 2.7 (0.029–11) 2.8 (
NEW AND RELAPSENOTIFICATION RATE aYEARNEW ANDNEW CASESSMEAR- SMEAR-NEGATIVE/POSITIVE UNKNOWNEXTRA-RE-TREAT EXCL.OTHER RELAPSEPULMONARY RELAPSETOTALRETREATHISTORYUNKNOWN% SMEAR-POS AMONGNEW PULM1990–2011RELAPSEAlgeria 1990 11 607 –1995 13 507 5 735 2 256 5 065 451 451 722000 18 572 8 328 2 019 7 758 467 80 547 802005 21 336 8 654 1 651 10 216 267 548 165 713 842009 21 701 8 402 1 691 10 888 230 490 122 612 0 832010 22 336 8 299 1 770 11 770 0 497 194 691 0 82• 46 60 • 2011 21 429 7 790 1 753 11 444 0 442 168 610 0 82Angola 1990 10 271 –1995 5 143 3 804 1 631 266 134 134 702000 16 062 9 053 5 367 1 102 540 540 632005 37 175 20 410 12 467 2 569 1 729 1 142 2 871 622009 41 221 22 488 13 755 2 580 0 2 398 1 465 3 863 0 622010 44 655 21 146 17 285 3 780 2 444 5 332 7 776 55• 99 241 • 2011 47 240 21 703 18 380 4 399 0 2 758 1 686 4 444 0 54Benin 1990 2 074 1 410 310 182 172 49 221 821995 2 400 1 839 281 212 68 68 872000 2 697 2 277 130 199 91 189 280 952005 3 270 2 739 96 285 150 187 337 972009 3 878 2 960 338 418 0 162 109 271 0 902010 3 756 2 973 296 367 0 120 85 205 0 91• 43 46 • 2011 4 212 3 331 329 398 0 154 108 262 0 91Botswana 1990 2 938 –1995 5 665 1 903 2 885 720 147 147 402000 9 292 3 091 4 789 1 231 181 1 058 1 239 392005 10 058 3 170 5 166 1 220 502 46 548 382009 8 362 3 144 3 393 1 429 0 396 726 1 122 0 482010 7 013 3 295 2 055 1 210 0 453 619 1 072 0 62• 213 325 • 2011 6 603 2 669 1 983 1 213 0 738 130 868 0 57Burkina Faso 1990 1 497 –1995 2 572 1 028 195 195 45 45 842000 2 331 1 545 196 502 88 90 178 0 892005 3 478 2 290 367 571 90 160 167 327 0 862009 4 716 3 061 679 671 92 213 395 608 0 822010 4 800 3 041 736 729 77 217 335 552 0 81• 16 31 • 2011 5 286 3 450 692 742 175 227 257 484 0 83Burundi 1990 4 575 –1995 3 326 1 121 908 1 116 181 181 552000 6 421 3 159 1 489 1 568 0 205 20 225 0 682005 6 585 3 262 1 160 2 089 0 74 42 116 0 742009 7 277 3 974 1 207 1 880 24 192 46 238 0 772010 7 611 4 590 963 1 826 8 224 108 332 0 83• 82 79 • 2011 6 742 4 060 799 1 649 5 229 86 315 0 84Cameroon 1990 5 892 –1995 3 292 2 896 142 18 236 236 952000 5 251 3 960 625 415 251 251 862005 21 499 13 001 5 021 2 461 0 1 016 574 1 590 0 722009 24 662 14 635 5 780 3 190 0 1 057 512 1 569 0 722010 24 073 14 464 5 437 3 157 0 1 015 479 1 494 0 73• 48 122 • 2011 24 533 14 927 4 941 3 597 0 1 068 593 1 661 0 75Cape Verde 1990 221 –1995 303 111 150 12 30 30 432000 –2005 292 135 93 43 0 21 13 34 0 592009 332 172 94 53 0 13 20 33 0 652010 356 186 98 54 18 9 27 65• 63 76 • 2011 380 182 127 54 0 17 10 27 0 59Central African 1990 2 124 –Republic 1995 3 339 1 794 964 393 188 188 652000 –2005 3 210 2 153 608 286 0 163 128 291 0 782009 8 743 5 132 1 841 1 394 376 253 629 742010 6 643 3 638 1 598 1 079 24 304 117 421 0 69• 72 125 • 2011 5 611 3 479 964 876 60 232 113 345 0 78Chad 1990 2 591 –1995 3 186 2 002 518 463 203 203 792000 –2005 6 311 2 516 2 419 1 055 321 194 515 512009 8 411 3 820 2 949 1 206 0 436 240 676 0 562010 9 452 3 833 3 746 1 217 193 463 245 708 0 51• 43 91 • 2011 10 505 4 434 4 211 1 033 249 578 269 847 0 51Comoros 1990 140 –1995 123 103 10 7 7 7 912000 120 87 14 15 4 1 5 862005 111 79 14 16 0 2 1 3 0 852009 120 76 15 24 0 5 1 6 8 842010 –• 32 16 • 2011 117 62 13 28 5 9 2 11 0 83Congo 1990 591 –1995 3 615 2 013 849 675 78 78 702000 9 239 4 218 2 016 2 810 169 650 819 682005 9 853 3 640 3 249 2 665 299 108 407 532009 9 765 3 433 3 398 2 653 0 281 170 451 0 502010 10 150 3 568 3 545 2 692 345 171 516 50• 25 265 • 2011 10 975 3 716 3 930 2 990 0 339 168 507 0 49Côte d'Ivoire 1990 7 841 –1995 11 988 8 254 1 508 1 577 649 649 852000 15 094 10 276 1 616 2 756 0 446 447 893 0 862005 19 681 12 496 2 315 4 235 0 635 345 980 0 842009 22 571 14 300 2 321 4 952 0 998 438 1 436 0 862010 22 708 14 131 2 381 5 179 0 1 017 502 1 519 0 86• 63 112 • 2011 22 476 14 416 2 316 4 729 0 1 015 444 1 459 0 86Democratic 1990 21 131 –Republic 1995 42 819 20 914 7 953 9 112 2 891 2 891 72of the Congo 2000 61 024 36 513 8 089 13 785 2 637 2 637 822005 97 075 65 040 9 959 18 494 3 582 2 483 6 065 872009 111 709 73 078 12 968 21 313 4 350 4 316 8 666 852010 114 170 73 653 14 039 22 340 0 4 138 4 466 8 604 0 84• 58 163 • 2011 110 132 71 321 13 471 21 579 3 761 4 158 7 919 84Equatorial 1990 260 –Guinea 1995 306 219 45 41 1 1 832000 –2005 –2009 707 490 109 77 0 31 13 44 0 822010 820 579 98 109 0 34 33 67 0 86• 70 123 • 2011 883 611 118 131 0 23 30 53 0 84AFRICAN REGIONaRates are per 100 000 population.GLOBAL TUBERCULOSIS REPORT 2012 Data can be downloaded from www.who.int/tb/data 155
NEW AND RELAPSENOTIFICATION RATE a1990–2011YEARNEW ANDRELAPSENEW CASESSMEAR- SMEAR-NEGATIVE/POSITIVE UNKNOWNEXTRA-RE-TREAT EXCL.OTHER RELAPSEPULMONARY RELAPSETOTALRETREATHISTORYUNKNOWN% SMEAR-POS AMONGNEW PULMEritrea 1990 3 699 –1995 21 453 18 205 3 248 –2000 6 652 590 5 332 683 47 20 67 102005 3 549 687 1 764 1 001 97 27 124 36 282009 2 904 802 1 123 890 0 89 118 207 0 422010 2 870 832 1 115 836 0 87 121 208 0 43• 117 56 • 2011 3 049 835 1 163 888 60 103 44 147 0 42Ethiopia 1990 88 634 –1995 26 034 9 040 8 888 7 763 343 343 502000 91 101 30 510 30 565 28 907 1 119 1 658 2 777 502005 124 262 38 525 39 816 43 675 2 246 873 3 119 492009 148 936 44 396 52 053 50 228 2 259 1 285 3 544 462010 154 694 46 634 54 979 50 417 0 2 664 2 234 4 898 46• 183 185 • 2011 156 539 49 594 55 497 49 305 0 2 143 2 478 4 621 0 47Gabon 1990 917 –1995 1 115 486 517 68 44 44 482000 –2005 2 512 1 042 1 071 241 158 99 257 492009 3 073 1 244 1 414 246 0 169 486 655 0 472010 3 473 1 560 1 366 379 0 168 390 558 317 53• 99 287 • 2011 4 404 1 740 1 959 384 0 321 512 833 0 47Gambia 1990 –1995 1 023 778 171 68 6 6 822000 –2005 2 031 1 127 749 78 0 77 89 166 0 602009 2 145 1 316 622 141 0 66 41 107 682010 2 070 1 344 462 143 81 40 41 81 0 74• 0 127 • 2011 2 248 1 375 673 199 1 138 139 0 67Ghana 1990 6 407 –1995 8 636 2 638 1 225 109 159 159 682000 10 933 7 316 2 500 615 502 502 752005 12 124 7 505 3 068 1 019 532 532 712009 14 892 8 255 4 734 1 437 0 466 394 860 0 642010 14 607 7 656 5 068 1 400 0 483 538 1 021 0 60• 43 62 • 2011 15 389 7 616 5 875 1 471 427 451 878 56Guinea 1990 1 988 –1995 3 523 2 263 527 620 55 55 812000 5 440 3 920 430 938 152 294 446 902005 6 863 5 479 524 629 231 227 458 912009 8 357 5 377 1 021 1 611 0 348 241 589 16 842010 11 038 7 041 1 472 2 077 86 362 286 648 0 83• 35 111 • 2011 11 359 6 934 1 446 2 284 273 422 247 669 83Guinea-Bissau 1990 1 163 –1995 1 613 956 714 19 59 59 572000 1 273 526 600 57 90 90 472005 1 774 1 132 522 24 0 96 42 138 0 682009 2 171 1 310 786 16 0 59 17 76 0 622010 2 183 1 409 636 22 0 116 76 192 0 69• 114 133 • 2011 2 063 1 230 644 63 0 126 7 133 0 66Kenya 1990 11 788 6 800 1001995 28 142 13 934 9 676 3 468 1 064 1 064 592000 64 159 28 773 24 143 9 118 1 773 704 2 477 542005 102 680 40 389 43 772 15 265 3 254 5 721 8 975 482009 102 997 37 402 44 514 17 438 3 643 7 068 10 711 462010 99 272 36 260 41 962 17 382 0 3 668 6 811 10 479 0 46• 50 234 • 2011 97 320 37 085 39 810 17 069 0 3 356 6 661 10 017 0 48Lesotho 1990 2 525 –1995 5 181 1 361 2 685 653 147 147 342000 9 746 3 041 2 838 2 520 385 1 096 1 481 522005 10 802 4 280 4 063 2 020 439 602 1 041 512009 12 213 3 976 5 083 2 486 668 1 302 1 970 442010 11 674 3 600 5 331 2 222 521 1 464 1 985 40• 154 521 • 2011 11 432 3 510 5 343 2 099 480 1 196 1 676 40Liberia 1990 –1995 1 393 1 154 119 120 912000 1 500 1 021 285 187 7 25 32 782005 3 432 2 167 575 657 33 24 57 792009 5 918 3 796 1 022 1 023 0 77 46 123 0 792010 6 597 3 750 1 385 1 363 0 99 71 170 0 73• 0 191 • 2011 7 906 4 261 1 967 1 612 0 66 59 125 0 68Madagascar 1990 6 261 –1995 21 616 8 026 987 2 219 596 596 892000 –2005 18 993 13 056 1 287 3 634 0 1 016 482 1 498 0 912009 22 758 15 729 1 639 3 990 0 1 400 689 2 089 0 912010 24 432 16 795 1 657 4 545 0 1 435 674 2 109 0 91• 56 122 • 2011 26 019 17 927 1 726 4 851 1 515 703 2 218 91Malawi 1990 12 395 4 301 5 827 1 885 382 382 421995 19 155 6 285 7 054 5 257 551 551 472000 23 604 8 260 8 846 5 734 764 0 764 482005 25 491 8 443 10 132 5 823 1 093 2 119 3 212 452009 22 674 7 623 9 297 4 966 0 788 1 682 2 470 0 452010 21 092 7 240 8 245 4 857 0 750 1 444 2 194 47• 132 126 • 2011 19 361 7 003 6 612 5 076 670 1 493 2 163 51Mali 1990 2 933 –1995 3 087 1 866 609 459 153 153 752000 4 216 2 527 797 653 239 239 762005 4 704 3 530 482 492 200 180 380 0 882009 6 611 5 163 429 818 0 201 224 425 0 922010 5 291 3 686 481 926 0 198 157 355 0 88• 34 34 • 2011 5 428 3 777 491 984 176 145 321 88Mauritania 1990 5 284 –1995 3 849 2 074 800 455 520 520 722000 3 067 1 583 687 580 580 358 938 702005 2 162 1 155 454 403 0 150 56 206 0 722009 2 640 1 555 444 483 0 158 24 182 0 782010 2 461 1 422 390 524 0 125 28 153 78• 265 50 • 2011 1 776 1 009 222 458 0 87 16 103 28 82Mauritius 1990 119 –1995 131 113 8 12 2 2 932000 160 115 14 23 8 4 12 892005 125 110 4 8 3 2 5 962009 115 98 7 6 0 4 1 5 0 932010 122 105 5 6 0 6 1 7 0 95• 11 9 • 2011 114 100 3 8 0 3 2 5 0 97aRates are per 100 000 population.156 Data can be downloaded from www.who.int/tb/data GLOBAL TUBERCULOSIS REPORT 2012
NEW AND RELAPSENOTIFICATION RATE a1990–2011YEARNEW ANDRELAPSENEW CASESSMEAR- SMEAR-NEGATIVE/POSITIVE UNKNOWNEXTRA-RE-TREAT EXCL.OTHER RELAPSEPULMONARY RELAPSETOTALRETREATHISTORYUNKNOWN% SMEAR-POS AMONGNEW PULMMozambique 1990 15 899 –1995 17 882 10 566 5 054 1 363 899 899 682000 21 158 13 257 4 037 2 262 917 546 1 463 772005 33 231 17 877 9 184 4 771 1 399 487 1 886 662009 43 221 19 579 17 019 5 301 0 1 322 2 308 3 630 0 532010 43 558 20 097 16 408 5 621 0 1 432 2 616 4 048 0 55• 117 186 • 2011 44 627 19 537 18 159 5 504 0 1 427 2 825 4 252 0 52Namibia 1990 2 671 –1995 1 540 697 507 248 88 88 582000 10 799 4 012 4 724 1 459 604 930 1 534 462005 14 920 5 222 4 455 1 907 2 487 849 974 1 823 542009 11 980 4 608 3 628 2 538 0 1 206 1 352 2 558 0 562010 11 281 4 464 3 309 2 330 1 178 1 344 2 522 57• 189 465 • 2011 10 806 4 503 3 034 2 039 0 1 230 1 132 2 362 0 60Niger 1990 5 200 –1995 1 980 1 492 116 372 932000 4 701 3 045 699 702 255 255 812005 7 873 5 050 1 193 1 227 403 351 754 0 812009 9 904 6 347 1 689 1 385 0 483 207 690 117 792010 10 130 6 283 1 730 1 492 173 452 215 667 0 78• 67 64 • 2011 10 325 6 604 1 856 1 489 376 204 580 185 78Nigeria 1990 20 122 –1995 13 423 9 476 3 364 280 303 303 742000 25 821 17 423 6 613 1 069 716 1 640 2 356 722005 62 598 35 048 22 705 2 836 0 2 009 2 858 4 867 1 392 612009 88 589 44 863 37 540 3 560 0 2 626 5 525 8 151 0 542010 84 121 45 416 32 616 3 422 0 2 667 6 326 8 993 0 58• 21 53 • 2011 86 778 47 436 33 034 3 793 0 2 515 6 272 8 787 0 59Rwanda 1990 6 387 –1995 3 054 1 840 676 338 200 200 732000 6 093 3 681 845 1 289 278 96 374 812005 7 220 4 166 859 1 727 97 371 460 831 832009 7 251 4 184 1 239 1 582 0 246 229 475 164 772010 6 703 3 785 1 072 1 577 269 362 631 78• 90 61 • 2011 6 623 3 811 1 017 1 300 242 253 161 414 0 79Sao Tome and 1990 17 –Principe 1995 –2000 97 30 56 7 4 4 352005 136 49 75 1 0 11 16 27 402009 78 52 20 4 0 2 1 3 0 722010 121 47 63 10 0 1 1 2 0 43• 15 81 • 2011 136 53 49 28 0 6 10 16 0 52Senegal 1990 4 977 –1995 7 561 5 421 1 073 504 563 563 832000 8 508 5 823 1 370 800 0 515 541 1 056 812005 9 765 6 722 1 557 921 565 355 920 812009 11 139 7 883 1 504 1 233 0 519 593 1 112 0 842010 11 061 7 688 1 470 1 404 0 499 530 1 029 0 84• 69 86 • 2011 11 022 7 765 1 389 1 315 0 553 566 1 119 0 85Seychelles 1990 41 –1995 8 6 2 1 0 0 752000 20 11 7 2 0 0 612005 14 8 3 1 0 2 0 2 732009 15 11 2 2 0 0 0 0 0 852010 17 9 8 0 0 0 0 0 0 53• 58 24 • 2011 21 2 13 6 0 0 0 0 0 13Sierra Leone 1990 632 –1995 1 955 1 454 339 121 41 41 812000 3 760 2 472 821 400 67 374 441 752005 6 737 4 370 1 679 551 137 193 330 722009 11 524 6 092 4 491 776 0 165 302 467 0 582010 12 859 6 898 4 919 831 211 336 547 58• 16 212 • 2011 12 734 7 435 4 358 775 166 209 375 63South Africa 1990 80 400 –1995 73 917 23 112 74 399 10 636 179 179 242000 151 239 75 967 16 392 17 486 56 202 56 202 822005 270 178 125 460 76 680 39 739 0 28 299 32 289 60 588 0 622009 360 183 139 468 147 187 53 411 0 20 117 45 799 65 916 0 492010 354 786 132 107 151 772 52 095 0 18 812 41 768 60 580 0 47• 219 681 • 2011 343 715 129 770 148 266 47 285 0 18 394 27 521 45 915 18 738 47Swaziland 1990 –1995 2 050 660 687 219 489 489 492000 5 877 1 823 3 198 583 273 976 1 249 362005 8 062 2 187 4 106 1 458 311 159 470 643 352009 10 038 3 498 4 157 1 903 0 480 994 1 474 0 462010 10 101 3 011 5 064 1 631 395 1 045 1 440 37• 0 693 • 2011 8 337 2 408 4 228 1 395 0 306 843 1 149 0 36Togo 1990 1 324 –1995 1 520 887 304 236 93 93 742000 1 409 984 91 287 47 86 133 922005 2 537 1 798 170 484 85 94 179 4 912009 2 986 2 267 235 377 0 107 107 214 0 912010 2 791 2 096 164 397 0 134 106 240 0 93• 36 47 • 2011 2 888 2 087 205 475 0 121 92 213 0 91Uganda 1990 14 740 –1995 25 316 13 631 5 912 2 070 955 955 702000 30 372 17 246 9 003 2 618 1 505 0 1 505 662005 41 040 20 559 15 040 3 780 0 1 661 769 2 430 582009 41 703 23 113 12 315 4 893 0 1 382 2 632 4 014 652010 42 885 23 456 13 567 4 571 0 1 291 2 661 3 952 0 63• 83 134 • 2011 46 306 25 614 14 389 5 001 1 302 2 712 4 014 64United Republic 1990 22 249 11 553 100of Tanzania 1995 39 847 19 955 12 362 6 195 1 335 1 335 622000 54 442 24 049 17 624 10 997 1 772 1 772 582005 61 022 25 264 20 810 13 094 1 854 3 178 5 032 552009 61 537 24 895 21 750 13 405 1 487 2 730 4 217 532010 61 098 24 769 21 184 13 715 1 430 2 355 3 785 54• 87 128 • 2011 59 357 24 115 20 438 13 725 0 1 079 1 791 2 870 0 54Zambia 1990 16 863 –1995 35 958 10 038 3 268 656 243 243 752000 49 806 12 927 25 222 10 202 1 455 1 455 342005 49 576 14 857 24 327 8 587 1 805 3 691 5 496 382009 44 879 12 995 20 825 9 246 0 1 813 672 2 485 0 382010 44 154 12 639 20 412 9 255 0 1 848 4 462 6 310 0 38• 215 323 • 2011 43 583 12 046 20 004 9 908 1 625 5 011 6 636 38Zimbabwe 1990 9 132 –1995 30 831 8 965 10 934 5 040 737 737 452000 50 855 14 392 27 626 8 837 342005 50 454 13 155 29 074 6 721 0 1 504 4 437 5 941 312009 42 971 10 195 24 890 6 683 0 1 203 3 482 4 685 292010 44 209 11 654 25 157 6 061 0 1 337 3 348 4 685 0 32• 87 301 • 2011 38 404 12 596 19 172 5 192 0 1 444 2 901 4 345 0 40AFRICAN REGIONaRates are per 100 000 population.GLOBAL TUBERCULOSIS REPORT 2012 Data can be downloaded from www.who.int/tb/data 157
TREATMENT SUCCESS (%) a1995–2010YEARNUMBERNOTIFIEDSIZE OFCOHORTCOHORT AS% NOTIFIED% OF COHORTCURED COMPLETED DIED FAILED DEFAULTEDNOTEVALUATEDAlgeria 1995 5 735 –2000 8 328 8 328 100 80 7 1 2 5 52005 8 654 8 379 97 74 13 2 0 3 82008 8 643 8 190 95 80 10 2 0 3 42009 8 402 8 438 100 81 10 2 1 3 3• 0 89 • 2010 8 299 7 894 95 79 10 2 1 4 4Angola 1995 3 804 –2000 9 053 6 392 71 68 3 2 26 22005 20 410 20 113 99 45 28 3 3 19 32008 22 562 22 562 100 45 24 4 2 18 62009 22 488 21 627 96 47 25 4 2 18 5• 0 48 • 2010 21 146 21 145 100 30 18 8 1 8 35Benin 1995 1 839 1 839 100 50 21 6 1 17 52000 2 277 2 277 100 57 20 6 2 11 32005 2 739 2 766 101 74 13 7 2 3 12008 2 966 2 979 100 81 8 6 2 2 12009 2 960 2 963 100 82 9 5 2 1 0• 71 91 • 2010 2 973 2 987 100 84 7 5 2 1 1Botswana 1995 1 903 2 060 108 13 54 5 1 12 152000 3 091 3 991 129 22 55 6 0 7 102005 3 170 3 335 105 37 33 7 1 8 152008 3 217 3 289 102 46 18 5 2 4 242009 3 144 3 492 111 57 22 5 3 4 9• 67 81 • 2010 3 295 3 314 101 50 32 5 2 3 8Burkina Faso 1995 1 028 1 200 117 22 2 5 1 3 672000 1 545 1 574 102 53 7 13 2 16 92005 2 290 2 290 100 66 5 14 7 6 12008 2 757 2 757 100 73 3 11 8 4 12009 3 061 3 061 100 72 4 10 9 4 2• 25 77 • 2010 3 041 3 057 101 74 3 9 7 6 1Burundi 1995 1 121 1 798 160 25 20 3 0 14 382000 3 159 3 465 110 42 39 4 0 13 12005 3 262 3 424 105 52 27 4 0 17 12008 3 610 3 635 101 76 14 4 0 6 02009 3 974 3 974 100 83 7 3 1 5 0• 45 92 • 2010 4 590 4 590 100 87 4 4 1 3 0Cameroon 1995 2 896 2 740 95 45 8 7 1 35 42000 3 960 3 164 80 67 10 7 2 13 12005 13 001 13 169 101 66 7 6 1 14 52008 14 232 14 091 99 62 15 6 1 10 52009 14 635 14 428 99 65 13 6 1 10 5• 53 78 • 2010 14 464 14 464 100 64 14 6 1 10 5Cape Verde 1995 111 –2000 14 – 64 0 7 0 0 292005 135 135 100 56 8 3 2 19 122008 197 197 100 57 17 4 2 11 112009 172 –• 0 0 • 2010 186 –Central African 1995 1 794 692 39 16 21 7 0 53 3Republic 2000 1 366 – 36 21 0 3 34 52005 2 153 3 217 149 38 28 6 2 8 192008 4 232 3 571 84 43 29 7 2 12 92009 5 132 5 132 100 33 20 3 1 13 30• 37 68 • 2010 3 638 3 569 98 45 23 6 1 19 7Chad 1995 2 002 529 26 17 30 6 1 43 32000 –2005 2 516 –2008 3 309 –2009 3 820 3 820 100 55 22 4 2 15 3• 47 68 • 2010 3 833 3 780 99 39 28 4 2 21 5Comoros 1995 103 113 110 90 0 4 0 6 02000 87 85 98 91 2 4 4 0 02005 79 70 89 91 0 3 4 0 12008 77 77 100 90 0 4 0 4 32009 76 –• 90 91 • 2010 87 – 91 0 3 2 1 2Congo 1995 2 013 –2000 4 218 3 114 74 57 12 4 0 22 52005 3 640 4 121 113 24 4 0 1 13 582008 3 371 3 263 97 63 13 1 0 21 12009 3 433 3 634 106 66 12 1 0 13 7• 0 77 • 2010 3 568 3 447 97 63 13 2 1 12 8Côte d'Ivoire 1995 8 254 7 221 87 63 6 4 1 17 92000 10 276 10 631 103 47 10 5 2 16 202005 12 496 12 496 100 62 11 8 2 10 62008 15 294 15 294 100 67 9 9 2 9 42009 14 300 14 300 100 69 10 8 3 7 4• 68 77 • 2010 14 131 14 131 100 66 12 7 2 8 5Democratic 1995 20 914 16 247 78 55 20 5 1 10 9Republic 2000 36 513 36 123 99 69 8 6 1 8 7of the Congo 2005 65 040 65 066 100 80 5 6 1 4 42008 69 720 65 962 95 83 4 4 1 3 42009 73 078 72 367 99 85 3 4 1 3 4• 74 90 • 2010 73 653 73 448 100 86 4 4 1 3 3Equatorial 1995 219 219 100 89 0 3 0 8 0Guinea 2000 –2005 –2008 541 541 100 42 14 4 1 31 72009 490 490 100 47 19 3 1 16 14• 89 70 • 2010 579 590 102 50 20 5 1 17 7Eritrea 1995 –2000 590 765 130 64 12 8 1 9 62005 687 688 100 83 5 7 1 2 12008 839 839 100 72 3 4 1 1 182009 802 804 100 83 2 5 3 2 5• 0 84 • 2010 832 804 97 81 4 7 3 1 5Ethiopia 1995 9 040 5 087 56 56 5 5 2 13 192000 30 510 29 662 97 63 17 6 1 9 42005 38 525 39 430 102 64 14 5 1 4 122008 40 794 40 794 100 67 17 3 1 3 102009 44 396 44 807 101 65 19 3 1 3 10• 61 83 • 2010 46 634 46 634 100 66 17 3 1 3 10Gabon 1995 486 249 51 63 22 1 2 9 22000 –2005 1 042 1 165 112 35 12 10 1 42 12008 1 502 1 502 100 30 24 1 0 19 272009 1 244 1 163 93 37 18 1 1 25 18• 86 63 • 2010 1 560 1 671 107 34 29 2 3 26 6a TREATMENT SUCCESS = percent cured + percent completed then rounded to the nearest digit.158 Data can be downloaded from www.who.int/tb/data GLOBAL TUBERCULOSIS REPORT 2012
TREATMENT SUCCESS (%) a1995–2010YEARNUMBERNOTIFIEDSIZE OFCOHORTCOHORT AS% NOTIFIED% OF COHORTCURED COMPLETED DIED FAILED DEFAULTEDNOTEVALUATEDGambia 1995 778 686 88 69 7 5 1 13 52000 –2005 1 127 1 127 100 81 6 7 1 3 22008 1 300 1 318 101 80 4 9 2 2 32009 1 316 1 296 98 88 1 6 1 2 1• 76 88 • 2010 1 344 1 344 100 86 2 5 1 3 3Ghana 1995 2 638 361 14 41 13 11 2 11 222000 7 316 7 316 100 45 5 6 3 14 272005 7 505 7 584 101 68 5 9 2 11 52008 7 904 7 904 100 78 8 8 1 2 32009 8 255 8 255 100 79 8 7 1 3 3• 54 86 • 2010 7 656 7 656 100 76 10 7 1 3 3Guinea 1995 2 263 2 263 100 62 17 6 2 9 52000 3 920 3 920 100 59 9 7 1 15 92005 5 479 5 811 106 65 7 6 2 10 102008 6 561 4 984 76 70 8 5 2 7 82009 5 377 5 597 104 72 6 5 2 7 8• 78 80 • 2010 7 041 7 250 103 76 4 4 2 6 9Guinea-Bissau 1995 956 959 100 42 23 6 0 23 62000 526 –2005 1 132 1 167 103 51 18 12 1 11 72008 1 223 1 242 102 59 11 4 0 17 92009 1 310 1 498 114 51 17 6 1 21 5• 65 73 • 2010 1 409 1 271 90 54 18 6 0 14 7Kenya 1995 13 934 6 470 46 60 14 9 1 9 72000 28 773 28 376 99 66 14 5 0 9 62005 40 389 40 436 100 71 11 5 0 8 52008 36 811 36 811 100 76 9 4 0 7 42009 37 402 37 402 100 78 8 4 1 6 4• 75 87 • 2010 36 260 36 260 100 81 6 3 1 5 4Lesotho 1995 1 361 1 788 131 32 14 7 0 9 362000 3 041 –2005 4 280 5 542 129 73 8 1 4 142008 3 862 3 858 100 64 9 11 2 4 92009 3 976 4 070 102 59 11 11 2 5 12• 47 69 • 2010 3 600 3 852 107 58 10 10 2 8 12Liberia 1995 1 154 1 595 138 79 5 5 12 02000 1 021 924 90 71 9 2 6 10 32005 2 167 2 167 100 60 16 3 0 12 82008 3 038 3 042 100 64 15 4 2 10 52009 3 796 3 796 100 57 26 5 1 9 3• 79 0 • 2010 3 750 –Madagascar 1995 8 026 9 101 113 47 8 6 2 16 202000 10 506 – 61 9 7 1 17 52005 13 056 15 298 117 67 7 6 1 13 52008 15 391 15 376 100 77 4 5 1 9 52009 15 729 15 709 100 78 3 4 1 9 5• 55 82 • 2010 16 795 16 789 100 78 4 4 1 9 4Malawi 1995 6 285 6 293 100 65 6 19 1 0 102000 8 260 8 296 100 70 3 19 1 4 32005 8 443 8 443 100 72 2 15 1 3 72008 7 627 7 632 100 85 2 8 1 2 22009 7 623 7 624 100 87 2 7 1 2 1• 71 87 • 2010 7 240 7 240 100 86 2 7 1 2 2Mali 1995 1 866 1 290 69 41 18 5 0 22 142000 2 527 –2005 3 530 3 530 100 69 6 11 4 7 32008 4 734 4 734 100 75 6 9 4 4 22009 5 163 4 454 86 66 12 10 4 7 2• 59 76 • 2010 3 686 3 778 102 76 0 8 3 9 4Mauritania 1995 2 074 –2000 1 583 –2005 1 155 1 761 152 44 11 2 1 19 242008 1 605 1 605 100 54 14 2 1 12 172009 1 555 1 563 101 51 12 3 1 10 23• 0 69 • 2010 1 422 1 422 100 55 14 2 1 13 15Mauritius 1995 113 –2000 115 160 139 0 92 2 2 3 02005 110 110 100 86 3 6 52008 85 85 100 87 0 6 0 5 22009 98 98 100 88 0 4 0 4 4• 0 90 • 2010 105 105 100 90 0 4 1 5 0Mozambique 1995 10 566 10 566 100 34 5 3 1 9 482000 13 257 13 296 100 73 2 10 1 11 32005 17 877 17 877 100 78 1 12 1 5 22008 18 824 18 824 100 83 1 10 1 4 12009 19 579 19 579 100 84 1 9 1 3 2• 39 85 • 2010 20 097 20 097 100 83 2 8 1 4 1Namibia 1995 697 –2000 4 012 4 012 100 41 15 6 2 15 212005 5 222 5 222 100 59 16 7 2 10 72008 4 928 4 928 100 72 10 6 4 4 42009 4 608 4 702 102 74 11 5 4 4 2• 0 85 • 2010 4 464 4 538 102 74 11 5 4 3 2Niger 1995 1 492 –2000 3 045 3 193 105 42 22 8 4 12 112005 5 050 5 050 100 49 25 5 2 14 52008 5 853 5 860 100 71 10 6 2 7 42009 6 347 6 313 99 66 13 7 2 7 5• 0 82 • 2010 6 283 6 266 100 69 13 7 2 6 3Nigeria 1995 9 476 9 476 100 34 15 5 2 9 352000 17 423 16 372 94 65 14 6 2 11 22005 35 048 35 080 100 50 25 9 4 11 12008 46 026 46 026 100 68 11 2 5 9 62009 44 863 44 863 100 73 10 5 1 8 4• 49 84 • 2010 45 416 45 416 100 73 10 5 1 8 2Rwanda 1995 1 840 –2000 3 681 3 776 103 52 9 6 1 4 282005 4 166 4 175 100 73 10 6 2 3 62008 4 173 4 173 100 79 8 5 4 2 32009 4 184 4 165 100 77 8 5 4 3 3• 0 88 • 2010 3 785 3 806 101 80 8 5 4 2 1Sao Tome and 1995 –Principe 2000 30 97 323 52 27 9 5 7 02005 49 49 100 98 0 2 0 0 02008 52 52 100 94 0 4 2 0 02009 52 50 96 98 0 0 2 0 0• 0 78 • 2010 47 45 96 20 58 9 0 13 0a TREATMENT SUCCESS = percent cured + percent completed then rounded to the nearest digit.AFRICAN REGIONGLOBAL TUBERCULOSIS REPORT 2012 Data can be downloaded from www.who.int/tb/data 159
TREATMENT SUCCESS (%) a1995–2010YEARNUMBERNOTIFIEDSIZE OFCOHORTCOHORT AS% NOTIFIED% OF COHORTCURED COMPLETED DIED FAILED DEFAULTEDNOTEVALUATEDSenegal 1995 5 421 5 421 100 35 9 4 6 16 312000 5 823 5 823 100 43 9 3 1 21 222005 6 722 6 722 100 70 6 4 2 11 82008 7 584 7 584 100 79 5 4 2 7 42009 7 883 7 883 100 81 3 4 2 5 5• 44 85 • 2010 7 688 7 855 102 81 4 4 2 6 4Seychelles 1995 6 9 150 89 0 11 0 0 02000 11 11 100 82 0 0 0 9 92005 8 –2008 4 6 150 33 67 0 0 0 02009 11 11 100 55 9 18 0 0 18• 89 100 • 2010 9 7 78 100 0 0 0 0 0Sierra Leone 1995 1 454 1 315 90 55 15 5 7 16 22000 2 472 2 296 93 70 7 6 2 13 22005 4 370 4 370 100 77 8 6 1 6 22008 5 826 5 847 100 73 13 4 1 7 22009 6 092 6 083 100 68 10 6 1 11 4• 69 86 • 2010 6 898 6 897 100 77 9 4 1 6 3South Africa 1995 23 112 28 209 122 40 18 4 4 15 192000 75 967 86 276 114 54 9 6 1 13 172005 125 460 134 782 107 58 13 7 2 10 102008 138 803 143 510 103 67 9 8 2 8 72009 139 468 139 458 100 67 6 7 2 7 12• 58 79 • 2010 132 107 134 250 102 73 6 6 2 7 6Swaziland 1995 660 –2000 1 823 –2005 2 187 2 187 100 22 20 6 2 5 452008 3 105 3 213 103 50 18 10 7 8 72009 3 498 3 498 100 51 19 10 7 7 7• 0 73 • 2010 3 011 3 011 100 51 22 11 9 6 2Togo 1995 887 856 97 42 18 9 3 17 112000 984 –2005 1 798 1 796 100 66 5 12 4 11 22008 2 234 2 229 100 76 3 11 3 3 32009 2 267 2 267 100 77 4 10 4 3 2• 60 84 • 2010 2 096 2 096 100 81 3 8 3 4 1Uganda 1995 13 631 15 301 112 26 18 7 1 13 362000 17 246 13 874 80 33 30 7 0 17 122005 20 559 20 559 100 32 41 6 0 16 52008 22 766 22 766 100 28 42 5 1 11 142009 23 113 23 113 100 30 38 5 1 12 16• 44 71 • 2010 23 456 23 456 100 35 36 5 1 11 13United Republic 1995 19 955 19 955 100 69 5 9 1 6 11of Tanzania 2000 24 049 23 923 99 72 6 10 0 6 52005 25 264 25 324 100 79 4 9 0 4 42008 24 171 24 171 100 84 5 5 0 2 42009 24 895 24 895 100 82 6 5 0 2 5• 73 90 • 2010 24 769 24 373 98 84 6 5 0 2 3Zambia 1995 10 038 5 957 59 47 23 7 2 14 82000 12 927 7 014 54 48 19 7 6 6 142005 14 857 14 857 100 76 8 8 1 2 52008 13 211 13 173 100 83 5 5 1 3 42009 12 995 12 995 100 85 6 6 1 3 0• 70 86 • 2010 12 639 48 616 385 25 61 6 0 4 4Zimbabwe 1995 8 965 9 702 108 32 21 10 0 10 262000 14 392 14 392 100 61 8 12 0 7 132005 13 155 12 860 98 59 9 12 2 7 122008 9 830 10 370 105 67 7 9 0 7 92009 10 195 10 195 100 70 9 8 1 7 6• 53 81 • 2010 11 654 11 654 100 72 10 8 1 5 5a TREATMENT SUCCESS = percent cured + percent completed then rounded to the nearest digit.160 Data can be downloaded from www.who.int/tb/data GLOBAL TUBERCULOSIS REPORT 2012
TREATMENT SUCCESS (%) a1995–2010YEARNUMBERNOTIFIEDSIZE OFCOHORTCOHORT AS% NOTIFIED% OF COHORTCURED COMPLETED DIED FAILED DEFAULTEDNOTEVALUATEDAlgeria 1995 451 –2000 547 512 94 61 16 5 4 5 102005 713 713 100 48 24 2 1 6 192008 651 620 95 72 11 4 2 6 62009 612 553 90 72 12 4 2 5 5• 0 83 • 2010 691 598 87 69 14 4 2 5 6Angola 1995 134 –2000 540 –2005 2 871 1 613 56 23 24 5 17 26 42008 3 584 3 584 100 39 18 4 4 18 182009 3 863 3 044 79 45 21 5 4 21 3• 0 64 • 2010 7 776 2 272 29 42 23 8 4 16 7Benin 1995 68 139 204 48 19 9 4 19 12000 280 282 101 61 21 5 1 11 02005 337 341 101 60 21 10 3 6 12008 236 230 97 65 12 13 7 3 02009 271 270 100 70 11 11 6 1 1• 67 85 • 2010 205 203 99 76 9 6 6 1 1Botswana 1995 147 –2000 1 239 395 32 21 54 8 1 11 62005 548 219 40 33 28 11 5 12 112008 1 095 1 067 97 15 30 11 3 11 302009 1 122 1 126 100 22 43 13 4 8 10• 0 66 • 2010 1 072 1 027 96 20 46 14 3 7 10Burkina Faso 1995 45 26 58 65 12 8 12 0 42000 178 166 93 57 4 13 5 15 72005 327 272 83 71 4 6 10 6 42008 500 427 85 72 5 10 9 4 12009 608 509 84 70 5 9 8 5 3• 77 76 • 2010 552 475 86 72 4 9 8 6 1Burundi 1995 181 265 146 25 21 6 2 28 182000 225 92 41 50 13 15 3 17 12005 116 –2008 205 205 100 67 9 7 1 10 52009 238 238 100 81 3 6 3 4 2• 46 82 • 2010 332 332 100 78 4 7 5 6 0Cameroon 1995 236 –2000 251 347 138 50 10 9 5 26 22005 1 590 1 611 101 49 7 6 3 16 192008 1 420 1 431 101 51 16 9 2 15 82009 1 569 1 516 97 51 18 9 2 13 7• 0 71 • 2010 1 494 1 489 100 55 16 9 3 12 6Cape Verde 1995 30 –2000 –2005 34 34 100 41 15 0 0 24 212008 31 31 100 32 16 6 3 29 132009 33 –• 0 0 • 2010 27 –Central African 1995 188 –Republic 2000 353 – 33 16 1 4 39 82005 291 291 100 53 30 9 0 8 12008 373 1 139 305 41 41 3 3 6 62009 629 629 100 19 12 5 2 8 53• 0 58 • 2010 421 284 67 35 24 7 4 25 6Chad 1995 203 92 45 29 18 5 2 40 42000 –2005 515 –2008 631 –2009 676 676 100 49 21 4 3 15 8• 48 73 • 2010 708 704 99 38 35 4 2 18 3Comoros 1995 7 7 100 43 0 29 0 29 02000 5 5 100 100 0 0 0 0 02005 3 5 167 100 0 0 0 0 02008 6 6 100 100 0 0 0 0 02009 6 –• 43 80 • 2010 5 – 80 0 0 20 0 0Congo 1995 78 –2000 819 187 23 49 13 3 3 28 42005 407 477 117 12 2 0 0 3 832008 473 524 111 49 22 3 4 21 02009 451 418 93 59 22 2 1 14 2• 0 57 • 2010 516 235 46 40 17 3 2 21 18Côte d'Ivoire 1995 649 –2000 893 507 57 45 10 8 9 21 72005 980 980 100 43 14 8 7 13 152008 1 429 1 429 100 55 12 7 12 9 42009 1 436 1 436 100 50 14 13 11 9 3• 0 65 • 2010 1 519 1 519 100 51 14 12 8 11 3Democratic 1995 2 891 1 202 42 56 16 8 2 12 6Republic 2000 2 637 –of the Congo 2005 6 065 5 448 90 71 4 10 4 6 52008 7 738 5 399 70 70 5 9 3 5 82009 8 666 7 193 83 54 23 8 2 4 8• 72 76 • 2010 8 604 5 583 65 72 5 7 3 6 8Equatorial 1995 1 6 600 83 0 0 17 0 0Guinea 2000 –2005 –2008 50 50 100 26 10 14 4 38 82009 44 44 100 36 14 14 2 16 18• 83 46 • 2010 67 41 61 32 15 22 0 27 5Eritrea 1995 –2000 67 –2005 124 –2008 145 145 100 66 2 7 7 1 172009 207 157 76 70 12 7 6 2 3• 0 88 • 2010 208 120 58 81 8 9 2 1 0Ethiopia 1995 343 193 56 71 8 3 5 8 52000 2 777 1 556 56 60 11 10 4 8 72005 3 119 3 116 100 41 15 9 2 5 282008 2 949 2 949 100 46 29 6 2 4 132009 3 544 2 942 83 47 21 5 2 3 23• 79 83 • 2010 4 898 3 934 80 56 27 4 3 5 6Gabon 1995 44 –2000 –2005 257 150 58 18 12 5 3 60 32008 296 158 53 10 21 18 2 11 392009 655 611 93 12 67 2 1 17 1• 0 65 • 2010 558 147 26 32 33 3 3 26 2AFRICAN REGIONa TREATMENT SUCCESS = percent cured + percent completed then rounded to the nearest digit.GLOBAL TUBERCULOSIS REPORT 2012 Data can be downloaded from www.who.int/tb/data 161
TREATMENT SUCCESS (%) a1995–2010YEARNUMBERNOTIFIEDSIZE OFCOHORTCOHORT AS% NOTIFIED% OF COHORTCURED COMPLETED DIED FAILED DEFAULTEDNOTEVALUATEDGambia 1995 6 45 750 69 0 11 2 11 72000 –2005 166 –2008 143 118 83 68 6 15 3 3 62009 107 100 93 67 5 17 2 7 2• 69 36 • 2010 81 81 100 30 6 6 1 0 57Ghana 1995 159 47 30 68 6 6 9 9 22000 502 –2005 532 540 102 40 8 6 3 11 322008 764 764 100 40 27 8 2 2 212009 860 717 83 50 26 10 2 3 10• 74 77 • 2010 1 021 1 021 100 38 39 12 2 2 7Guinea 1995 55 112 204 44 23 3 9 13 82000 446 299 67 63 8 5 3 8 132005 458 458 100 45 16 10 7 13 112008 671 414 62 60 11 7 4 10 82009 589 –• 67 68 • 2010 648 111 17 55 14 8 5 13 6Guinea-Bissau 1995 59 –2000 90 –2005 138 146 106 44 34 8 0 8 72008 82 92 112 53 13 9 0 13 122009 76 89 117 30 34 2 0 29 4• 0 54 • 2010 192 140 73 23 31 10 0 27 9Kenya 1995 1 064 879 83 61 11 9 1 10 82000 2 477 1 964 79 65 11 2 8 10 42005 8 975 3 794 42 68 9 10 1 7 52008 10 444 10 444 100 25 47 7 0 7 142009 10 711 4 859 45 70 8 8 4 7 4• 72 79 • 2010 10 479 4 333 41 73 6 6 3 8 4Lesotho 1995 147 –2000 1 481 –2005 1 041 597 57 71 11 2 2 142008 1 786 1 746 98 23 39 18 2 3 142009 1 970 1 931 98 20 42 17 2 4 15• 0 58 • 2010 1 985 2 091 105 16 42 16 2 8 16Liberia 1995 –2000 32 41 128 39 22 12 7 20 02005 57 57 100 75 9 2 9 52008 132 112 85 72 15 8 2 3 02009 123 123 100 70 15 8 4 2 0• 0 0 • 2010 170 –Madagascar 1995 596 –2000 –2005 1 498 1 825 122 65 7 7 2 12 62008 1 962 1 676 85 74 3 6 1 10 72009 2 089 2 073 99 62 11 7 2 8 10• 0 74 • 2010 2 109 1 800 85 71 3 8 2 9 8Malawi 1995 551 492 89 65 4 22 2 1 62000 764 797 104 61 5 23 1 6 32005 3 212 1 093 34 74 1 19 1 3 32008 2 533 779 31 80 4 10 1 1 42009 2 470 788 32 83 2 9 2 2 1• 69 77 • 2010 2 194 750 34 77 1 10 3 1 9Mali 1995 153 –2000 239 –2005 380 379 100 67 6 10 5 10 32008 411 407 99 69 5 12 7 5 22009 425 390 92 67 8 9 6 7 3• 0 99 • 2010 355 345 97 87 12 1 0 0 0Mauritania 1995 520 –2000 938 –2005 206 –2008 194 216 111 44 13 3 1 22 152009 182 182 100 48 13 3 1 20 14• 0 59 • 2010 153 153 100 46 13 5 2 15 20Mauritius 1995 2 –2000 12 2 17 0 0 50 50 0 02005 5 5 100 60 20 20 02008 4 4 100 50 0 25 0 25 02009 5 5 100 60 0 20 0 20 0• 0 86 • 2010 7 7 100 86 0 0 0 14 0Mozambique 1995 899 –2000 1 463 1 594 109 69 3 11 4 11 22005 1 886 1 855 98 69 1 15 2 10 32008 1 782 1 782 100 63 2 10 6 5 142009 3 630 –• 0 0 • 2010 4 048 –Namibia 1995 88 –2000 1 534 604 39 41 14 8 6 13 172005 1 823 2 009 110 24 29 11 3 13 222008 1 439 1 439 100 58 15 9 10 5 22009 2 558 1 546 60 58 15 9 9 6 3• 0 78 • 2010 2 522 2 548 101 63 15 6 10 5 2Niger 1995 –2000 255 –2005 754 –2008 617 616 100 67 12 8 5 6 32009 690 667 97 64 12 9 4 5 6• 0 75 • 2010 667 661 99 64 11 10 3 5 7Nigeria 1995 303 –2000 2 356 1 848 78 58 13 7 7 11 42005 4 867 3 662 75 48 18 2 11 20 12008 7 048 5 488 78 61 15 3 7 8 62009 8 151 8 151 100 48 33 6 2 7 4• 0 82 • 2010 8 993 8 993 100 43 39 4 4 7 3Rwanda 1995 200 –2000 374 296 79 49 5 14 1 5 252005 831 506 61 56 9 15 3 4 132008 397 397 100 64 9 7 7 5 82009 475 448 94 62 10 11 7 4 6• 0 74 • 2010 631 446 71 65 9 9 6 4 6Sao Tome and 1995 –Principe 2000 4 –2005 27 0 02008 6 3 50 67 0 0 33 0 02009 3 3 100 33 33 0 33 0 0• 0 50 • 2010 2 12 600 0 50 8 17 8 17a TREATMENT SUCCESS = percent cured + percent completed then rounded to the nearest digit.162 Data can be downloaded from www.who.int/tb/data GLOBAL TUBERCULOSIS REPORT 2012
TREATMENT SUCCESS (%) a1995–2010YEARNUMBERNOTIFIEDSIZE OFCOHORTCOHORT AS% NOTIFIED% OF COHORTCURED COMPLETED DIED FAILED DEFAULTEDNOTEVALUATEDSenegal 1995 563 634 113 45 11 5 10 25 42000 1 056 931 88 40 8 4 3 23 232005 920 920 100 58 5 8 5 13 112008 1 144 972 85 70 5 7 4 10 52009 1 112 889 80 67 4 7 5 10 8• 56 60 • 2010 1 029 1 029 100 56 4 6 3 7 24Seychelles 1995 0 –2000 0 –2005 2 –2008 0 0 –2009 0 0 –• 0 0 • 2010 0 0 –Sierra Leone 1995 41 69 168 72 14 3 4 4 12000 441 –2005 330 328 99 68 7 6 3 15 12008 389 153 39 78 7 5 1 6 32009 467 466 100 56 13 10 3 15 4• 87 75 • 2010 547 543 99 65 11 5 2 15 2South Africa 1995 179 –2000 56 202 24 847 44 43 8 8 3 19 192005 60 588 64 923 107 29 29 11 2 16 132008 64 470 38 754 60 53 11 11 3 13 92009 65 916 34 122 52 53 8 10 3 12 15• 0 35 • 2010 60 580 60 580 100 31 4 5 2 7 52Swaziland 1995 489 –2000 1 249 –2005 470 1 113 237 7 21 11 3 5 542008 1 319 1 418 108 14 34 15 11 9 172009 1 474 1 474 100 14 41 17 9 10 8• 0 50 • 2010 1 440 446 31 32 18 17 21 7 6Togo 1995 93 93 100 16 17 5 4 19 382000 133 –2005 179 128 72 73 2 14 4 7 02008 196 194 99 73 2 14 4 7 02009 214 237 111 68 3 18 3 4 5• 33 82 • 2010 240 240 100 78 4 6 4 8 1Uganda 1995 955 –2000 1 505 1 209 80 34 30 13 0 13 102005 2 430 –2008 3 177 2 491 78 31 48 8 1 12 02009 4 014 2 856 71 31 39 7 1 15 7• 0 65 • 2010 3 952 2 764 70 31 34 8 1 12 13United Republic 1995 1 335 1 455 109 66 10 11 1 8 4of Tanzania 2000 1 772 3 356 189 49 24 14 1 6 62005 5 032 5 067 101 37 39 13 1 4 62008 4 474 4 474 100 34 47 10 1 3 42009 4 217 4 217 100 34 49 8 1 3 5• 76 84 • 2010 3 785 3 714 98 37 47 9 1 3 4Zambia 1995 243 –2000 1 455 894 61 52 15 11 4 5 122005 5 496 5 496 100 24 60 9 1 3 42008 5 236 2 958 56 0 80 9 0 4 62009 2 485 5 444 219 33 53 9 1 4 0• 0 0 • 2010 6 310 –Zimbabwe 1995 737 –2000 1 063 – 51 14 17 1 8 92005 5 941 4 667 79 13 46 16 0 13 112008 3 631 1 109 31 63 10 12 1 7 72009 4 685 1 203 26 72 8 11 0 5 4• 0 74 • 2010 4 685 1 629 35 63 11 13 3 5 5AFRICAN REGIONa TREATMENT SUCCESS = percent cured + percent completed then rounded to the nearest digit.GLOBAL TUBERCULOSIS REPORT 2012 Data can be downloaded from www.who.int/tb/data 163
–% OF TB PATIENTS WITHKNOWN HIV STATUS2005–2011YEAR% OF TBPATIENTS WITHKNOWN HIVSTATUSNUMBER OF TBPATIENTS WITHKNOWN HIVSTATUSPATIENTSNOTIFIED(NEW ANDRETREAT)NUMBER OFHIV-POSITIVETB PATIENTS% OF TESTEDTB PATIENTSHIV-POSITIVE% OF HIV-POSITIVE TBPATIENTS ONCPT% OF HIV-POSITIVE TBPATIENTS ONARTNUMBER OFHIV-POSITIVEPEOPLEPROVIDED IPTAlgeria 2005 21 5012009 21 8232010 22 530– – 2011 21 597Angola 2005 38 3172009 5 2 023 42 686 306 15 14 92010 5 2 434 49 987 1 620 67 43 43– 10 • 2011 10 5 107 48 926 987 19 80 80Benin 2005 15 503 3 457 57 112009 96 3 845 3 987 633 16 98 442010 98 3 774 3 841 592 16 97 57• 15 99 • 2011 99 4 259 4 320 721 17 339Botswana 2005 23 2 291 10 104 1 829 80 18 7622009 75 6 795 9 088 4 415 65 31 36 11 7322010 81 6 147 7 632 4 018 65 79 43 738• 23 80 • 2011 80 5 369 6 733 3 441 64 82 45Burkina Faso 2005 33 1 213 3 645 559 46 68 322009 90 4 602 5 111 903 20 97 532010 93 4 761 5 135 839 18 98 60• 33 82 • 2011 82 4 572 5 543 765 17 94Burundi 2005 6 627 02009 50 3 625 7 323 1 305 36 47 32 6172010 71 5 511 7 719 1 260 23 95 40– 71 • 2011 71 4 817 6 828 1 036 22 95 48 0Cameroon 2005 0 0 22 073 0 02009 72 18 218 25 174 7 383 41 86 50 6742010 78 19 117 24 552 8 314 43 81 51• 0 81 • 2011 81 20 280 25 126 7 731 38 1 373Cape Verde 2005 98 298 305 14 5 1002009 80 282 352 57 20 02010 365• 98 90 • 2011 90 352 390 47 13Central African 2005 3 338Republic 2009 42 3 749 8 996 1 230 33 66 35 02010 39 2 638 6 760 862 33 0 62– 33 • 2011 33 1 890 5 724 733 39 12 9Chad 2005 6 5052009 8 6512010 39 3 801 9 697 663 17 53 45– 38 • 2011 38 4 124 10 774 959 23Comoros 2005 100 112 112 2 2 100 1002009 91 117 129 0 0 02010 119 0 0 0• 100 82 • 2011 82 98 119 4 4 25 25Congo 2005 9 9612009 24 2 357 9 935 99 4 2 22010 40 4 106 10 321 757 18 3 3– 20 • 2011 20 2 247 11 143 687 31 24 26Côte d'Ivoire 2005 20 4 079 20 026 1 551 38 38 142009 75 17 253 23 009 5 207 30 71 31 02010 73 16 991 23 210 4 112 24 80 27• 20 80 • 2011 80 18 297 22 920 4 820 26 80 36Democratic 2005 2 1 885 99 558 386 20 74 1Republic 2009 27 31 312 116 025 6 126 20 45 21 0of the Congo 2010 24 28 997 118 636 5 273 18 24 9• 2 27 • 2011 27 30 636 114 290 4 942 16 54 23Equatorial 2005Guinea 2009 46 331 720 121 37 14 552010 92 786 853 225 29 85 31– 100 • 2011 100 911 913 234 26 21Eritrea 2005 3 6122009 3 0222010 2 991– – 2011 3 093 0Ethiopia 2005 3 3 211 125 135 1 321 41 88 29 1 9832009 37 56 040 150 221 11 098 20 68 41 2 4032010 43 66 955 156 928 9 809 15 69 39 6 636• 3 41 • 2011 41 65 140 159 017 5 442 8 62 39 30 816Gabon 2005 7 185 2 611 185 100 100 02009 32 1 130 3 559 667 59 52 522010 27 1 130 4 180 667 59 52 52• 7 46 • 2011 46 2 252 4 916 578 26Gambia 2005 2 1202009 94 2 045 2 186 326 16 112010 93 1 962 2 111 224 11 93 46– 72 • 2011 72 1 726 2 386Ghana 2005 7 844 12 124 340 40 100 372009 65 9 870 15 286 2 218 22 72 24 02010 67 10 147 15 145 2 676 26 77 18• 7 79 • 2011 79 12 587 15 840 2 919 23 71 28Guinea 2005 7 0902009 63 5 444 8 614 1 288 24 40 72010 51 5 776 11 324 1 483 26 87 41– 56 • 2011 56 6 548 11 606 1 670 26 72 63Guinea-Bissau 2005 11 200 1 816 110 55 100 30 02009 30 664 2 188 268 402010 46 1 046 2 259 396 38• 11 51 • 2011 51 1 053 2 070 439 42Kenya 2005 14 15 658 108 401 8 954 57 44 172009 88 96 676 110 065 42 294 44 92 342010 91 96 930 106 083 40 069 41 100 48• 14 93 • 2011 93 97 136 103 981 38 172 39 97 64Lesotho 2005 1 156 11 404 127 81 792009 78 10 563 13 515 8 084 77 94 282010 84 11 005 13 138 8 459 77 96 27• 1 82 • 2011 82 10 380 12 628 7 909 76 90 40Liberia 2005 3 114 3 456 14 12 02009 100 5 964 5 964 72 1 42 49 02010 53 3 533 6 668 283 8 8 0• 3 55 • 2011 55 4 355 7 965 454 10 55 100Madagascar 2005 9 1 759 19 475 16 12009 9 2 176 23 447 7 0 712010 65 16 439 25 106 39 0 36• 9 58 • 2011 58 15 532 26 722 40 0164 Data can be downloaded from www.who.int/tb/data GLOBAL TUBERCULOSIS REPORT 2012
–% OF TB PATIENTS WITHKNOWN HIV STATUS2005–2011YEAR% OF TBPATIENTS WITHKNOWN HIVSTATUSNUMBER OF TBPATIENTS WITHKNOWN HIVSTATUSPATIENTSNOTIFIED(NEW ANDRETREAT)NUMBER OFHIV-POSITIVETB PATIENTS% OF TESTEDTB PATIENTSHIV-POSITIVE% OF HIV-POSITIVE TBPATIENTS ONCPT% OF HIV-POSITIVE TBPATIENTS ONARTNUMBER OFHIV-POSITIVEPEOPLEPROVIDED IPTMalawi 2005 44 12 243 27 610 8 447 69 92 492009 86 21 041 24 356 13 558 64 94 45 02010 88 19 855 22 536 12 476 63 94 46• 44 83 • 2011 83 17 339 20 854 10 341 60 89 60Mali 2005 4 8842009 55 3 760 6 835 585 16 100 10 02010 42 2 303 5 448 416 18 75 52 0– 35 • 2011 35 1 963 5 573 440 22 66 63Mauritania 2005 0 10 2 218 0 02009 11 281 2 664 27 102010 24 608 2 489 90 15 61 0• 0 1 • 2011 1 12 1 820 12 100 100Mauritius 2005 91 115 127 2 2 100 502009 95 110 116 7 6 100 71 02010 95 117 123 8 7 100 75• 91 93 • 2011 93 108 116 8 7 100 62Mozambique 2005 33 7182009 84 38 087 45 529 25 056 66 89 22 2 4292010 88 40 554 46 174 24 574 61 97 25 13 164– 88 • 2011 88 41 896 47 452 26 538 63 91 29 17 064Namibia 2005 16 2 547 15 894 1 465 582009 74 9 849 13 332 5 676 58 78 35 17 7372010 76 9 534 12 625 5 227 55 93 44 13 989• 16 84 • 2011 84 10 042 11 938 4 990 50 98 54 14 428Niger 2005 8 224 152 43 342009 24 2 424 10 228 403 17 24 02010 48 4 925 10 345 405 8 37 0– 44 • 2011 44 4 710 10 714 334 7Nigeria 2005 10 6 897 66 848 1 241 182009 75 70 693 94 114 18 087 26 48 39 1 8532010 79 71 844 90 447 17 736 25 59 33 1 750• 10 81 • 2011 81 75 772 93 050 19 553 26 68 43 1 107Rwanda 2005 65 5 003 7 680 2 276 45 15 132009 97 7 448 7 644 2 529 34 92 63 02010 98 6 914 7 065 2 199 32 97 72• 65 97 • 2011 97 6 560 6 784 1 855 28 97 80Sao Tome and 2005 100 152 152 5 3 0 0Principe 2009 100 79 79 10 13 100 30 22010 92 112 122 13 12 92 54 0• 100 100 • 2011 100 146 146 14 10 100 100 0Senegal 2005 10 1202009 59 6 906 11 732 455 7 85 27 02010 69 8 018 11 591 776 10 85 37– 76 • 2011 76 8 757 11 588 877 10 85 48Seychelles 2005 14 2 100 1002009 100 15 15 3 20 100 100 02010 100 17 17 1 6 100 100 0– 100 • 2011 100 21 21 4 19 100 100Sierra Leone 2005 6 9302009 73 8 625 11 826 987 11 7 132010 74 9 718 13 195 976 10 6 19– 78 • 2011 78 10 159 12 943 902 9 25 28South Africa 2005 22 67 988 302 467 35 299 52 100 33 1 4662009 49 197 448 405 982 114 523 58 71 42 23 5832010 54 213 006 396 554 128 457 60 74 54 146 247• 22 83 • 2011 83 323 440 389 974 211 800 65 76 44 372 994Swaziland 2005 8 8642009 97 10 730 11 032 8 889 83 94 26 2 1072010 86 9 536 11 146 7 788 82 93 35– 92 • 2011 92 8 419 9 180 6 480 77 95 51Togo 2005 0 0 2 635 0 02009 56 1 734 3 093 342 20 74 36 02010 77 2 242 2 897 632 28 72 49• 0 84 • 2011 84 2 513 2 980 667 27 37 30Uganda 2005 25 10 555 41 809 7 523 71 25 102009 71 31 695 44 335 17 131 54 86 222010 81 36 742 45 546 19 836 54 90 24• 25 80 • 2011 80 39 394 49 018 20 725 53 93 32United Republic 2005 3 1 613 64 200 841 52 61 22of Tanzania 2009 88 56 388 64 267 21 541 38 89 31 1532010 90 56 849 63 453 21 662 38 92 35• 3 88 • 2011 88 53 531 61 148 20 525 38 95 38Zambia 2005 2 1 082 53 267 614 57 682009 77 34 992 45 551 23 584 67 64 422010 84 40 704 48 616 26 571 65 75 48• 2 86 • 2011 86 41 701 48 594 26 737 64 87 53Zimbabwe 2005 0 0 54 891 02009 62 28 952 46 453 22 745 79 92 382010 86 41 062 47 557 31 849 78 88 45• 0 86 • 2011 86 35 361 41 305 21 125 60 29 67 0AFRICAN REGIONGLOBAL TUBERCULOSIS REPORT 2012 Data can be downloaded from www.who.int/tb/data 165
YEARTOTALCONFIRMEDCASES OFMDR-TB aESTIMATED CASESOF MDR-TB AMONGNOTIFIEDESTIMATED CASESOF MDR-TB AMONGNOTIFIEDNEW PULMONARY CASESNUMBER OFBACT+VE bTESTED FORMDR-TB% OFBACT+VE bTESTED FORMDR-TBESTIMATED CASESOF MDR-TB AMONGNOTIFIEDPREVIOUSLY TREATED CASESNUMBER OF% OF NOTIFIEDNOTIFIEDTESTED FORTESTED FORMDR-TBMDR-TBAlgeria 2005 74 809 9.1 164 232009 – –2010 56 – –2011 190 (71–310) 130 (58–260) – 55 (6.8–180) –Angola 2005 – –2009 – –2010 3 – –2011 40 1 600 (800–2 400) 720 (200–1 200) 29 0.13 850 (290–1 400) –Benin 2005 28 31 1.1 107 322009 14 – 94 352010 15 103 3.5 6 2.92011 20 53 (24–81) 18 (2.2–73) 0 0 34 (22–51) 152 58Botswana 2005 – –2009 101 268 6.5 251 222010 106 488 11 286 272011 46 170 (110–230) 120 (70–160) 151 4.5 57 (21–93) 90 10Burkina Faso 2005 3 – 126 392009 19 3
YEARTOTALCONFIRMEDCASES OFMDR-TB aESTIMATED CASESOF MDR-TB AMONGNOTIFIEDESTIMATED CASESOF MDR-TB AMONGNOTIFIEDNEW PULMONARY CASESNUMBER OFBACT+VE bTESTED FORMDR-TB% OFBACT+VE bTESTED FORMDR-TBESTIMATED CASESOF MDR-TB AMONGNOTIFIEDPREVIOUSLY TREATED CASESNUMBER OFNOTIFIEDTESTED FORMDR-TB% OF NOTIFIEDTESTED FORMDR-TBMalawi 2005 9 – 917 292009 6 0 0 34 1.42010 40 871 10 449 202011 26 160 (99–220) 57 (19–130) 102 1.5 100 (70–150) 552 26Mali 2005 2 0 0 0 02009 22 14 0.27 14 3.32010 12 0 0 12 3.42011 10 140 (68–210) 77 (21–130) – 62 (21–100) –Mauritania 2005 11 161 12 30 152009 – –2010 35 – –2011 8 42 (21–63) 22 (6.2–38) 3 0.30 20 (6.8–33) 4 3.9Mauritius 2005 0 114 100 3 602009 1 98 100 5 1002010 2 105 100 7 1002011 1 1.0 (0–3.0) 1.0 (
MALEFEMALEYEAR 0–14 15–24 25–34 35–44 45–54 55–64 65+0–14 15–24 25–34 35–44 45–54 55–64 65+UN-KNOWNUN-KNOWNMALE:FEMALERATIOAlgeria 1995 –2000 59 927 1 516 610 491 234 299 36 1 005 1 293 746 314 208 312 1.12005 53 1 309 1 841 919 473 314 426 102 1 044 820 389 270 229 465 1.62010 52 1 203 1 669 825 513 392 397 79 1 086 826 417 251 222 367 1.62011 42 1 147 1 513 881 483 345 347 58 1 050 787 383 211 202 341 1.6Angola 1995 386 724 562 346 224 155 14 371 707 443 264 248 130 18 1.12000 186 999 1 003 912 482 312 194 247 1 142 1 091 844 417 200 120 1.02005 520 2 549 2 797 1 918 1 255 665 461 704 2 926 2 682 1 797 1 138 581 417 0.992010 448 2 900 3 584 2 415 1 424 691 355 558 2 763 2 594 1 688 958 482 286 1.32011 501 3 000 3 792 2 386 1 395 680 455 0 708 2 731 2 563 1 683 1 006 457 346 0 1.3Benin 1995 14 186 352 306 176 101 92 26 148 197 118 69 32 22 2.02000 19 277 428 327 213 103 74 36 239 275 149 76 45 25 1.72005 21 306 595 396 270 135 87 25 249 331 145 89 51 39 1.92010 18 314 631 443 267 164 85 0 29 265 382 200 98 42 35 0 1.82011 21 320 650 497 353 210 107 0 41 288 385 246 119 42 52 0 1.8Botswana 1995 –2000 25 185 605 488 267 135 96 37 335 469 262 98 57 36 1.42005 27 260 563 506 272 135 97 45 321 491 253 97 55 48 1.42010 45 256 590 477 239 137 107 0 68 338 509 301 119 56 53 0 1.32011 36 220 464 354 206 110 94 0 65 286 421 211 105 48 49 0 1.3Burkina Faso 1995 4 67 133 124 62 48 29 7 76 53 39 26 11 10 2.12000 12 91 274 252 133 68 65 7 59 128 101 45 38 14 2.32005 18 181 430 370 273 144 113 15 125 248 174 109 54 40 2.02010 20 231 620 493 328 224 173 0 33 158 259 198 124 97 83 0 2.22011 22 265 708 582 375 262 196 0 31 163 277 221 146 110 92 0 2.3Burundi 1995 5 128 238 224 73 32 19 19 109 124 89 33 12 4 1.82000 –2005 34 352 591 525 372 111 55 46 298 399 288 122 36 33 1.72010 56 481 773 651 570 270 157 0 78 390 421 332 225 99 87 0 1.82011 37 484 743 620 504 235 98 0 56 345 374 263 180 81 40 0 2.0Cameroon 1995 20 208 569 323 287 204 164 9 185 313 223 153 106 93 1.62000 41 518 842 584 284 130 75 63 368 530 293 139 60 33 1.72005 134 1 472 2 482 1 766 1 035 463 289 226 1 467 1 788 1 028 503 205 143 1.42010 106 1 497 2 750 1 996 1 314 559 329 172 1 474 2 031 1 121 642 290 183 1.42011 114 1 580 2 931 2 139 1 283 625 361 178 1 461 2 022 1 177 581 281 194 1.5Cape Verde 1995 –2000 –2005 0 22 23 26 9 2 8 2 9 16 4 5 3 6 2.02010 –2011 0 17 43 35 31 3 3 0 4 14 15 4 6 3 4 0 2.6Central African 1995 38 162 356 206 120 40 18 39 233 350 145 57 21 9 1.1Republic 2000 –2005 29 40 1 136 160 26 35 15 30 32 420 145 30 40 15 2.02010 78 379 633 468 251 135 63 1 88 367 576 319 155 73 44 8 1.22011 70 362 576 467 269 119 59 4 96 382 530 289 162 62 26 6 1.2Chad 1995 –2000 –2005 25 194 535 409 229 123 82 28 148 298 211 148 59 27 1.72010 76 382 850 666 379 173 99 0 59 274 413 263 158 79 44 0 2.02011 92 469 951 764 418 184 121 0 84 296 438 298 166 109 44 0 2.1Comoros 1995 0 18 13 9 7 8 4 1 13 9 8 6 5 2 1.32000 0 18 7 14 9 3 4 1 9 6 12 1 2 1 1.72005 0 12 9 6 4 2 4 2 10 7 4 8 3 8 0.882010 –2011 0 10 13 9 5 2 5 0 2 8 4 2 1 0 1 0 2.4Congo 1995 16 265 409 221 73 44 15 17 296 353 167 61 38 11 1.12000 –2005 –2010 41 435 672 424 203 77 55 49 409 510 296 152 70 56 1.22011 58 453 705 462 222 80 76 0 72 408 463 332 200 88 97 0 1.2Côte d'Ivoire 1995 41 989 2 092 1 344 759 283 130 99 810 813 497 273 105 19 2.22000 –2005 128 1 346 2 449 1 606 888 422 385 193 1 280 1 756 989 528 232 201 1.42010 159 1 751 2 858 1 882 1 010 505 375 246 1 431 1 819 1 051 531 304 209 1.52011 189 1 743 3 043 1 852 1 072 601 348 0 244 1 358 1 838 1 044 560 301 223 0 1.6Democratic 1995 373 1 572 2 382 1 890 1 184 634 289 331 1 223 1 532 1 232 863 427 137 1.4Republic 2000 485 4 048 5 833 4 151 2 549 1 295 602 718 4 422 5 146 3 309 1 724 855 351 1.1of the Congo 2005 1 321 6 675 9 808 7 577 5 022 2 637 1 499 1 695 7 570 8 501 5 832 3 898 2 054 951 1.12010 1 707 6 859 10 412 9 134 6 464 3 641 1 907 1 987 7 199 9 120 6 721 4 579 2 612 1 311 1.22011 1 579 6 640 9 872 8 932 6 415 3 584 1 911 1 800 6 802 8 742 6 541 4 537 2 671 1 295 1.2Equatorial 1995 8 15 45 37 15 11 7 2 18 28 20 4 7 1 1.7Guinea 2000 –2005 –2010 10 71 80 59 35 16 10 0 13 80 57 45 26 9 6 0 1.22011 11 77 90 89 59 22 12 0 15 76 81 46 21 9 3 0 1.4Eritrea 1995 –2000 9 70 75 57 32 25 20 10 100 87 71 21 12 8 0.932005 9 68 73 50 45 51 39 8 67 127 72 39 21 18 0.952010 10 93 109 81 51 37 60 0 3 88 111 79 43 31 36 0 1.12011 0 –Ethiopia 1995 247 1 221 1 017 541 276 142 51 283 908 781 382 152 64 15 1.42000 915 5 095 5 187 3 082 1 495 610 397 1 037 4 699 4 424 2 105 976 366 122 1.22005 1 109 6 726 6 181 3 454 1 985 1 027 475 1 326 5 885 5 663 2 730 1 296 513 155 1.22010 1 582 7 400 7 785 4 451 2 746 1 473 822 1 608 5 708 6 480 3 439 1 950 855 335 1.32011 1 847 7 835 9 246 3 881 2 771 1 218 771 1 983 6 570 7 917 3 069 1 564 719 303 1.2Gabon 1995 3 45 74 80 54 30 15 9 47 54 28 25 19 3 1.62000 –2005 13 123 199 140 70 38 25 19 128 123 88 29 29 18 1.42010 15 145 223 208 130 89 91 0 13 110 164 122 100 86 64 0 1.42011 34 240 269 229 144 86 66 0 25 177 188 125 74 44 39 0 1.6Gambia 1995 3 68 181 88 72 29 24 4 39 61 44 25 12 8 2.42000 –2005 13 133 292 206 62 53 44 2 84 87 64 38 22 27 2.52010 9 194 314 184 141 68 39 0 6 104 121 71 35 40 18 0 2.42011 14 183 271 181 136 87 56 0 16 103 112 88 63 32 33 0 2.1Ghana 1995 42 223 397 398 302 190 112 40 199 272 205 122 88 48 1.72000 73 550 1 266 1 115 811 495 426 74 456 791 566 338 179 176 1.82005 49 592 1 201 1 311 944 462 414 68 450 693 527 366 207 221 2.02010 63 570 1 146 1 301 1 030 540 447 64 446 667 560 369 204 249 2.02011 50 550 1 127 1 328 955 491 456 52 470 699 614 390 174 260 1.9Guinea 1995 18 244 538 357 189 98 61 28 202 255 153 64 37 19 2.02000 39 551 860 570 282 203 103 66 314 446 245 114 82 45 2.02005 51 749 1 165 778 463 195 130 65 594 583 354 203 94 55 1.82010 61 679 877 982 876 565 289 51 549 739 751 405 145 72 1.62011 45 1 051 1 537 955 541 293 197 85 709 688 432 219 109 73 2.0Guinea-Bissau 1995 –2000 2 52 92 80 64 39 19 4 30 46 47 24 15 12 2.02005 14 116 167 153 130 72 42 13 78 110 92 82 44 19 1.62010 18 164 219 183 141 80 43 0 30 100 161 133 80 38 19 0 1.52011 6 140 230 181 104 65 36 0 12 119 122 90 56 44 25 0 1.6Kenya 1995 154 2 072 3 073 1 675 920 485 296 187 1 802 1 759 741 411 242 117 1.62000 264 3 739 6 653 3 548 1 630 630 414 416 3 916 4 363 1 874 831 347 148 1.42005 359 4 790 8 832 5 069 2 521 1 031 590 577 5 144 6 521 2 781 1 266 593 315 1.32010 357 4 698 7 945 5 077 2 509 994 658 549 4 044 5 112 2 372 1 056 544 345 1.62011 356 4 773 8 376 5 201 2 660 1 045 665 0 629 4 183 4 917 2 434 1 025 477 344 0 1.6168 Data can be downloaded from www.who.int/tb/data GLOBAL TUBERCULOSIS REPORT 2012
MALEYEAR 0–14 15–24 25–34 35–44 45–54 55–64 65+FEMALE0–14 15–24 25–34 35–44 45–54 55–64 65+UN-KNOWNUN-KNOWNMALE:FEMALERATIOLesotho 1995 9 108 214 256 189 96 88 14 106 125 71 49 17 19 2.42000 8 165 458 517 395 198 76 11 222 336 195 83 36 29 2.02005 32 395 695 397 148 82 37 19 226 721 616 494 297 121 0.722010 16 222 607 497 364 244 133 27 283 597 329 169 64 48 1.42011 19 179 584 493 329 245 121 23 311 572 307 185 84 58 1.3Liberia 1995 –2000 12 133 196 127 52 17 26 21 140 149 88 28 16 16 1.22005 26 240 352 333 155 74 65 37 232 297 171 108 52 25 1.42010 90 338 621 510 295 114 21 0 254 339 488 259 171 151 99 0 1.12011 67 382 595 727 440 194 87 0 67 329 433 517 285 88 50 0 1.4Madagascar 1995 79 791 1 289 1 173 630 423 242 100 799 1 108 744 340 230 78 1.42000 –2005 98 1 159 1 867 1 732 1 349 582 333 150 1 012 1 451 1 047 614 248 129 1.52010 204 1 721 1 621 2 525 1 782 960 485 0 323 1 621 1 943 1 376 946 397 192 0 1.42011 146 1 807 2 764 2 495 1 938 1 044 522 0 252 1 726 2 031 1 503 978 462 188 0 1.5Malawi 1995 25 493 1 195 833 519 215 89 65 802 1 028 573 294 108 45 1.22000 50 653 1 476 1 113 585 245 114 66 1 038 1 481 831 401 148 64 1.12005 58 622 1 653 1 031 549 279 157 84 913 1 598 859 386 180 74 1.12010 50 565 1 509 985 485 275 187 0 103 610 1 196 661 314 198 102 0 1.32011 70 519 1 486 1 050 440 238 201 79 601 1 119 660 283 161 96 1.3Mali 1995 27 72 357 294 181 138 102 31 132 184 128 107 61 52 1.72000 23 206 430 396 297 235 144 14 174 232 152 106 75 43 2.22005 26 350 628 539 365 263 193 33 208 348 245 152 101 72 2.02010 94 381 707 526 354 227 207 31 265 337 247 144 96 70 2.12011 25 370 772 515 352 267 230 42 255 393 223 147 118 68 2.0Mauritania 1995 –2000 –2005 –2010 17 192 295 206 137 99 76 14 90 104 82 52 29 29 2.62011 36 165 185 131 106 58 55 28 68 72 47 36 19 20 2.5Mauritius 1995 2 17 13 22 27 13 8 2 4 12 10 8 4 4 2.32000 2 6 9 18 19 14 8 1 5 8 8 6 7 4 1.92005 10 15 21 20 10 6 4 5 5 11 2 1 2.92010 0 9 9 13 23 15 7 0 0 7 9 4 4 3 2 0 2.62011 0 10 13 9 17 10 8 0 0 7 12 2 3 6 3 0 2.0Mozambique 1995 187 1 136 1 475 1 338 1 022 664 320 226 994 1 314 1 016 551 234 89 1.42000 –2005 –2010 –2011 –Namibia 1995 0 68 235 113 55 21 6 5 49 78 50 16 1 0 2.52000 18 269 874 665 300 147 81 16 352 654 348 161 76 52 1.42005 98 355 1 027 874 365 146 120 105 399 809 525 213 95 91 1.32010 36 359 852 680 287 146 126 67 429 685 382 206 122 87 1.32011 48 337 844 660 361 152 138 78 427 653 410 185 100 110 1.3Niger 1995 –2000 29 270 174 441 252 151 78 31 123 206 168 151 63 9 1.92005 35 557 1 204 819 497 350 198 34 214 388 330 223 131 70 2.62010 44 669 1 587 988 615 415 342 39 272 418 347 238 174 135 2.92011 50 709 1 673 1 025 646 436 347 0 50 285 449 323 278 189 147 0 2.8Nigeria 1995 450 845 921 937 557 611 515 404 842 795 770 724 654 451 1.02000 157 2 173 3 164 1 836 1 091 566 463 239 2 934 2 434 1 110 676 344 231 1.22005 325 3 824 6 758 4 544 2 863 1 464 950 482 3 996 4 884 2 448 1 350 745 415 1.42010 521 4 457 9 186 6 218 3 804 1 974 1 363 0 595 4 182 6 117 3 431 1 846 1 040 682 0 1.52011 529 4 549 9 520 6 550 4 230 2 248 1 443 0 578 4 198 6 168 3 574 2 014 1 112 724 0 1.6Rwanda 1995 –2000 155 466 974 824 393 129 56 105 396 473 309 109 52 14 2.12005 45 494 713 592 408 142 71 73 483 442 262 157 60 29 1.62010 48 430 741 526 325 202 126 48 399 448 261 128 65 38 1.72011 42 423 795 500 376 210 124 0 50 358 398 235 146 87 67 0 1.8Sao Tome and 1995 –Principe 2000 1 5 11 4 7 3 10 3 7 15 5 7 4 15 0.732005 2 5 7 6 4 5 2 1 4 5 3 2 3 0 1.72010 0 10 14 7 1 0 1 0 0 5 4 3 2 0 0 0 2.42011 0 5 9 8 7 1 4 0 2 2 10 4 1 0 0 0 1.8Senegal 1995 94 717 1 219 813 408 300 213 84 428 461 283 203 126 72 2.32000 60 772 1 297 857 470 279 189 77 521 540 376 217 107 61 2.12005 71 1 050 1 561 904 533 274 236 83 709 568 351 185 116 81 2.22010 81 1 351 1 793 972 590 329 221 0 81 835 643 332 217 136 105 0 2.32011 75 1 264 1 835 981 582 335 214 89 88 807 664 362 208 144 74 43 2.2Seychelles 1995 0 2 0 1 1 2 1 0 0 1 0 0 0 1 3.52000 2 4 1 1 1 0 1 1 2.72005 0 2 1 2 1 0 0 0 0 1 1 0 0 0 3.02010 0 0 0 6 0 0 1 0 0 2 0 0 0 0 0 0 3.52011 0 0 1 0 0 0 0 0 0 1 0 0 0 0 0 0 1.0Sierra Leone 1995 10 184 305 201 99 47 22 18 165 193 110 65 24 11 1.52000 18 287 486 361 190 113 47 27 249 298 225 92 49 30 1.52005 45 490 792 651 397 226 124 54 393 518 312 207 114 47 1.72010 64 718 1 176 1 076 663 320 254 77 648 742 556 293 180 131 1.62011 75 825 1 224 1 099 781 334 287 0 115 678 796 543 343 219 116 0 1.6South Africa 1995 –2000 116 723 1 999 2 135 1 146 435 212 122 1 283 1 716 933 423 167 80 1.42005 2 035 10 422 20 576 19 465 11 143 4 124 1 705 2 561 13 632 19 343 11 338 5 416 2 352 1 348 1.22010 1 496 9 925 20 855 19 842 12 386 5 155 2 211 0 1 933 13 023 20 205 12 910 6 873 3 165 2 128 0 1.22011 1 472 9 772 20 487 19 360 12 111 5 220 2 164 0 1 932 12 751 19 250 12 807 6 955 3 266 2 223 0 1.2Swaziland 1995 4 59 117 130 98 40 16 5 52 57 39 29 8 6 2.42000 11 130 352 249 138 37 17 10 198 298 62 62 24 5 1.42005 9 162 406 285 139 57 27 14 318 453 207 73 21 8 0.992010 30 207 537 369 192 109 50 0 51 354 662 276 104 54 16 0 0.982011 16 161 459 318 158 69 46 35 281 495 220 86 40 24 1.0Togo 1995 7 95 151 123 82 64 49 9 80 96 45 38 23 15 1.92000 4 101 168 144 109 48 39 13 107 124 50 36 24 15 1.72005 11 177 320 283 125 79 69 23 157 236 146 67 41 32 1.52010 21 150 350 358 217 116 80 39 163 285 148 78 62 29 1.62011 15 169 340 350 234 123 85 0 11 167 277 146 89 50 38 0 1.7Uganda 1995 370 1 193 2 491 1 797 1 115 602 323 402 1 376 1 845 1 104 635 312 113 1.42000 283 1 511 3 497 2 479 1 279 607 395 400 1 649 2 782 1 510 671 316 163 1.32005 257 1 598 4 075 3 209 1 576 725 539 371 1 811 3 099 1 800 818 389 257 1.42010 268 2 055 4 735 4 133 2 214 905 613 16 401 1 964 2 923 1 691 924 365 248 1 1.82011 295 2 075 5 044 4 613 2 466 994 604 423 400 2 092 2 853 1 809 973 409 313 252 1.8United Republic 1995 183 2 108 4 091 2 916 1 754 1 007 640 201 1 904 2 532 1 324 735 380 179 1.8of Tanzania 2000 200 2 357 4 836 3 430 2 022 1 202 834 257 2 106 3 426 1 738 868 494 269 1.62005 190 2 062 4 939 4 025 2 310 1 279 1 054 271 1 852 3 521 1 892 968 547 354 1.72010 232 1 975 4 493 4 141 2 427 1 309 1 161 0 248 1 689 2 988 2 013 1 044 578 471 0 1.72011 190 1 975 4 405 4 073 2 402 1 211 1 127 221 1 660 2 896 2 140 944 490 381 1.8Zambia 1995 91 659 1 668 1 124 487 231 130 129 1 125 1 779 717 257 117 63 1.02000 349 2 175 2 610 3 045 435 261 174 150 932 1 118 1 305 186 112 75 2.32005 135 1 240 3 166 2 160 917 358 321 168 1 507 2 463 1 433 569 235 185 1.32010 –2011 105 1 033 2 897 2 194 810 280 207 151 940 1 683 1 063 422 162 99 1.7Zimbabwe 1995 –2000 –2005 210 837 2 264 1 855 762 295 656 269 1 136 2 242 1 255 578 193 603 1.12010 150 710 2 208 1 682 761 350 252 0 173 974 2 185 1 283 490 265 171 0 1.12011 152 784 2 467 2 071 780 377 278 0 174 1 084 2 161 1 386 448 274 160 0 1.2AFRICAN REGIONGLOBAL TUBERCULOSIS REPORT 2012 Data can be downloaded from www.who.int/tb/data 169
SMEAR LABS % OF SMEARPER 100K LABS USINGPOPULATION LED aCULTURELABS PER 5MPOPULATIONLABORATORIESDST b LABSPER 5MPOPULATIONLPA c LABSPER 5MPOPULATIONNUMBER OFLABS USINGXPERT MTB/RIFSECOND-LINE DSTAVAILABLENRL dFREE THROUGH NTPTB DIAGNOSISAlgeria 0.7 0 4.0 0.4 0.1 1 In country yes Yes (all suspects) yes YesAngola 0.7 0 0.8 0.8 0 0Out ofYes (for smearpositiveTB)yescountryyes No 1 429Benin 0.6 12 0.5 0.5 0.5 0 In country yesYes (if TB isconfirmed)yes YesBotswana 2.6 2 2.5 2.5 0 0Out ofcountryyes Yes (all suspects) yes YesBurkina Faso 0.7 0 0.3 0.3 0 0Out ofcountryyes Yes (all suspects) yes YesBurundi 2.0 9 0.6 0 0 0Out ofcountryyes Yes (all suspects) yes YesCameroon 1.1 4 1.0 0.5 0.2 1In and outof countryyes No yes YesCape Verde 3.2 0 0 0 0 0Out ofcountryyes Yes (all suspects) No YesCentral African Republic 1.6 0 1.1 1.1 1.1 0 yes Yes (all suspects) No YesChad 0.5 0 0 0 0 0 No yes Yes (all suspects) yes YesComoros – No yes Yes (all suspects) yes YesCongo 0.7 0 0 0 0 0 No yesYes (if TB isconfirmed)yes YesCôte d'Ivoire 0.6 0 0.5 0.5 0 0 No yes Yes (all suspects) yes YesDemocratic RepublicYes (if TB is2.2 0
REGION OF THE AMERICASTable A4.1 Estimates of the burden of disease caused by TB, 1990–2011 173Table A4.2 Incidence, notification and case detection rates, all forms, 1990–2011 176Table A4.3 Case notifi cations, 1990–2011 179Table A4.4 Treatment outcomes, new smear-positive cases, 1995–2010 182Table A4.5 Treatment outcomes, retreatment cases, 1995–2010 185Table A4.6 HIV testing and provision of CPT, ART and IPT, 2005–2011 188Table A4.7 Testing for MDR-TB and number of confi rmed cases of MDR-TB, 2005–2011 190Table A4.8 New smear-positive case notifi cation by age and sex, 1995–2011 192Table A4.9 Laboratories, NTP services, drug management and infection control, 2011 194
Estimates of mortality, prevalence and incidenceEstimated values are shown as best estimates followed by lower and upper bounds. The lower and upper bounds aredefined as the 2.5th and 97.5th centiles of outcome distributions produced in simulations. See Annex 1 for furtherdetails.Estimated numbers are shown rounded to two significant figures. Estimated rates are shown rounded to three significantfigures unless the value is under 100, in which case rates are shown rounded to two significant figures. Blank cellsindicate that estimates are not available.Estimates for all years are recalculated as new information becomes available and techniques are refined, so they maydiffer from those published in previous reports in this series. Estimates published in previous global TB control reportsshould no longer be used.Data sourceData shown in this annex are taken from the WHO global TB database on 25 September 2012. Data shown in the mainpart of the report were taken from the database in July 2012. As a result, data in this annex may differ slightly fromthose in the main part of the report.Data can be downloaded from www.who.int/tb/data.Country notesCaribbean IslandsData from the territories of Anguilla; Bermuda; Bonaire, Saint Eustatius and Saba; British Virgin Islands; CaymanIslands; Curaçao; Montserrat; Sint Maarten (Dutch part); Turks and Caicos Islands; and US Virgin Islands have beenre-introduced with support from the Caribbean Epidemiology Centre (CAREC/PAHO/WHO).USAIn addition to the 51 reporting areas, the USA includes territories that report separately to WHO. The data for these territoriesare not included in the data reported by the USA.Definitions of case types and outcomes do not exactly match those used by WHO.172 Data can be downloaded from www.who.int/tb/data GLOBAL TUBERCULOSIS REPORT 2012
MORTALITY (EXCLUDING HIV) PREVALENCE (INCLUDING HIV) INCIDENCE (INCLUDING HIV)YEARPOPULATION(MILLIONS)NUMBER(THOUSANDS)RATE aNUMBER(THOUSANDS)RATE aNUMBER(THOUSANDS)Anguilla 1990 < 1
YEARPOPULATION(MILLIONS)MORTALITY (EXCLUDING HIV) PREVALENCE (INCLUDING HIV) INCIDENCE (INCLUDING HIV)NUMBER(THOUSANDS)RATE aNUMBER(THOUSANDS)RATE aNUMBER(THOUSANDS)Costa Rica 1990 3 0.087 (0.081–0.093) 2.8 (2.6–3.0) 3.4 (1.5–6.1) 112 (50–198) 1.5 (1.3–1.7) 48 (42–54)1995 3 0.089 (0.086–0.092) 2.6 (2.5–2.6) 2.8 (1.4–4.8) 82 (40–137) 1.5 (1.3–1.7) 43 (37–48)2000 4 0.081 (0.079–0.084) 2.1 (2.0–2.2) 2.3 (1.2–3.8) 59 (30–97) 1.4 (1.2–1.5) 35 (31–39)2005 4 0.06 (0.057–0.062) 1.4 (1.3–1.4) 1.5 (0.790–2.6) 36 (18–59) 1 (0.880–1.1) 23 (20–26)2009 5 0.043 (0.039–0.047) 0.93 (0.85–1.0) 1 (0.500–1.7) 22 (11–37) 0.72 (0.630–0.810) 16 (14–18)2010 5 0.039 (0.037–0.041) 0.83 (0.79–0.88) 0.86 (0.410–1.5) 19 (8.7–32) 0.65 (0.570–0.740) 14 (12–16)2011 5 0.035 (0.033–0.037) 0.74 (0.70–0.78) 0.73 (0.310–1.3) 15 (6.6–28) 0.58 (0.510–0.660) 12 (11–14)Cuba 1990 11 0.066 (0.062–0.069) 0.62 (0.59–0.65) 6.1 (2.2–12) 58 (21–114) 2.6 (1.6–3.9) 25 (15–37)1995 11 0.088 (0.087–0.090) 0.81 (0.80–0.82) 3.2 (1.5–5.6) 30 (14–52) 2 (1.6–2.5) 19 (15–23)2000 11 0.052 (0.051–0.053) 0.47 (0.46–0.48) 2.1 (0.850–3.8) 19 (7.6–34) 1.4 (1.1–1.8) 13 (10–16)2005 11 0.034 (0.033–0.035) 0.3 (0.30–0.31) 1.5 (0.650–2.7) 13 (5.8–24) 1 (0.850–1.3) 9.2 (7.5–11)2009 11 0.03 (0.029–0.030) 0.26 (0.26–0.27) 1.4 (0.630–2.5) 13 (5.6–23) 1 (0.850–1.2) 9.1 (7.5–11)2010 11 0.03 (0.029–0.030) 0.26 (0.26–0.27) 1.5 (0.620–2.7) 13 (5.5–24) 1 (0.830–1.3) 9.3 (7.4–11)2011 11 0.03 (0.029–0.031) 0.27 (0.26–0.27) 1.4 (0.550–2.5) 12 (4.9–22) 1 (0.830–1.3) 9.3 (7.4–11)Curaçao 2010 < 1
MORTALITY (EXCLUDING HIV) PREVALENCE (INCLUDING HIV) INCIDENCE (INCLUDING HIV)YEARPOPULATION(MILLIONS)NUMBER(THOUSANDS)RATE aNUMBER(THOUSANDS)RATE aNUMBER(THOUSANDS)Panama 1990 2 0.2 (0.180–0.230) 8.4 (7.5–9.4) 1.6 (0.620–3.1) 67 (26–129) 1.1 (0.790–1.6) 47 (33–65)1995 3 0.22 (0.190–0.240) 8.1 (7.2–9.0) 1.3 (0.470–2.6) 49 (18–95) 1.3 (1.0–1.5) 47 (39–57)2000 3 0.21 (0.190–0.230) 7.1 (6.3–7.9) 1.4 (0.500–2.8) 48 (17–93) 1.4 (1.2–1.7) 47 (39–56)2005 3 0.2 (0.190–0.210) 6.1 (5.7–6.5) 1.7 (0.550–3.4) 52 (17–106) 1.5 (1.3–1.8) 47 (39–57)2009 3 0.21 (0.200–0.220) 6 (5.7–6.4) 1.8 (0.630–3.4) 51 (18–99) 1.6 (1.5–1.8) 48 (42–53)2010 4 0.21 (0.190–0.240) 6.1 (5.4–6.8) 1.9 (0.750–3.5) 53 (21–100) 1.7 (1.5–1.9) 48 (42–54)2011 4 0.22 (0.200–0.240) 6.1 (5.5–6.8) 2 (0.860–3.6) 56 (24–100) 1.7 (1.5–1.9) 48 (42–54)Paraguay 1990 4 0.16 (0.120–0.200) 3.7 (2.8–4.8) 3.9 (1.8–6.8) 92 (42–159) 2.8 (2.6–3.0) 66 (61–72)1995 5 0.23 (0.170–0.290) 4.7 (3.6–6.0) 3.5 (1.7–6.1) 74 (35–127) 2.5 (2.3–2.7) 52 (48–56)2000 5 0.24 (0.170–0.330) 4.6 (3.2–6.1) 3.7 (1.7–6.3) 69 (33–119) 2.6 (2.4–2.8) 49 (45–53)2005 6 0.24 (0.180–0.300) 4 (3.1–5.1) 4 (1.9–7.0) 68 (32–118) 2.9 (2.7–3.1) 49 (45–53)2009 6 0.2 (0.170–0.240) 3.2 (2.7–3.8) 4.1 (1.9–7.1) 64 (30–112) 3 (2.7–3.2) 47 (43–51)2010 6 0.19 (0.140–0.250) 2.9 (2.2–3.8) 4.1 (1.9–7.1) 63 (30–109) 3 (2.7–3.2) 46 (42–50)2011 7 0.17 (0.130–0.220) 2.6 (2.0–3.4) 3.9 (1.8–6.6) 59 (28–101) 3 (2.8–3.2) 45 (42–49)Peru 1990 22 7.7 (2.5–16) 35 (12–72) 110 (37–230) 522 (169–1 070) 69 (42–100) 317 (196–468)1995 24 6.4 (3.4–10) 27 (14–43) 78 (31–140) 325 (130–608) 58 (47–69) 242 (198–290)2000 26 3.6 (2.2–5.2) 14 (8.7–20) 64 (26–120) 247 (100–460) 48 (39–57) 184 (151–221)2005 28 2.5 (1.9–3.1) 9.1 (7.0–11) 50 (19–95) 181 (71–343) 39 (33–45) 140 (118–164)2009 29 2.2 (1.1–3.7) 7.7 (3.8–13) 36 (11–76) 126 (38–266) 32 (28–37) 113 (98–128)2010 29 2.2 (1.1–3.7) 7.5 (3.7–13) 34 (10–72) 118 (36–249) 31 (27–35) 106 (93–120)2011 29 2.2 (1.1–3.7) 7.4 (3.6–12) 34 (10–72) 117 (35–246) 30 (26–33) 101 (88–114)Puerto Rico 1990 4 0.062 (0.062–0.062) 1.8 (1.8–1.8) 0.28 (0.110–0.530) 8 (3.1–15) 0.22 (0.190–0.250) 6.2 (5.5–7.1)1995 4 0.063 (0.063–0.063) 1.7 (1.7–1.7) 0.38 (0.150–0.710) 10 (4.0–19) 0.29 (0.260–0.330) 7.9 (6.9–9.0)2000 4 0.026 (0.026–0.027) 0.69 (0.69–0.70) 0.25 (0.096–0.470) 6.4 (2.5–12) 0.19 (0.170–0.220) 5 (4.4–5.7)2005 4 0.017 (0.017–0.017) 0.44 (0.44–0.45) 0.13 (0.052–0.240) 3.4 (1.4–6.2) 0.12 (0.110–0.140) 3.3 (2.9–3.7)2009 4 0.017 (0.017–0.017) 0.44 (0.44–0.44) 0.1 (0.040–0.190) 2.7 (1.1–5.1) 0.088 (0.077–0.100) 2.3 (2.1–2.7)2010 4 0.017 (0.017–0.017) 0.46 (0.45–0.46) 0.088 (0.036–0.160) 2.4 (0.95–4.4) 0.078 (0.068–0.088) 2.1 (1.8–2.4)2011 4 0.018 (0.018–0.018) 0.48 (0.48–0.48) 0.075 (0.029–0.140) 2 (0.77–3.8) 0.068 (0.059–0.077) 1.8 (1.6–2.0)Saint Kitts and 1990 < 1
YEARPOPULATION(MILLIONS)INCIDENCE (INCLUDING HIV) INCIDENCE HIV-POSITIVE NOTIFIED NEW AND RELAPSE CASE DETECTIONNUMBER(THOUSANDS)RATE aNUMBER(THOUSANDS)RATE a NUMBER RATE a PERCENTAnguilla 1990 < 1
INCIDENCE (INCLUDING HIV) INCIDENCE HIV-POSITIVE NOTIFIED NEW AND RELAPSE CASE DETECTIONYEARPOPULATION(MILLIONS)NUMBER(THOUSANDS)RATE aNUMBER(THOUSANDS)RATE a NUMBER RATE a PERCENTCosta Rica 1990 3 1.5 (1.3–1.7) 48 (42–54) 0.037 (0.033–0.042) 1.2 (1.1–1.4) 230 7.5 16 (14–18)1995 3 1.5 (1.3–1.7) 43 (37–48) 0.071 (0.049–0.096) 2 (1.4–2.8) 586 17 40 (35–45)2000 4 1.4 (1.2–1.5) 35 (31–39) 0.098 (0.071–0.130) 2.5 (1.8–3.3) 585 15 43 (38–49)2005 4 1 (0.880–1.1) 23 (20–26) 0.13 (0.098–0.180) 3.1 (2.3–4.1) 534 12 53 (47–61)2009 5 0.72 (0.630–0.810) 16 (14–18) 0.077 (0.058–0.100) 1.7 (1.3–2.2) 443 9.6 62 (54–70)2010 5 0.65 (0.570–0.740) 14 (12–16) 0.071 (0.052–0.093) 1.5 (1.1–2.0) 490 11 75 (67–86)2011 5 0.58 (0.510–0.660) 12 (11–14) 0.055 (0.040–0.073) 1.2 (0.84–1.5) 514 11 88 (78–100)Cuba 1990 11 2.6 (1.6–3.9) 25 (15–37) 0.011 (
YEARPOPULATION(MILLIONS)INCIDENCE (INCLUDING HIV) INCIDENCE HIV-POSITIVE NOTIFIED NEW AND RELAPSE CASE DETECTIONNUMBER(THOUSANDS)RATE aNUMBER(THOUSANDS)RATE a NUMBER RATE a PERCENTPanama 1990 2 1.1 (0.790–1.6) 47 (33–65) 0.14 (0.099–0.200) 6 (4.1–8.2) 846 35 74 (54–110)1995 3 1.3 (1.0–1.5) 47 (39–57) 0.31 (0.240–0.390) 12 (9.0–15) 1 300 49 100 (85–130)2000 3 1.4 (1.2–1.7) 47 (39–56) 0.36 (0.280–0.450) 12 (9.6–15) 1 169 40 83 (70–100)2005 3 1.5 (1.3–1.8) 47 (39–57) 0.2 (0.150–0.240) 6 (4.7–7.5) 1 637 51 110 (89–130)2009 3 1.6 (1.5–1.8) 48 (42–53) 0.26 (0.210–0.300) 7.4 (6.2–8.7) 1 539 44 94 (83–110)2010 4 1.7 (1.5–1.9) 48 (42–54) 0.26 (0.220–0.300) 7.3 (6.2–8.6) 1 496 43 89 (79–100)2011 4 1.7 (1.5–1.9) 48 (42–54) 0.27 (0.230–0.320) 7.6 (6.4–8.9) 1 553 43 91 (81–100)Paraguay 1990 4 2.8 (2.6–3.0) 66 (61–72) 0.028 (0.025–0.030) 0.7 (0.60–0.71) 2 167 51 77 (71–84)1995 5 2.5 (2.3–2.7) 52 (48–56) 0.037 (0.026–0.050) 0.8 (0.55–1.1) 1 745 36 70 (65–75)2000 5 2.6 (2.4–2.8) 49 (45–53) 0.05 (0.036–0.066) 0.9 (0.67–1.2) 1 950 36 74 (69–81)2005 6 2.9 (2.7–3.1) 49 (45–53) 0.071 (0.052–0.093) 1.2 (0.89–1.6) 2 075 35 72 (66–77)2009 6 3 (2.7–3.2) 47 (43–51) 0.1 (0.076–0.130) 1.6 (1.2–2.0) 2 346 37 79 (73–86)2010 6 3 (2.7–3.2) 46 (42–50) 0.11 (0.084–0.140) 1.7 (1.3–2.2) 2 277 35 77 (71–83)2011 7 3 (2.8–3.2) 45 (42–49) 0.34 (0.290–0.400) 5.2 (4.4–6.1) 2 372 36 79 (73–86)Peru 1990 22 69 (42–100) 317 (196–468) 0.67 (0.410–0.990) 3.1 (1.9–4.6) 37 905 175 55 (37–89)1995 24 58 (47–69) 242 (198–290) 1.4 (1.0–1.8) 5.8 (4.3–7.6) 45 310 190 79 (65–96)2000 26 48 (39–57) 184 (151–221) 1.3 (0.970–1.7) 5 (3.7–6.4) 38 661 149 81 (68–99)2005 28 39 (33–45) 140 (118–164) 0.88 (0.660–1.1) 3.2 (2.4–4.1) 33 421 121 86 (74–100)2009 29 32 (28–37) 113 (98–128) 0.65 (0.500–0.820) 2.3 (1.7–2.9) 31 844 111 98 (87–110)2010 29 31 (27–35) 106 (93–120) 0.62 (0.460–0.800) 2.1 (1.6–2.8) 31 073 107 100 (89–110)2011 29 30 (26–33) 101 (88–114) 0.59 (0.450–0.750) 2 (1.5–2.6) 31 241 106 110 (93–120)Puerto Rico 1990 4 0.22 (0.190–0.250) 6.2 (5.5–7.1) 159 4.5 72 (64–82)1995 4 0.29 (0.260–0.330) 7.9 (6.9–9.0) 262 7.1 89 (79–100)2000 4 0.19 (0.170–0.220) 5 (4.4–5.7) 174 4.6 91 (80–100)2005 4 0.12 (0.110–0.140) 3.3 (2.9–3.7) 0.037 (0.026–0.051) 1 (0.68–1.3) 113 3 92 (81–100)2009 4 0.088 (0.077–0.100) 2.3 (2.1–2.7) 0.013 (
NEW AND RELAPSENOTIFICATION RATE a1990–2011YEARNEW ANDRELAPSENEW CASESSMEAR- SMEAR-NEGATIVE/POSITIVE UNKNOWNEXTRA-RE-TREAT EXCL.OTHER RELAPSEPULMONARY RELAPSETOTALRETREATHISTORYUNKNOWN% SMEAR-POS AMONGNEW PULMAnguilla 1990 0 –1995 2 0 2 0 0 0 02000 –2005 –2009 –2010 1 0 1 0 0 0 0 0 0 0• 0 0 • 2011 0 0 0 0 0 0 0 0 0Antigua and 1990 1 –Barbuda 1995 0 –2000 4 3 1 0 0 0 752005 6 6 0 0 0 0 0 0 0 1002009 3 1 1 0 0 1 1 2 0 502010 6 6 0 0 0 0 0 0 1 100• 2 7 • 2011 6 6 0 0 0 0 2 2 0 100Argentina 1990 12 309 –1995 13 450 5 698 4 668 3 067 552000 11 767 4 749 4 110 1 773 104 1 724 1 828 542005 9 770 4 709 3 357 1 561 0 143 666 809 806 582009 7 701 4 044 2 165 937 217 338 489 827 652010 7 287 3 973 2 011 854 159 290 426 716 49 66• 38 24 • 2011 9 610 5 007 2 629 1 613 0 361 689 1 050 352 66Aruba 1990 –1995 –2000 –2005 –2009 –2010 6 4 2 67• 0 7 • 2011 8 7 0 1 100Bahamas 1990 46 –1995 57 38 11 8 1 1 782000 82 56 23 4 0 0 0 712005 48 30 8 7 1 2 2 4 0 792009 45 26 10 5 0 4 1 5 0 722010 31 19 3 7 1 1 1 2 0 86• 18 12 • 2011 41 23 12 5 0 1 1 2 0 66Barbados 1990 5 –1995 3 3 1002000 3 3 0 0 0 0 0 1002005 –2009 2 2 0 0 0 0 0 0 0 1002010 6 6 0 0 0 0 0 0 0 100• 2 0 • 2011 0 0 0 0 0 0 0 0 0Belize 1990 57 –1995 95 36 34 1 4 4 512000 106 44 55 1 6 0 6 442005 102 59 29 3 0 11 4 15 0 672009 88 82 0 0 6 6 12 0 1002010 145 97 47 0 0 1 0 1 0 67• 30 23 • 2011 74 64 0 0 0 10 2 12 0 100Bermuda 1990 0 –1995 4 2 2 502000 0 0 0 0 0 0 02005 –2009 –2010 1 1 0 0 0 0 0 0 0 100• 0 2 • 2011 1 0 1 0 0 0 0 0 0 0Bolivia 1990 11 166 –(Plurinational 1995 14 422 7 010 1 408 1 133 63 63 83State of) 2000 10 127 6 458 1 565 1 288 451 1 630 2 081 802005 9 748 6 278 1 250 1 673 547 225 772 832009 8 847 5 937 699 1 742 469 263 732 18 892010 8 345 5 613 630 1 694 0 408 257 665 18 90• 168 84 • 2011 8 521 5 746 643 1 721 411 226 637 90Bonaire, Saint 2010 0 0 0 0 0Eustatius and Saba 2011 1 0 0 0 0 1 0 1 0Brazil 1990 74 570 –1995 91 013 45 650 29 291 13 814 612000 77 899 41 186 23 622 10 457 2 634 8 700 11 334 642005 80 209 42 093 23 990 11 037 3 089 6 548 9 637 466 642009 75 040 39 267 22 144 10 275 14 3 340 6 478 9 818 3 641 642010 74 395 37 932 23 030 10 017 18 3 398 7 551 10 949 0 62• 50 38 • 2011 74 892 40 294 20 961 10 067 15 3 555 6 490 10 045 2 755 66British Virgin 1990 –Islands 1995 –2000 1 1 1002005 0 0 0 0 0 0 0 0 02009 –2010 1 1 0 0 0 0 0 0 0 100• 0 0 • 2011 0 0 0 0 0 0 0 0 0Canada 1990 1 968 549 516 723 0 180 180 29 521995 1 921 436 656 634 0 195 195 44 402000 1 667 492 528 482 20 145 145 56 482005 1 484 433 446 562 4 39 64 103 68 492009 1 505 462 519 466 0 58 36 94 58 472010 1 322 358 472 444 0 48 24 72 39 43• 7 4 • 2011 1 391 407 456 469 0 59 22 81 39 47Cayman Islands 1990 2 –1995 2 0 2 1 0 0 02000 5 5 0 0 0 0 0 1002005 –2009 2 1 1 0 0 0 0 0 0 502010 4 2 2 0 0 0 0 0 0 50• 8 4 • 2011 2 1 1 0 0 0 0 0 0 50Chile 1990 6 151 –1995 4 150 1 561 1 284 1 017 225 225 552000 3 021 1 290 879 694 158 158 592005 2 505 1 186 502 631 186 128 314 702009 2 398 1 152 509 549 0 188 118 306 0 692010 2 376 1 154 502 553 0 167 96 263 0 70• 47 14 • 2011 2 450 1 196 473 594 0 187 85 272 0 72Colombia 1990 12 447 –1995 9 912 7 530 1 380 1 002 852000 11 630 8 358 1 446 1 487 339 339 852005 10 360 6 870 1 429 1 618 443 443 832009 11 324 7 319 1 611 2 117 0 277 339 616 0 822010 11 420 7 028 1 696 1 985 311 400 469 869 0 81• 37 25 • 2011 11 523 6 512 2 355 2 275 0 381 461 842 0 73REGION OF THE AMERICASaRates are per 100 000 population.GLOBAL TUBERCULOSIS REPORT 2012 Data can be downloaded from www.who.int/tb/data 179
NEW AND RELAPSENOTIFICATION RATE a1990–2011YEARNEW ANDRELAPSENEW CASESSMEAR- SMEAR-NEGATIVE/POSITIVE UNKNOWNEXTRA-RE-TREAT EXCL.OTHER RELAPSEPULMONARY RELAPSETOTALRETREATHISTORYUNKNOWN% SMEAR-POS AMONGNEW PULMCosta Rica 1990 230 –1995 586 245 71 31 0 0 782000 585 349 184 98 35 35 652005 534 330 81 104 19 26 45 802009 443 271 66 89 17 14 31 802010 490 267 89 108 1 25 7 32 2 75• 7 11 • 2011 514 285 128 85 0 16 10 26 0 69Cuba 1990 546 –1995 1 553 834 520 199 54 54 622000 1 183 675 257 201 50 122 172 722005 770 467 160 103 40 9 49 2 742009 712 418 150 91 7 46 5 51 0 742010 827 462 212 98 10 45 11 56 0 69• 5 7 • 2011 805 437 219 86 6 57 16 73 0 67Curaçao 2010 5 5 0 0 0 1002011 1 0 1 0 0 0 0 0 0 0Dominica 1990 6 –1995 8 5 3 3 1002000 –2005 –2009 4 4 0 0 0 0 1 1 0 1002010 8 8 0 0 0 0 0 0 0 100• 8 3 • 2011 2 2 0 0 0 0 1 1 0 100Dominican 1990 2 597 –Republic 1995 4 053 2 787 1 418 244 204 204 662000 5 291 2 907 1 234 540 610 610 702005 5 003 2 949 1 032 602 420 309 729 742009 4 256 2 441 822 615 112 266 186 452 0 752010 3 964 2 159 803 578 100 324 196 520 0 73• 36 43 • 2011 4 309 2 454 809 655 49 342 163 505 0 75Ecuador 1990 8 243 –1995 7 893 5 890 2 237 420 722000 6 908 5 064 1 338 400 106 280 386 792005 4 416 3 048 635 330 403 392 795 832009 4 703 3 317 369 584 433 323 756 902010 4 832 3 373 404 655 0 400 263 663 0 89• 80 35 • 2011 5 106 3 521 380 808 0 397 244 641 0 90El Salvador 1990 2 367 –1995 2 422 2 241 181 –2000 1 485 1 008 278 108 91 180 271 782005 1 794 1 059 402 255 78 36 114 0 722009 1 686 930 363 329 1 63 50 113 0 722010 1 700 972 338 328 0 62 30 92 0 74• 44 30 • 2011 1 896 1 079 371 384 0 62 21 83 0 74Grenada 1990 0 –1995 4 2 1002000 0 0 0 0 0 0 02005 –2009 5 4 1 0 0 0 0 0 0 802010 4 4 0 0 0 0 0 0 0 100• 0 2 • 2011 2 1 1 0 0 0 0 0 0 50Guatemala 1990 3 813 –1995 3 119 2 368 546 205 249 249 812000 2 913 2 052 518 202 141 141 802005 3 365 2 420 588 256 101 58 159 438 802009 2 902 1 609 170 207 828 88 40 128 0 902010 3 322 2 121 265 348 436 152 29 181 0 89• 43 21 • 2011 3 040 1 961 309 243 415 112 48 160 0 86Guyana 1990 168 –1995 296 85 187 22 2 2 312000 422 119 231 34 38 46 84 342005 639 240 352 33 6 8 17 25 0 412009 763 328 301 78 0 56 149 205 0 522010 712 325 274 75 0 38 124 162 0 54• 23 94 • 2011 710 323 282 78 0 27 206 233 0 53Haiti 1990 –1995 6 212 –2000 10 420 5 887 2 930 1 367 236 110 346 672005 14 311 7 340 5 292 1 484 195 33 228 582009 –2010 14 222 8 242 4 335 1 307 0 338 43 381 0 66• 0 141 • 2011 14 315 8 011 4 553 1 374 0 377 46 423 0 64Honduras 1990 3 647 –1995 4 984 2 306 2 214 232 100 100 512000 6 406 3 404 2 396 370 236 236 592005 3 333 2 069 721 362 181 181 742009 2 924 1 881 520 331 0 192 33 225 0 782010 2 876 1 842 482 382 0 170 25 195 0 79• 75 42 • 2011 3 233 2 060 616 377 0 180 10 190 77Jamaica 1990 123 –1995 109 93 14 2 2 2 872000 127 90 20 4 13 13 822005 90 53 31 6 0 0 5 5 0 632009 139 77 48 5 0 9 11 20 0 622010 130 76 46 6 0 2 17 19 0 62• 5 4 • 2011 105 35 39 6 24 1 3 4 0 47Mexico 1990 14 437 –1995 11 329 9 220 1 807 302 842000 18 434 11 676 1 675 2 081 421 914 1 335 872005 18 524 11 997 421 2 657 2 831 618 1 408 2 026 972009 18 846 11 862 958 3 193 2 114 719 816 1 535 111 932010 19 570 12 572 2 812 3 464 0 722 544 1 266 585 82• 17 17 • 2011 19 857 12 960 2 497 3 529 0 871 671 1 542 0 84Montserrat 1990 1 –1995 –2000 0 0 0 0 0 0 02005 1 1 0 0 0 0 0 0 0 1002009 –2010 0 0 0 0 0 0 0 0• 9 0 • 2011 0 0 0 0 0 0 0 0 0Netherlands 1990 –Antilles 1995 –2000 5 2 3 0 0 0 0 0 0 402005 –• 0 0 • 2009 –aRates are per 100 000 population.180 Data can be downloaded from www.who.int/tb/data GLOBAL TUBERCULOSIS REPORT 2012
NEW AND RELAPSENOTIFICATION RATE a1990–2011YEARNEW ANDRELAPSENEW CASESSMEAR- SMEAR-NEGATIVE/POSITIVE UNKNOWNEXTRA-RE-TREAT EXCL.OTHER RELAPSEPULMONARY RELAPSETOTALRETREATHISTORYUNKNOWN% SMEAR-POS AMONGNEW PULMNicaragua 1990 2 944 –1995 2 842 1 568 854 253 167 167 652000 2 402 1 471 541 231 159 159 732005 1 907 1 253 395 160 99 169 268 0 762009 2 283 1 329 541 261 0 152 130 282 0 712010 2 448 1 440 575 274 0 159 127 286 0 71• 71 46 • 2011 2 693 1 552 653 335 0 153 129 282 0 70Panama 1990 846 –1995 1 300 1 066 114 28 108 108 902000 1 169 460 589 74 5 41 93 134 442005 1 637 860 505 216 56 191 247 632009 1 539 755 452 287 0 45 190 235 632010 1 496 707 425 287 0 77 134 211 0 62• 35 43 • 2011 1 553 830 433 235 0 55 124 179 18 66Paraguay 1990 2 167 993 1001995 1 745 748 870 127 28 28 462000 1 950 900 791 170 14 516 530 532005 2 075 1 260 665 150 273 273 652009 2 346 1 498 428 283 41 96 81 177 0 782010 2 277 1 318 499 269 86 105 109 214 75 73• 51 36 • 2011 2 372 1 371 515 251 108 127 177 304 0 73Peru 1990 37 905 –1995 45 310 32 096 7 803 5 411 802000 38 661 22 580 6 018 5 682 4 381 4 381 792005 33 421 18 490 5 592 5 335 809 3 195 1 794 4 989 326 772009 31 844 17 391 5 203 5 380 871 2 999 1 325 4 324 0 772010 31 073 17 264 5 201 5 185 647 2 776 1 404 4 180 77• 175 106 • 2011 31 241 17 754 5 164 5 564 712 2 047 1 603 3 650 0 77Puerto Rico 1990 159 –1995 262 128 111 23 542000 174 81 69 24 542005 113 60 37 16 0 0 0 0 0 622009 63 30 25 8 0 0 0 0 0 552010 80 37 35 4 0 4 0 4 0 51• 5 1 • 2011 50 29 13 8 0 0 0 0 0 69Saint Kitts and 1990 0 –Nevis 1995 5 4 1002000 0 0 0 0 0 0 02005 0 0 0 0 0 0 2 22009 4 4 0 0 0 0 0 0 0 1002010 2 2 0 0 0 0 0 0 0 100• 0 2 • 2011 1 1 0 0 0 0 0 0 0 100Saint Lucia 1990 13 –1995 11 11 1002000 9 7 1 0 1 2 3 882005 14 11 1 0 0 2 0 2 922009 10 7 0 1 0 2 1 3 0 1002010 9 9 0 0 0 0 0 0 0 100• 9 4 • 2011 7 7 0 0 0 0 0 0 0 100Saint Vincent and 1990 2 –the Grenadines 1995 13 5 7 0 4 4 422000 16 9 4 0 3 0 3 692005 7 6 1 0 0 0 0 0 0 862009 9 3 6 0 0 0 2 2 0 332010 15 8 7 0 0 0 2 2 0 53• 2 16 • 2011 17 8 9 0 0 0 0 0 0 47Sint Maarten 2010 3 3 0 0 0 0 0 0 100(Dutch part) 2011 2 2 0 0 0 0 0 100Suriname 1990 82 –1995 –2000 89 37 40 12 0 1 1 482005 117 49 54 6 2 6 2 8 0 482009 177 149 14 9 0 5 10 15 1 912010 194 130 42 14 2 6 10 16 0 76• 20 23 • 2011 124 64 34 20 1 5 6 11 1 65Trinidad and 1990 120 –Tobago 1995 166 7 68 12 22 22 92000 198 115 61 17 5 26 31 652005 166 95 50 12 0 9 13 22 662009 272 154 91 19 0 8 52 60 0 632010 219 136 58 20 0 5 39 44 0 70• 10 17 • 2011 224 121 77 19 0 7 42 49 0 61Turks and Caicos 1990 0 –Islands 1995 –2000 –2005 –2009 –2010 6 3 1 1 0 1 1 2 0 75• 0 23 • 2011 9 8 1 0 0 0 1 1 0 89United States 1990 25 701 –of America 1995 22 728 8 093 10 795 3 835 5 432000 16 310 5 883 7 204 3 211 12 452005 14 080 5 111 6 030 2 939 0 462009 11 545 4 014 4 990 2 383 158 452010 11 181 3 695 4 990 2 134 362 43• 10 3 • 2011 10 521 3 742 4 556 2 189 34 45Uruguay 1990 886 –1995 625 349 178 78 20 20 662000 645 348 165 77 39 39 682005 622 355 147 73 32 15 4 19 712009 704 409 192 66 0 37 37 682010 699 368 218 72 0 41 0 41 0 63• 28 24 • 2011 817 467 249 48 0 53 0 53 0 65US Virgin Islands 1990 4 –1995 4 2 2 0 502000 –2005 –2009 –2010 –• 4 0 • 2011 –Venezuela 1990 5 457 –(Bolivarian 1995 5 578 3 056 1 517 709 272 272 67Republic of) 2000 6 466 3 525 1 616 948 377 377 692005 6 847 3 653 1 853 1 094 247 103 350 662009 6 474 3 436 1 665 1 112 0 261 167 428 0 672010 6 335 3 252 1 758 1 077 0 248 194 442 116 65• 28 21 • 2011 6 282 3 224 1 649 1 196 0 213 195 408 0 66REGION OF THE AMERICASaRates are per 100 000 population.GLOBAL TUBERCULOSIS REPORT 2012 Data can be downloaded from www.who.int/tb/data 181
TREATMENT SUCCESS (%) a1995–2010YEARNUMBERNOTIFIEDSIZE OFCOHORTCOHORT AS% NOTIFIED% OF COHORTCURED COMPLETED DIED FAILED DEFAULTEDNOTEVALUATEDAnguilla 1995 0 –2000 –2005 –2008 –2009 0 –• 0 0 • 2010 0 0 –Antigua and 1995 –Barbuda 2000 3 4 133 100 0 0 0 0 02005 6 6 100 50 33 172008 1 1 100 100 0 0 0 0 02009 1 3 300 67 0 33 0 0 0• 0 33 • 2010 6 6 100 0 33 33 0 33 0Argentina 1995 5 698 5 707 100 5 7 1 0 3 842000 4 749 5 177 109 26 20 5 0 6 432005 4 709 4 709 100 19 34 5 0 5 372008 4 758 2 577 54 24 19 4 0 5 472009 4 044 5 062 125 19 26 4 0 7 43• 12 48 • 2010 3 973 5 088 128 20 27 4 0 8 40Aruba 1995 –2000 –2005 –2008 –2009 6 –• 0 0 • 2010 4 –Bahamas 1995 38 –2000 56 –2005 30 30 100 17 40 17 7 20 02008 31 31 100 32 42 6 3 10 62009 26 26 100 12 69 8 0 12 0• 0 68 • 2010 19 19 100 16 53 16 5 11 0Barbados 1995 3 –2000 3 –2005 11 – 45 45 9 02008 1 3 300 100 0 0 0 0 02009 2 2 100 100 0 0 0 0 0• 0 100 • 2010 6 6 100 100 0 0 0 0 0Belize 1995 36 29 81 52 0 10 3 28 72000 44 45 102 78 0 9 0 2 112005 59 59 100 56 19 12 2 12 02008 83 82 99 83 0 17 0 0 02009 82 –• 52 0 • 2010 97 142 146Bermuda 1995 2 –2000 0 –2005 –2008 –2009 1 – 0 0 0 0 0 100• 0 0 • 2010 1 1 100 0 0 0 0 0 100Bolivia 1995 7 010 7 010 100 53 9 4 1 9 24(Plurinational 2000 6 458 6 212 96 73 6 4 1 9 7State of) 2005 6 278 6 278 100 76 2 3 1 5 122008 6 048 6 048 100 82 2 4 1 5 72009 5 937 5 897 99 84 1 4 1 5 4• 62 88 • 2010 5 613 5 571 99 86 2 4 1 5 3Bonaire, Saint 2009 0 –Eustatius and Saba 2010 0 0 –Brazil 1995 45 650 45 650 100 17 0 1 1 3 792000 41 186 34 007 83 49 22 4 0 9 162005 42 093 42 093 100 31 44 5 1 9 92008 37 697 40 714 108 33 38 5 1 9 142009 39 267 40 818 104 31 41 5 1 10 11• 17 74 • 2010 37 932 41 840 110 37 37 5 0 11 10British Virgin 1995 –Islands 2000 1 1 100 100 02005 0 –2008 –2009 1 – 0 100 0 0 0 0• 0 0 • 2010 1 0 0Canada 1995 436 –2000 492 492 100 22 13 5 1 592005 433 459 106 8 59 9 0 1 222008 488 919 188 12 65 9 0 1 132009 462 850 184 10 65 7 0 0 17• 0 76 • 2010 358 854 239 12 65 8 0 0 15Cayman Islands 1995 0 –2000 5 5 100 0 40 0 0 0 602005 1 – 0 0 0 0 100 02008 1 –2009 1 2 200 50 0 0 0 0 50• 0 50 • 2010 2 2 100 50 0 0 0 0 50Chile 1995 1 561 1 111 71 79 7 0 8 52000 1 290 1 360 105 82 9 0 6 22005 1 186 1 147 97 83 0 9 0 6 22008 1 114 1 259 113 72 9 0 7 122009 1 152 1 365 118 61 11 9 0 7 12• 79 71 • 2010 1 154 1 437 125 51 20 9 0 6 14Colombia 1995 7 530 –2000 8 358 1 634 20 70 10 5 1 8 62005 6 870 7 778 113 63 9 6 1 7 142008 7 196 7 288 101 67 9 6 2 8 82009 7 319 6 899 94 68 9 6 2 9 6• 0 79 • 2010 7 028 7 364 105 69 10 7 1 9 4Costa Rica 1995 245 –2000 349 349 100 43 14 10 1 12 192005 330 306 93 85 4 5 2 3 12008 287 280 98 86 3 5 1 2 22009 271 166 61 49 4 5 1 1 39• 0 87 • 2010 267 297 111 75 12 7 2 2 2Cuba 1995 834 834 100 90 0 4 3 2 22000 675 673 100 91 2 4 1 1 12005 467 466 100 90 2 6 1 1 12008 498 496 100 88 0 8 1 2 02009 418 415 99 87 3 7 2 1 0• 90 89 • 2010 462 458 99 89 1 7 1 2 0a TREATMENT SUCCESS = percent cured + percent completed then rounded to the nearest digit.182 Data can be downloaded from www.who.int/tb/data GLOBAL TUBERCULOSIS REPORT 2012
% OF COHORTTREATMENT SUCCESS (%) a1995–2010YEARNUMBERNOTIFIEDSIZE OFCOHORTCOHORT AS% NOTIFIEDCURED COMPLETED DIED FAILED DEFAULTEDNOTEVALUATEDCuraçao 2009 5 –2010 5 –Dominica 1995 5 –2000 –2005 –2008 3 3 100 100 0 0 0 0 02009 4 4 100 100 0 0 0 0 0• 0 100 • 2010 8 3 38 67 33 0 0 0 0Dominican 1995 2 787 2 007 72 43 21 5 2 13 16Republic 2000 2 907 2 760 95 37 34 5 2 19 42005 2 949 2 697 91 80 5 4 2 7 32008 2 458 2 458 100 71 4 3 1 8 122009 2 441 2 441 100 79 6 4 2 7 2• 64 80 • 2010 2 159 2 194 102 73 7 5 1 7 6Ecuador 1995 5 890 5 236 89 39 2 8 14 372000 5 064 –2005 3 048 2 150 71 81 3 3 3 6 52008 3 380 3 380 100 74 4 4 4 8 72009 3 317 3 330 100 71 4 4 3 8 11• 39 79 • 2010 3 373 3 373 100 75 4 3 3 7 8El Salvador 1995 –2000 1 008 1 008 100 78 1 7 1 5 82005 1 059 1 059 100 91 0 4 1 2 12008 985 985 100 91 1 5 1 3 02009 930 930 100 88 1 5 4 2 0• 0 91 • 2010 972 972 100 91 1 4 2 2 0Grenada 1995 2 –2000 0 –2005 6 – 67 33 02008 5 6 120 33 67 02009 4 4 100 50 50 0• 0 75 • 2010 4 4 100 75 0 25 0 0 0Guatemala 1995 2 368 2 368 100 56 5 3 1 4 312000 2 052 1 908 93 75 11 5 1 7 12005 2 420 –2008 2 070 2 070 100 79 4 5 1 9 22009 1 609 2 121 132 77 6 6 1 9 1• 61 83 • 2010 2 121 2 121 100 77 6 6 1 9 1Guyana 1995 85 296 348 10 34 11 1 38 62000 119 119 100 43 13 12 5 24 32005 240 257 107 2 57 7 26 92008 320 340 106 14 55 5 2 16 82009 328 328 100 13 57 8 1 19 2• 44 71 • 2010 325 325 100 30 41 6 1 18 4Haiti 1995 3 081 – 70 4 1 21 32000 5 887 5 887 100 57 14 5 1 13 102005 7 340 7 340 100 72 8 6 1 7 62008 8 171 –2009 8 435 – 67 12 5 1 8 7• 70 82 • 2010 8 242 8 242 100 72 10 5 1 7 5Honduras 1995 2 306 2 226 97 39 25 7 0 4 252000 3 404 2 362 69 81 5 6 1 5 32005 2 069 1 905 92 81 7 5 0 4 32008 1 897 1 888 100 80 6 5 1 6 32009 1 881 1 881 100 79 6 6 1 6 2• 64 85 • 2010 1 842 1 918 104 79 6 6 1 6 2Jamaica 1995 93 93 100 2 65 10 1 17 52000 90 99 110 5 40 23 0 11 202005 53 53 100 4 53 13 0 26 42008 78 78 100 13 51 10 0 10 152009 77 76 99 55 14 14 0 11 5• 67 47 • 2010 76 76 100 13 34 9 0 5 38Mexico 1995 9 220 9 220 100 69 6 4 3 12 62000 11 676 11 538 99 64 12 6 1 9 82005 11 997 12 172 101 71 6 5 1 6 112008 11 903 11 840 99 81 4 6 1 5 32009 11 862 11 821 100 82 4 6 1 5 2• 75 87 • 2010 12 572 12 304 98 82 4 6 1 5 1Montserrat 1995 –2000 0 –2005 1 –2008 –2009 0 –• 0 0 • 2010 0 0 –Netherlands 1995 –Antilles 2000 2 5 250 20 802005 –• 0 2008 –Nicaragua 1995 1 568 1 536 98 66 14 4 2 10 42000 1 471 1 437 98 70 13 5 1 9 22005 1 253 1 496 119 73 12 5 2 6 32008 1 394 1 481 106 73 16 3 1 7 02009 1 329 1 552 117 69 16 4 1 7 3• 80 85 • 2010 1 440 1 704 118 66 18 5 2 6 3Panama 1995 1 066 1 388 130 10 60 14 1 13 32000 460 460 100 27 33 7 2 22 102005 860 873 102 68 12 8 0 10 12008 829 883 107 67 13 7 0 13 02009 755 768 102 65 16 7 1 12 0• 69 80 • 2010 707 717 101 64 16 7 1 12 0Paraguay 1995 748 748 100 8 43 3 0 17 292000 900 900 100 21 45 5 0 22 72005 1 260 1 452 115 46 33 5 8 72008 1 345 1 350 100 68 12 5 0 6 82009 1 498 1 467 98 75 5 7 0 5 7• 51 78 • 2010 1 318 1 317 100 69 9 8 0 5 8Peru 1995 32 096 28 185 88 75 9 3 2 6 62000 22 580 22 230 98 90 0 2 2 3 42005 18 490 14 793 80 91 2 2 4 12008 17 989 14 805 82 78 4 3 1 6 82009 17 391 14 212 82 70 11 3 1 6 9• 83 68 • 2010 17 264 17 264 100 57 12 2 5 5 20Puerto Rico 1995 128 128 100 68 23 8 22000 81 81 100 64 31 5 02005 60 60 100 75 0 22 0 3 02008 52 43 83 0 63 33 0 5 02009 30 37 123 81 0 16 0 0 3• 68 78 • 2010 37 37 100 78 0 14 3 5 0a TREATMENT SUCCESS = percent cured + percent completed then rounded to the nearest digit.REGION OF THE AMERICASGLOBAL TUBERCULOSIS REPORT 2012 Data can be downloaded from www.who.int/tb/data 183
TREATMENT SUCCESS (%) a1995–2010YEARNUMBERNOTIFIEDSIZE OFCOHORTCOHORT AS% NOTIFIED% OF COHORTCURED COMPLETED DIED FAILED DEFAULTEDNOTEVALUATEDSaint Kitts and 1995 4 5 125 20 40 20 0 20 0Nevis 2000 0 –2005 0 –2008 5 5 100 80 0 0 0 202009 4 5 125 80 0 0 0 0 20• 60 100 • 2010 2 2 100 100 0 0 0 0 0Saint Lucia 1995 11 –2000 7 8 114 88 12 0 0 0 02005 11 13 118 15 54 31 0 0 02008 18 18 100 28 67 6 0 0 02009 7 7 100 57 29 0 14 0• 0 89 • 2010 9 9 100 22 67 0 0 0 11Saint Vincent and 1995 5 –the Grenadines 2000 9 13 144 100 0 0 0 0 02005 6 –2008 11 4 36 100 0 0 0 02009 3 1 33 0 0 0 0 0 100• 0 0 • 2010 8 8 100 0 0 0 0 0 100Sint Maarten 2009 –(Dutch part) 2010 3 3 100 100 0 0 0 0Suriname 1995 51 – 10 4 12 8 672000 37 37 100 49 19 16 0 14 32005 49 –2008 68 71 104 38 21 13 0 24 42009 149 143 96 64 3 11 1 16 5• 14 60 • 2010 130 73 56 60 0 12 0 4 23Trinidad and 1995 7 78 1 114 49 21 19 1 10 0Tobago 2000 115 194 169 22 46 11 2 6 132005 95 106 112 68 4 12 16 02008 169 169 100 65 2 15 4 14 02009 154 154 100 61 8 14 1 14 1• 69 76 • 2010 136 136 100 72 4 9 3 11 1Turks and Caicos 1995 –Islands 2000 2 – 0 0 0 0 100 02005 3 – 33 33 0 0 0 332008 –2009 –• 0 75 • 2010 3 4 133 75 25United States 1995 8 093 8 116 100 76 15 4 6of America 2000 5 883 5 901 100 83 11 3 32005 5 111 5 136 100 84 8 2 62008 4 742 3 709 78 85 9 2 52009 4 014 7 460 186 60 6 1 32• 76 64 • 2010 3 695 7 034 190 64 6 1 29Uruguay 1995 349 370 106 41 27 10 1 4 172000 348 344 99 85 0 13 1 1 02005 355 345 97 80 4 11 0 4 12008 424 422 100 77 7 9 1 5 22009 409 406 99 73 7 12 0 6 2• 68 85 • 2010 368 368 100 80 5 10 0 5 0US Virgin Islands 1995 2 2 100 50 0 0 0 502000 –2005 –2008 –2009 –• 50 0 • 2010 –Venezuela 1995 3 056 3 056 100 68 6 4 1 8 13(Bolivarian 2000 3 525 3 390 96 76 0 4 0 13 6Republic of) 2005 3 653 3 581 98 83 5 0 10 22008 3 344 3 301 99 83 0 4 0 11 12009 3 436 3 433 100 84 0 4 0 11 1• 74 83 • 2010 3 252 3 157 97 83 0 5 0 11 0a TREATMENT SUCCESS = percent cured + percent completed then rounded to the nearest digit.184 Data can be downloaded from www.who.int/tb/data GLOBAL TUBERCULOSIS REPORT 2012
% OF COHORTTREATMENT SUCCESS (%) a1995–2010YEARNUMBERNOTIFIEDSIZE OFCOHORTCOHORT AS% NOTIFIEDCURED COMPLETED DIED FAILED DEFAULTEDNOTEVALUATEDAnguilla 1995 0 –2000 –2005 –2008 –2009 0 –• 0 0 • 2010 0 0 –Antigua and 1995 –Barbuda 2000 0 –2005 0 –2008 0 0 –2009 2 1 50 100 0 0 0 0 0• 0 0 • 2010 0 0 –Argentina 1995 –2000 1 828 –2005 809 1 615 200 7 26 5 0 9 532008 1 392 374 27 10 16 6 1 9 592009 827 893 108 10 20 4 1 13 52• 0 32 • 2010 716 1 114 156 9 23 4 1 15 49Aruba 1995 –2000 –2005 –2008 –2009 –• 0 0 • 2010 –Bahamas 1995 1 –2000 0 –2005 4 4 100 25 50 0 0 25 02008 4 3 75 0 33 33 0 0 332009 5 5 100 20 60 20 0 0 0• 0 100 • 2010 2 2 100 0 100 0 0 0 0Barbados 1995 –2000 0 –2005 –2008 0 0 –2009 0 0 –• 0 0 • 2010 0 0 –Belize 1995 4 13 325 23 0 23 8 38 82000 6 –2005 15 14 93 57 29 14 0 0 02008 5 0 02009 12 –• 23 0 • 2010 1 1 100Bermuda 1995 –2000 0 –2005 –2008 –2009 0 –• 0 0 • 2010 0 0 –Bolivia 1995 63 462 733 57 9 7 5 15 7(Plurinational 2000 2 081 804 39 49 11 12 2 8 16State of) 2005 772 772 100 63 3 5 3 7 192008 590 590 100 72 4 8 2 7 72009 732 598 82 73 5 7 2 7 7• 66 78 • 2010 665 589 89 72 5 5 3 10 5Bonaire, Saint 2009 0 –Eustatius and Saba 2010 0 –Brazil 1995 –2000 11 334 7 859 69 30 10 4 0 14 412005 9 637 9 479 98 26 22 7 2 19 252008 11 164 9 494 85 18 32 8 2 25 152009 9 818 10 664 109 15 28 8 2 23 24• 0 46 • 2010 10 949 10 721 98 18 28 8 2 25 19British Virgin 1995 –Islands 2000 –2005 0 –2008 –2009 0 –• 0 0 • 2010 0 0 –Canada 1995 195 –2000 145 145 100 16 16 6 1 2 602005 103 106 103 8 59 7 0 3 232008 122 126 103 7 71 10 0 0 112009 94 95 101 4 60 7 0 1 27• 0 71 • 2010 72 94 131 15 56 9 0 0 20Cayman Islands 1995 0 –2000 0 –2005 0 –2008 0 –2009 0 0 –• 0 0 • 2010 0 0 –Chile 1995 225 –2000 158 150 95 32 26 8 1 18 152005 314 140 45 69 3 14 1 9 32008 219 231 105 22 8 1 10 592009 306 219 72 15 9 7 2 7 60• 0 26 • 2010 263 336 128 14 12 6 2 9 58Colombia 1995 –2000 339 –2005 443 0 02008 413 –2009 616 –• 0 17 • 2010 869 920 106 11 5 3 1 7 73Costa Rica 1995 0 –2000 35 69 197 23 9 10 3 25 302005 45 49 109 55 12 4 2 24 22008 24 32 133 56 28 3 6 62009 31 2 6 0 0 50 0 0 50• 0 80 • 2010 32 35 109 37 43 11 0 9 0Cuba 1995 54 55 102 82 0 7 5 5 02000 172 58 34 78 7 10 3 2 02005 49 48 98 67 6 4 2 212008 60 56 93 64 16 18 0 2 02009 51 61 120 69 5 15 5 7 0• 82 82 • 2010 56 55 98 67 15 4 4 11 0REGION OF THE AMERICASa TREATMENT SUCCESS = percent cured + percent completed then rounded to the nearest digit.GLOBAL TUBERCULOSIS REPORT 2012 Data can be downloaded from www.who.int/tb/data 185
TREATMENT SUCCESS (%) a1995–2010YEARNUMBERNOTIFIEDSIZE OFCOHORTCOHORT AS% NOTIFIED% OF COHORTCURED COMPLETED DIED FAILED DEFAULTEDNOTEVALUATEDCuraçao 2009 –2010 –Dominica 1995 3 –2000 –2005 –2008 4 0 02009 1 0 0• 0 100 • 2010 0 1 – 0 100 0 0 0 0Dominican 1995 204 –Republic 2000 610 498 82 29 26 3 4 27 112005 729 530 73 56 5 7 8 19 62008 497 497 100 0 0 0 0 0 1002009 452 434 96 47 6 13 5 29 0• 0 64 • 2010 520 384 74 51 13 9 5 18 4Ecuador 1995 –2000 386 –2005 795 554 70 56 8 5 10 12 92008 778 778 100 61 8 7 8 15 02009 756 756 100 46 9 6 8 16 16• 0 0 • 2010 663 –El Salvador 1995 –2000 271 181 67 63 3 9 3 18 32005 114 114 100 68 0 6 4 13 82008 86 86 100 84 0 8 0 5 32009 113 113 100 85 3 3 1 8 1• 0 90 • 2010 92 92 100 88 2 2 3 1 3Grenada 1995 –2000 0 –2005 –2008 1 0 02009 0 0 –• 0 0 • 2010 0 0 –Guatemala 1995 249 254 102 59 15 4 2 4 172000 141 164 116 63 16 4 4 10 22005 159 –2008 202 202 100 55 10 8 6 16 52009 128 181 141 55 8 5 7 20 4• 73 64 • 2010 181 181 100 55 8 5 7 20 4Guyana 1995 2 –2000 84 38 45 24 29 13 5 26 32005 25 23 92 22 35 9 9 13 132008 117 146 125 4 22 10 2 24 382009 205 205 100 0 51 14 0 18 17• 0 52 • 2010 162 162 100 0 52 14 1 28 5Haiti 1995 –2000 346 55 16 42 15 5 7 22 92005 228 228 100 63 7 3 0 13 142008 373 –2009 381 – 49 20 7 3 10 11• 0 75 • 2010 381 381 100 60 14 5 2 10 8Honduras 1995 100 –2000 236 180 76 44 10 8 2 6 292005 181 169 93 59 9 6 2 17 72008 184 145 79 65 6 10 3 14 32009 225 192 85 50 7 10 1 10 22• 0 75 • 2010 195 164 84 66 9 7 2 15 1Jamaica 1995 2 6 300 0 67 17 0 17 02000 13 –2005 5 5 100 20 80 02008 3 3 100 0 67 0 0 33 02009 20 19 95 16 58 5 0 21 0• 67 32 • 2010 19 19 100 5 26 26 0 21 21Mexico 1995 –2000 1 335 138 10 33 4 8 7 12 362005 2 026 1 456 72 48 7 7 4 14 202008 1 370 1 829 134 55 7 11 4 11 112009 1 535 1 229 80 56 5 9 6 10 14• 0 63 • 2010 1 266 1 272 100 55 7 9 6 11 10Montserrat 1995 –2000 0 –2005 0 –2008 –2009 0 –• 0 0 • 2010 0 0 –Netherlands 1995 –Antilles 2000 0 –2005 –• 0 2008 –Nicaragua 1995 167 289 173 69 10 4 3 11 32000 159 230 145 65 10 6 2 15 22005 268 181 68 71 12 7 2 7 22008 167 150 90 97 0 0 0 3 02009 282 178 63 70 6 3 6 11 3• 78 76 • 2010 286 204 71 60 16 8 4 9 2Panama 1995 108 –2000 134 42 31 19 24 2 0 48 72005 247 237 96 23 35 9 4 22 72008 191 238 125 16 30 9 2 42 12009 235 203 86 18 30 10 0 37 4• 0 56 • 2010 211 208 99 23 34 11 3 30 0Paraguay 1995 28 –2000 530 144 27 19 40 6 1 25 92005 273 164 60 44 26 4 10 162008 154 164 106 46 14 9 1 10 212009 177 188 106 47 9 9 4 11 20• 0 60 • 2010 214 216 101 54 6 8 2 9 20Peru 1995 –2000 4 381 4 521 103 78 0 4 7 6 42005 4 989 2 299 46 78 5 5 11 12008 4 534 –2009 4 324 2 163 50 49 21 4 2 12 12• 0 0 • 2010 4 180 –Puerto Rico 1995 –2000 –2005 0 113 – 73 23 0 4 12008 0 0 –2009 0 0 –• 0 50 • 2010 4 4 100 50 0 25 25 0 0a TREATMENT SUCCESS = percent cured + percent completed then rounded to the nearest digit.186 Data can be downloaded from www.who.int/tb/data GLOBAL TUBERCULOSIS REPORT 2012
% OF COHORTTREATMENT SUCCESS (%) a1995–2010YEARNUMBERNOTIFIEDSIZE OFCOHORTCOHORT AS% NOTIFIEDCURED COMPLETED DIED FAILED DEFAULTEDNOTEVALUATEDSaint Kitts and 1995 –Nevis 2000 0 –2005 2 2 100 50 502008 0 0 –2009 0 0 –• 0 0 • 2010 0 0 –Saint Lucia 1995 –2000 3 1 33 100 0 0 0 0 02005 2 –2008 1 1 100 0 0 0 100 0 02009 3 3 100 33 67 0 0 0• 0 0 • 2010 0 0 –Saint Vincent and 1995 4 –the Grenadines 2000 3 3 100 100 0 0 0 0 02005 0 –2008 4 4 100 0 0 0 0 100 02009 2 1 50 0 0 0 0 100 0• 0 0 • 2010 2 0 0Sint Maarten 2009 –(Dutch part) 2010 0 –Suriname 1995 –2000 1 –2005 8 –2008 7 3 43 0 33 0 0 33 332009 15 12 80 50 0 8 0 42 0• 0 55 • 2010 16 11 69 45 9 27 0 0 18Trinidad and 1995 22 –Tobago 2000 31 22 71 23 45 14 9 9 02005 22 21 95 19 38 29 14 02008 47 47 100 32 4 11 6 47 02009 60 60 100 48 20 15 0 17 0• 0 64 • 2010 44 44 100 43 20 14 0 23 0Turks and Caicos 1995 –Islands 2000 –2005 3 – 33 33 33 0 0 02008 –2009 –• 0 0 • 2010 2 0 0United States 1995 –of America 2000 –2005 –2008 –2009 –• 0 0 • 2010 –Uruguay 1995 20 25 125 56 20 16 0 8 02000 39 –2005 19 30 158 57 17 13 3 7 32008 56 57 102 60 12 14 0 14 02009 37 41 111 46 10 34 0 7 2• 76 76 • 2010 41 41 100 56 20 15 0 5 5US Virgin Islands 1995 –2000 –2005 –2008 –2009 –• 0 0 • 2010 –Venezuela 1995 272 –(Bolivarian 2000 377 –Republic of) 2005 350 247 71 80 4 2 12 22008 432 227 53 84 0 5 1 10 02009 428 261 61 80 0 4 2 13 2• 0 83 • 2010 442 248 56 83 0 6 1 10 0REGION OF THE AMERICASa TREATMENT SUCCESS = percent cured + percent completed then rounded to the nearest digit.GLOBAL TUBERCULOSIS REPORT 2012 Data can be downloaded from www.who.int/tb/data 187
–% OF TB PATIENTS WITHKNOWN HIV STATUS2005–2011YEAR% OF TBPATIENTS WITHKNOWN HIVSTATUSNUMBER OF TBPATIENTS WITHKNOWN HIVSTATUSPATIENTSNOTIFIED(NEW ANDRETREAT)NUMBER OFHIV-POSITIVETB PATIENTS% OF TESTEDTB PATIENTSHIV-POSITIVE% OF HIV-POSITIVE TBPATIENTS ONCPT% OF HIV-POSITIVE TBPATIENTS ONARTNUMBER OFHIV-POSITIVEPEOPLEPROVIDED IPTAnguilla 20052009 0 02010 0 0 1 0– – 2011 0 0 0Antigua and 2005 100 6 6 3 50 100 100 0Barbuda 2009 100 4 4 0 0 02010 86 6 7 5 83 40 100 0• 100 100 • 2011 100 8 8 5 62 40 100 5Argentina 2005 11 2422009 13 1 093 8 190 530 482010 14 1 121 7 762 672 60– 10 • 2011 10 1 053 10 651 559 53Aruba 200520092010 6– – 2011 8Bahamas 2005 502009 100 46 46 15 33 40 672010 103 33 32 16 48 31 75– 100 • 2011 100 42 42 12 29 42 67Barbados 2005 8 2 25 02009 100 2 2 0 0 02010 100 6 6 2 33 0 100– – 2011 0 0 0Belize 2005 100 106 106 25 24 68 68 4092009 95 89 94 17 19 100 1002010 98 142 145 29 20 100 100• 100 84 • 2011 84 64 76 24 38 100Bermuda 2005 1 0 02009 0 02010 100 1 1 0 0– 100 • 2011 100 1 1 0 0Bolivia 2005 0 0 9 973 0 50(Plurinational 2009 17 1 509 9 128 38 3 21 76State of) 2010 22 1 897 8 620 130 7 0 87• 0 47 • 2011 47 4 118 8 747 138 3 87Bonaire, Saint 2010 0 0 0Eustatius and Saba 2011 1Brazil 2005 59 51 552 87 223 8 249 16 0 85 6742009 52 44 038 85 159 8 828 20 882010 63 51 764 81 946 9 338 18 92• 59 58 • 2011 58 49 091 84 137 9 575 20 92British Virgin 2005 0 0 0 27Islands 2009 1 1 100 100 1002010 0 0 1 0– – 2011 0 0 0Canada 2005 26 414 1 616 63 152009 40 645 1 599 64 102010 48 658 1 385 53 8• 26 36 • 2011 36 529 1 452 77 15Cayman Islands 2005 1 0 02009 100 2 2 0 02010 75 3 4 0 0– 100 • 2011 100 2 2 0 0Chile 2005 2 6332009 2 5162010 2 472– 10 • 2011 10 259 2 535 120 46Colombia 2005 53 5 537 10 360 353 62009 43 5 031 11 663 1 133 23 212010 43 5 079 11 889 1 231 24 35• 53 55 • 2011 55 6 579 11 984 1 292 20 36Costa Rica 2005 67 374 560 50 13 842009 104 476 457 41 92010 99 494 499 54 11 0 0• 67 95 • 2011 95 498 524 47 9 0 0Cuba 2005 93 729 781 0 02009 99 710 717 46 6 0 80 1 5612010 103 862 838 56 6 0 62 1 366• 93 95 • 2011 95 780 821 69 9 30 80 1 429Curaçao 2010 0 0 5 02011 1Dominica 2005 02009 80 4 5 1 25 0 100 22010 38 3 8 1 33 100 100– 67 • 2011 67 2 3 0 0Dominican 2005 1 78 5 312 3 4 0 0 953Republic 2009 57 2 516 4 442 403 16 0 0 8222010 60 2 489 4 160 547 22 8 4 5 041• 1 57 • 2011 57 2 540 4 472 648 26 41 66Ecuador 2005 0 10 4 808 3 30 02009 47 2 385 5 026 443 19 1002010 102 5 183 5 095 427 8 100• 0 100 • 2011 100 5 350 5 350 576 11El Salvador 2005 84 1 544 1 830 188 12 20 382009 95 1 650 1 736 204 12 28 35 972010 96 1 667 1 730 180 11 82 63 455• 84 98 • 2011 98 1 878 1 917 194 10 85 77Grenada 2005 0 02009 100 5 5 1 20 100 100 02010 100 4 4 1 25 0 0 0– 100 • 2011 100 2 2 0 0Guatemala 2005 16 600 3 861 478 80 2432009 65 1 920 2 942 260 14 100 100 2502010 63 2 121 3 351 255 12 100 100• 16 69 • 2011 69 2 125 3 088 260 12 100 100Guyana 2005 70 456 656 80 182009 79 717 912 195 27 82 55 1622010 88 734 836 209 28 77 59 144• 70 93 • 2011 93 852 916 199 23 94 83 119Haiti 2005 0 0 14 344 1 7972009 9 886 2 236 23 5 82010 67 9 518 14 265 1 892 20 13 10 4 112• 0 73 • 2011 73 10 461 14 361 2 025 19 12 17188 Data can be downloaded from www.who.int/tb/data GLOBAL TUBERCULOSIS REPORT 2012
–% OF TB PATIENTS WITHKNOWN HIV STATUS2005–2011YEAR% OF TBPATIENTS WITHKNOWN HIVSTATUSNUMBER OF TBPATIENTS WITHKNOWN HIVSTATUSPATIENTSNOTIFIED(NEW ANDRETREAT)NUMBER OFHIV-POSITIVETB PATIENTS% OF TESTEDTB PATIENTSHIV-POSITIVE% OF HIV-POSITIVE TBPATIENTS ONCPT% OF HIV-POSITIVE TBPATIENTS ONARTNUMBER OFHIV-POSITIVEPEOPLEPROVIDED IPTHonduras 2005 44 1 455 3 333 200 14 0 0 02009 55 1 619 2 957 192 12 100 89 962010 54 1 557 2 901 201 13 90 90 27• 44 70 • 2011 70 2 256 3 243 255 11 31 71Jamaica 2005 83 79 95 28 35 43 542009 64 96 150 29 30 1002010 87 128 147 30 23 100• 83 81 • 2011 81 88 108 15 17 93Mexico 2005 7 1 382 19 932 217 162009 30 5 879 19 773 945 16 100 23 6762010 43 8 915 20 699 1 645 18 100 26• 7 52 • 2011 52 10 599 20 528 1 985 19 64 28Montserrat 2005 100 1 1 0 02009 0 02010 0 0 0• 100 – 2011 0 0 0Netherlands 2005 2 2 100Antilles 2009Nicaragua 2005 0 0 2 076 30 02009 45 1 081 2 413 32 3 94 94 602010 56 1 440 2 575 60 4 67 67 465• 0 55 • 2011 55 1 552 2 822 16 1 152Panama 2005 86 1 569 1 828 200 13 10 4002009 79 1 364 1 729 213 16 42 28 1962010 96 1 558 1 630 240 15 63 84• 86 91 • 2011 91 1 534 1 695 245 16 65 48Paraguay 2005 2 3482009 11 271 2 427 140 52 0 51 02010 33 817 2 461 144 18 0 67– 60 • 2011 60 1 520 2 549 174 11 25 56Peru 2005 2 668 35 541 668 100 1 2142009 35 11 710 33 169 678 6 18 1 3612010 29 9 539 32 477 853 9 1 1 183• 2 21 • 2011 21 7 052 32 844 960 14 2Puerto Rico 2005 82 93 113 28 302009 97 61 63 9 15 33 56 02010 95 76 80 14 18 43 50• 82 90 • 2011 90 45 50 9 20Saint Kitts and 2005 2Nevis 2009 100 4 4 0 02010 100 2 2 0 0– 100 • 2011 100 1 1 0 0Saint Lucia 2005 7 1 14 0 02009 100 11 11 4 36 0 25 02010 100 9 9 0 0• 7 100 • 2011 100 7 7 1 14 0 100Saint Vincent and 2005 100 7 7 1 14 0 0the Grenadines 2009 64 7 11 5 71 20 12010 59 10 17 3 30 100• 100 94 • 2011 94 16 17 5 31 60Sint Maarten 2010 100 3 3 0 0(Dutch part) 2011 100 2 2 0 0Suriname 2005 73 87 119 20 23 102009 76 143 188 44 31 11 502010 85 173 204 58 34 10 38• 73 90 • 2011 90 118 131 38 32 18 53Trinidad and 2005 69 124 179 42 34 29 36 0Tobago 2009 94 306 324 95 31 14 6 42010 98 254 258 58 23 19 34 11• 69 94 • 2011 94 250 266 83 33 20 36Turks and Caicos 2005 5 1 20 0 0Islands 2009 3 1 33 02010 71 5 7 1 20 100 100– 10 • 2011 10 1 10 0 0United States 2005 59 8 273 14 080 1 035 13of America 2009 62 7 197 11 545 711 102010 66 7 404 11 181 627 8• 59 81 • 2011 81 8 527 10 521 671 8Uruguay 2005 92 574 626 74 13 02009 94 662 704 102 15 0 192010 92 646 699 104 16 0 34• 92 91 • 2011 91 741 817 110 15 0 31US Virgin Islands 200520092010– – 2011Venezuela 2005 39 2 678 6 950 392 15 0 39(Bolivarian 2009 73 4 856 6 641 487 10 0 21 102Republic of) 2010 78 5 213 6 645 479 9 33 102• 39 62 • 2011 62 4 033 6 477 519 13 32REGION OF THE AMERICASGLOBAL TUBERCULOSIS REPORT 2012 Data can be downloaded from www.who.int/tb/data 189
YEARTOTALCONFIRMEDCASES OFMDR-TB aESTIMATED CASESOF MDR-TB AMONGNOTIFIEDESTIMATED CASESOF MDR-TB AMONGNOTIFIEDNEW PULMONARY CASESNUMBER OFBACT+VE bTESTED FORMDR-TB% OFBACT+VE bTESTED FORMDR-TBESTIMATED CASESOF MDR-TB AMONGNOTIFIEDPREVIOUSLY TREATED CASESNUMBER OFNOTIFIEDTESTED FORMDR-TB% OF NOTIFIEDTESTED FORMDR-TBAnguilla 2005 – –2009 – –2010 0 0 – 0 –2011 0 0 (0–0) 0 (0–0) 0 – 0 (0–0) 0 –Antigua and 2005 – –Barbuda 2009 0 0 0 1 502010 0 0 0 0 –2011 0 0.35 (0.19–0.50) 0.13 (
YEARTOTALCONFIRMEDCASES OFMDR-TB aESTIMATED CASESOF MDR-TB AMONGNOTIFIEDESTIMATED CASESOF MDR-TB AMONGNOTIFIEDNEW PULMONARY CASESNUMBER OFBACT+VE bTESTED FORMDR-TB% OFBACT+VE bTESTED FORMDR-TBESTIMATED CASESOF MDR-TB AMONGNOTIFIEDPREVIOUSLY TREATED CASESNUMBER OFNOTIFIEDTESTED FORMDR-TB% OF NOTIFIEDTESTED FORMDR-TBHonduras 2005 3 3 0.13 0 02009 4 27 1.4 43 192010 9 57 3.1 62 322011 5 70 (35–110) 47 (20–92) 30 1.5 23 (11–42) 65 34Jamaica 2005 0 11 19 2 402009 0 67 87 –2010 1 40 31 5 262011 1 2.5 (1.1–3.9) 2.1 (0.69–3.3) 28 64 0.44 (0.17–0.71) 1 25Mexico 2005 394 314 2.1 74 3.72009 11 1
MALEFEMALEYEAR 0–14 15–24 25–34 35–44 45–54 55–64 65+0–14 15–24 25–34 35–44 45–54 55–64 65+UN-KNOWNUN-KNOWNMALE:FEMALERATIOAnguilla 1995 –2000 –2005 –2010 0 0 0 0 0 0 1 0 0 0 0 0 0 0 –2011 0 0 0 0 0 0 0 0 0 0 0 0 0 0 0 0 –Antigua and 1995 –Barbuda 2000 0 0 0 0 0 0 1 1 1 1 0 0 0 0 0.332005 1 1 2 2 0.502010 0 0 2 0 2 1 0 0 0 0 1 0 0 0 0 0 5.02011 0 0 1 1 3 1 1 0 0 1 0 0 0 0 0 0 7.0Argentina 1995 –2000 97 278 594 402 419 368 330 121 544 479 262 230 179 216 1.22005 64 621 530 358 384 340 348 90 530 474 290 198 169 240 1.32010 56 536 491 309 302 340 282 2 59 421 426 233 184 153 176 1 1.42011 143 664 657 434 397 358 289 9 142 587 470 279 192 169 213 4 1.4Aruba 1995 –2000 –2005 –2010 –2011 4 1 1 1 2.5Bahamas 1995 3 3 5 7 4 2 2 0 1 7 2 0 0 1 2.42000 1 2 7 9 4 3 2 2 5 7 8 2 3 1 1.02005 –2010 0 2 3 5 0 2 0 0 0 5 1 1 0 0 0 0 1.72011 0 2 3 6 2 2 1 0 0 1 3 3 0 0 0 0 2.3Barbados 1995 –2000 0 0 0 2 0 0 0 0 0 1 0 0 0 0 2.02005 –2010 0 0 0 1 2 0 0 0 0 1 0 0 2 0 0 0 1.02011 0 0 0 0 0 0 0 0 0 0 0 0 0 0 0 0 –Belize 1995 1 1 2 4 0 1 1 0 6 2 0 1 1 2 0.832000 2 5 7 2 6 3 5 0 2 1 2 4 1 4 2.12005 0 8 8 6 8 5 3 0 4 4 4 3 2 4 1.82010 2 9 16 22 24 11 18 4 5 7 7 9 4 5 2.52011 0 8 14 9 16 2 0 0 2 0 8 4 1 0 3.3Bermuda 1995 –2000 –2005 –2010 0 0 0 1 0 0 0 0 0 0 0 0 0 0 0 0 –2011 0 0 0 0 0 0 0 0 0 0 0 0 0 0 0 0 –Bolivia 1995 –(Plurinational 2000 166 1 182 797 518 466 340 366 191 831 588 334 254 192 233 1.5State of) 2005 157 1 320 725 439 391 346 415 160 846 533 276 226 182 262 1.52010 95 1 150 622 415 395 338 409 119 744 471 238 191 162 264 1.62011 100 1 231 685 372 371 302 457 146 778 459 235 183 155 272 1.6Bonaire, Saint 2010 0 0 0 0 0 0 0 0 0 0 0 0 0 0 –Eustatius and Saba 2011 0 0 0 0 0 0 0 0 0 0 0 0 0 0 0 0 –Brazil 1995 –2000 1 894 7 268 11 568 11 906 8 623 5 085 4 494 1 859 6 719 7 215 5 395 3 582 2 384 2 496 1.72005 317 5 074 6 119 6 128 5 259 2 803 2 140 355 3 496 3 663 2 626 1 897 1 112 1 104 2.02010 298 4 405 6 381 5 293 4 762 2 875 1 947 43 280 2 677 3 008 2 211 1 720 1 038 979 15 2.22011 336 4 877 6 755 5 462 5 054 3 083 2 142 41 356 2 815 3 131 2 230 1 779 1 164 1 069 0 2.2British Virgin 1995 –Islands 2000 1 –2005 –2010 0 0 0 0 0 1 0 0 0 0 0 0 0 0 0 0 –2011 0 0 0 0 0 0 0 0 0 0 0 0 0 0 0 0 –Canada 1995 1 28 31 60 34 41 70 7 33 28 22 12 18 51 1.52000 5 34 45 46 41 32 79 4 33 40 30 25 12 66 1.32005 3 37 45 44 40 20 68 6 28 40 27 24 13 37 1.52010 3 30 28 36 32 25 62 0 1 28 24 16 10 19 44 0 1.52011 2 34 36 31 40 33 70 0 3 23 29 28 14 9 55 0 1.5Cayman Islands 1995 –2000 0 0 3 1 0 1 0 –2005 –2010 0 0 0 1 0 0 0 0 0 0 0 0 1 0 0 0 1.02011 0 0 0 0 0 1 0 0 0 0 0 0 0 0 0 0 –Chile 1995 24 148 182 204 155 141 163 24 100 120 108 75 73 107 1.72000 6 81 160 198 150 132 126 10 66 96 70 54 58 83 2.02005 3 74 128 179 162 115 133 4 55 78 60 56 36 93 2.12010 2 90 115 144 159 122 157 0 6 56 76 59 56 40 72 0 2.22011 4 88 139 143 164 127 134 0 6 62 75 66 69 48 71 0 2.0Colombia 1995 –2000 246 763 1 030 963 743 610 746 194 587 758 523 381 304 510 1.62005 178 623 685 666 687 510 695 179 581 533 457 389 292 395 1.42010 148 602 765 540 710 610 814 0 146 560 576 428 374 284 471 0 1.52011 105 663 714 558 702 594 753 0 98 461 535 324 337 278 390 0 1.7Costa Rica 1995 1 17 38 24 19 23 22 2 17 15 11 7 9 14 1.92000 14 31 53 62 39 28 49 13 21 33 24 20 23 24 1.72005 1 43 38 53 34 20 34 1 21 31 18 16 6 14 2.12010 2 18 48 33 27 22 28 1 0 18 20 12 14 15 8 1 2.02011 0 23 24 29 33 22 36 0 2 18 27 23 19 12 17 0 1.4Cuba 1995 2 59 118 83 75 75 156 1 17 52 29 39 48 80 2.12000 0 71 167 90 74 55 75 2 9 22 26 22 23 39 3.72005 2 20 73 90 50 58 51 2 14 17 26 13 22 29 2.82010 3 17 61 89 78 53 57 0 1 15 15 14 16 17 26 0 3.42011 2 14 51 83 86 50 48 0 1 6 18 18 17 17 26 0 3.2Curaçao 2010 0 0 0 2 1 0 0 0 0 1 1 0 0 0 0 0 1.52011 0 0 0 0 0 0 0 0 0 0 0 0 0 0 –Dominica 1995 –2000 –2005 –2010 0 0 0 0 0 3 1 0 0 0 0 1 2 1 0 0 1.02011 0 0 2 0 0 0 0 0 0 0 0 0 0 0 0 –Dominican 1995 –Republic 2000 73 410 481 344 173 125 113 65 317 325 212 115 79 75 1.42005 43 399 483 386 228 123 105 57 339 332 209 119 72 54 1.52010 29 276 346 292 170 112 85 0 43 239 207 142 102 54 62 0 1.52011 20 333 406 318 200 133 112 0 30 242 274 159 103 66 58 0 1.6Ecuador 1995 –2000 –2005 48 446 468 308 237 150 159 48 329 305 199 139 85 127 1.52010 32 499 529 314 309 227 246 52 298 308 178 158 113 110 1.82011 45 481 547 364 323 272 232 49 340 311 177 141 118 121 1.8El Salvador 1995 –2000 13 99 124 114 92 62 107 28 81 76 63 63 39 47 1.52005 5 97 140 128 104 74 117 6 85 82 59 50 42 70 1.72010 5 101 170 96 77 62 101 0 6 63 65 49 58 51 68 0 1.72011 3 114 183 106 96 77 115 0 6 61 61 44 52 69 92 0 1.8Grenada 1995 –2000 –2005 –2010 1 1 1 1 3.02011 0 0 0 0 1 0 0 0 0 0 0 0 0 0 0 0 –192 Data can be downloaded from www.who.int/tb/data GLOBAL TUBERCULOSIS REPORT 2012
MALEFEMALEYEAR 0–14 15–24 25–34 35–44 45–54 55–64 65+0–14 15–24 25–34 35–44 45–54 55–64 65+UN-KNOWNUN-KNOWNMALE:FEMALERATIOGuatemala 1995 51 235 280 236 165 142 139 51 224 255 221 146 129 94 1.12000 36 220 236 216 177 112 140 41 199 167 175 135 87 111 1.22005 39 251 258 185 187 127 115 38 339 245 277 176 88 95 0.922010 60 187 245 207 172 143 165 29 194 190 179 139 108 103 1.32011 18 197 205 172 162 136 152 25 186 192 154 154 102 106 1.1Guyana 1995 7 8 5 6 9 6 7 3 5 7 6 5 2 4 1.52000 4 20 19 14 7 6 9 1 11 8 7 5 5 3 2.02005 12 48 130 116 81 41 20 14 41 62 41 30 11 9 2.22010 2 32 38 65 49 22 13 0 2 22 25 19 20 10 6 0 2.12011 8 26 54 61 54 19 13 0 2 17 19 17 17 7 9 0 2.7Haiti 1995 –2000 67 836 898 613 350 147 118 96 914 857 513 275 132 71 1.12005 69 1 045 1 035 701 451 222 156 116 1 097 1 099 633 414 170 132 1.02010 98 1 225 1 357 718 469 259 160 0 158 1 268 1 223 608 358 207 134 0 1.12011 102 1 155 1 342 670 442 206 132 0 148 1 282 1 250 595 363 196 128 0 1.0Honduras 1995 42 280 540 204 130 236 58 54 208 292 134 76 136 48 1.62000 30 123 371 246 277 214 43 25 21 269 258 270 160 38 1.32005 13 238 280 215 152 134 152 27 219 222 125 107 81 104 1.32010 15 177 246 207 165 113 157 0 28 186 163 106 103 69 107 0 1.42011 17 194 291 227 184 120 184 0 19 181 194 138 99 98 126 0 1.4Jamaica 1995 2 9 14 9 11 8 9 2 7 6 5 5 2 2 2.12000 0 6 13 13 15 6 5 1 8 8 7 2 5 1 1.82005 0 4 6 6 10 6 7 0 1 5 4 0 1 3 2.82010 1 7 15 15 8 6 7 0 0 5 4 5 1 0 2 0 3.52011 0 2 6 3 4 4 3 0 1 3 4 0 3 1 1 0 1.7Mexico 1995 –2000 214 1 079 1 387 1 162 1 235 972 1 126 176 663 828 698 832 595 709 1.62005 100 1 095 1 376 1 314 1 238 1 042 1 288 125 771 733 710 784 637 784 1.62010 125 1 081 1 375 1 380 1 392 1 119 1 303 0 112 791 763 730 852 713 836 0 1.62011 128 1 124 1 440 1 503 1 532 1 112 1 299 0 136 776 765 698 889 734 824 0 1.7Montserrat 1995 –2000 –2005 1 –2010 0 0 0 0 0 0 0 0 0 0 0 0 0 0 0 0 –2011 0 0 0 0 0 0 0 0 0 0 0 0 0 0 0 0 –Netherlands 1995 –Antilles 2000 0 0 1 2 0 0 0 0 0 1 0 0 1 0 1.52005 –Nicaragua 1995 23 178 172 175 126 96 92 24 176 215 98 83 64 46 1.22000 18 194 174 147 108 64 90 34 188 173 98 76 46 61 1.22005 17 163 159 116 106 61 79 23 135 122 103 61 54 47 1.32010 22 157 189 141 115 82 108 0 27 154 149 92 75 50 79 0 1.32011 10 273 235 156 108 61 94 0 4 61 145 161 108 64 72 0 1.5Panama 1995 86 155 193 112 126 42 83 72 120 111 75 57 16 40 1.62000 3 44 78 61 37 27 26 6 43 34 35 19 12 16 1.72005 5 76 129 129 84 57 49 11 73 81 62 33 30 41 1.62010 6 69 127 80 62 61 49 0 7 51 52 46 45 23 29 0 1.82011 10 96 104 91 99 63 47 0 11 55 64 58 44 40 48 0 1.6Paraguay 1995 18 64 71 96 74 57 61 13 65 49 46 35 34 53 1.52000 16 112 103 105 86 80 71 12 69 86 41 41 30 46 1.82005 23 168 185 136 117 87 99 31 89 98 69 52 29 71 1.92010 18 163 244 129 143 103 99 11 18 106 99 39 50 46 45 5 2.22011 9 182 238 135 151 124 103 6 14 110 103 55 39 36 62 4 2.2Peru 1995 147 1 311 849 454 322 200 216 149 1 005 660 373 259 162 152 1.32000 552 5 290 2 875 1 546 1 041 801 796 633 3 686 2 472 1 156 609 499 624 1.32005 371 3 802 2 670 1 513 1 075 641 708 375 2 674 2 111 1 046 699 333 472 1.42010 –2011 –Puerto Rico 1995 4 3 12 20 15 9 19 1 2 6 5 7 4 9 2.42000 0 1 4 19 9 10 14 1 4 5 3 7 1 3 2.42005 0 4 4 7 9 7 7 0 3 2 5 4 1 7 1.72010 0 0 3 2 4 5 8 0 0 1 0 2 6 2 4 0 1.52011 0 1 4 3 6 6 2 0 0 1 1 1 0 3 1 0 3.1Saint Kitts and 1995 –Nevis 2000 –2005 –2010 0 0 0 0 1 0 0 0 0 0 0 1 0 0 0 0 1.02011 0 0 0 0 0 1 0 0 0 0 0 0 0 0 0 0 –Saint Lucia 1995 –2000 0 0 0 1 0 1 2 0 1 0 1 0 1 0 1.32005 0 0 0 0 2 1 2 1 1 0 1 1 0 2 0.832010 0 0 1 2 0 1 2 0 0 0 0 1 0 1 1 0 2.02011 0 0 1 1 0 3 2 0 0 0 0 0 0 0 0 0 –Saint Vincent and 1995 –the Grenadines 2000 0 1 0 4 2 0 1 1 0 0 0 0 0 0 8.02005 0 0 0 2 1 0 2 0 0 1 0 1 0 0 2.52010 0 0 1 0 3 0 2 0 0 0 1 0 0 1 0 0 3.02011 0 0 2 2 2 0 0 0 0 0 1 0 1 0 0 0 3.0Sint Maarten 2010 1 2 0.50(Dutch part) 2011 1 1 1.0Suriname 1995 –2000 1 6 6 3 2 0 4 2 3 6 3 0 1 1 1.42005 0 7 8 12 6 3 4 0 3 2 1 2 1 2 3.62010 0 5 21 35 19 5 10 0 1 4 6 10 6 2 8 0 2.62011 0 4 7 15 18 3 5 0 0 1 1 5 2 2 1 0 4.3Trinidad and 1995 2 6 15 10 12 7 4 0 6 4 2 5 3 0 2.8Tobago 2000 0 7 18 27 17 7 7 0 5 7 9 5 2 4 2.62005 0 10 11 13 21 10 3 0 4 9 3 5 4 3 2.42010 0 11 21 17 32 20 8 0 0 4 7 7 5 2 2 0 4.02011 1 14 27 13 15 16 7 0 1 6 7 3 4 2 5 0 3.3Turks and Caicos 1995 –Islands 2000 –2005 –2010 0 0 0 1 0 0 0 0 0 0 0 1 1 0 0 0 0.502011 0 2 3 2 0 1 0 0 0 0 0 0 0 0 0 0 –United States 1995 19 355 876 1 417 1 121 742 1 099 26 280 579 499 285 202 591 2.3of America 2000 6 365 602 906 904 577 738 14 246 376 349 253 152 396 2.32005 14 383 535 666 767 499 624 11 241 348 276 242 161 322 2.22010 5 246 360 371 505 403 466 2 9 195 265 183 165 130 223 0 2.02011 12 235 403 374 557 434 486 0 15 160 254 199 150 138 269 1 2.1Uruguay 1995 4 28 40 35 49 38 50 2 21 26 18 12 9 17 2.32000 0 36 48 45 41 30 34 2 28 22 21 13 12 16 2.12005 1 42 48 39 45 34 36 1 33 30 17 9 8 12 2.22010 1 46 70 35 46 33 31 0 3 24 36 12 10 5 16 0 2.52011 0 58 93 55 45 36 37 0 1 29 55 19 12 11 16 0 2.3US Virgin Islands 1995 0 0 0 1 1 0 0 –2000 –2005 –2010 –2011 –Venezuela 1995 –(Bolivarian 2000 –Republic of) 2005 35 312 395 413 402 265 332 37 351 299 267 183 146 216 1.42010 22 320 376 333 391 253 288 26 269 306 188 145 147 188 1.62011 28 340 353 303 363 307 241 0 25 252 316 178 178 150 190 0 1.5REGION OF THE AMERICASGLOBAL TUBERCULOSIS REPORT 2012 Data can be downloaded from www.who.int/tb/data 193
SMEAR LABS % OF SMEARPER 100K LABS USINGPOPULATION LED aCULTURELABS PER 5MPOPULATIONLABORATORIESDST b LABSPER 5MPOPULATIONLPA c LABSPER 5MPOPULATIONNUMBER OFLABS USINGXPERT MTB/RIFSECOND-LINE DSTAVAILABLENRL dFREE THROUGH NTPTB DIAGNOSISFIRST-LINEDRUGSTB NOTIF.RIFAMPICINRATE PERUSED100 000THROUGHOUTHEALTH-CARETREATMENTWORKERSAnguilla – No No No No NoAntigua and Barbuda – yes Yes (all suspects) yes YesArgentina 1.7 0 12.6 2.1 0 0 In country yes Yes (all suspects) yes YesAruba – No yes Yes (all suspects) yes YesBahamas –Out ofcountryyes Yes (other criteria) yes YesBarbados –Out ofcountryyes Yes (all suspects) yes YesBelize 0.6 50 0 0 0 0Out ofcountryyes Yes (all suspects) yes YesBermuda –Out ofcountryyes Yes (all suspects) yes YesBoliviaOut of5.3 – 24.3 0.5 0.5(Plurinational State of)countryNo Yes (all suspects) yes YesBonaire, Saint EustatiusOut of–and Sabacountryyes Yes (all suspects) No YesBrazil 2.0 0 7.8 1.1 0 0 yes Yes (all suspects) yes YesBritish Virgin Islands –Out ofcountryyes Yes (all suspects) No YesCanada –In and outof countryyes Yes (all suspects) yes NoCayman Islands –Out ofcountryyes Yes (all suspects) yes YesChile 0.9 4 11.6 0.3 0.3 0 In country yes Yes (all suspects) yes YesColombia 7.8 0 133.8 0.5 0.3 1 In country yes Yes (all suspects) yes YesCosta Rica 2.3 0 21.2 1.1 0 2Out ofcountryyes Yes (all suspects) yes YesCuba – In country yes Yes (all suspects) yes YesCuraçao – yes Yes (all suspects) No YesDominica –Out ofcountryyes Yes (all suspects) yes YesDominican Republic 2.3 1 5.5 0.5 0 0 In country yes Yes (all suspects) yes YesEcuador 2.2 0 5.8 0.3 0 5 In country yes Yes (all suspects) yes YesEl Salvador 3.3 0 17.7 0.8 0 0 No yes Yes (all suspects) yes Yes 122Grenada –Out ofcountryNo Yes (all suspects) yes YesGuatemala 1.8 0 4.1 1 0 0Out ofcountryyes Yes (all suspects) yes Yes 143Guyana 2.6 100 6.6 6.6 6.6 0In and outof countryyes Yes (all suspects) yes YesHaiti 2.2 7 1.0 1 1 1Out ofcountryyes Yes (all suspects) yes YesHonduras 2.1 0 3.2 0.6 0 0 yes Yes (all suspects) yes Yes 95Jamaica 0.1 0 1.8 0 0 0Out ofcountryyes Yes (all suspects) yes Yes 21Mexico 0.6 0 2.8 0.7
EASTERN MEDITERRANEAN REGIONTable A4.1 Estimates of the burden of disease caused by TB, 1990–2011 197Table A4.2 Incidence, notifi cation and case detection rates, all forms, 1990–2011 199Table A4.3 Case notifi cations, 1990–2011 201Table A4.4 Treatment outcomes, new smear-positive cases, 1995–2010 203Table A4.5 Treatment outcomes, retreatment cases, 1995–2010 205Table A4.6 HIV testing and provision of CPT, ART and IPT, 2005–2011 207Table A4.7 Testing for MDR-TB and number of confi rmed cases of MDR-TB, 2005–2011 208Table A4.8 New smear-positive case notifi cation by age and sex, 1995–2011 209Table A4.9 Laboratories, NTP services, drug management and infection control, 2011 210
Estimates of mortality, prevalence and incidenceEstimated values are shown as best estimates followed by lower and upper bounds. The lower and upper bounds aredefined as the 2.5th and 97.5th centiles of outcome distributions produced in simulations. See Annex 1 for furtherdetails.Estimated numbers are shown rounded to two significant figures. Estimated rates are shown rounded to three significantfigures unless the value is under 100, in which case rates are shown rounded to two significant figures. Blank cellsindicate that estimates are not available.Estimates for all years are recalculated as new information becomes available and techniques are refined, so they maydiffer from those published in previous reports in this series. Estimates published in previous global TB control reportsshould no longer be used.Data sourceData shown in this annex are taken from the WHO global TB database on 25 September 2012. Data shown in the mainpart of the report were taken from the database in July 2012. As a result, data in this annex may differ slightly fromthose in the main part of the report.Data can be downloaded from www.who.int/tb/data.196 Data can be downloaded from www.who.int/tb/data GLOBAL TUBERCULOSIS REPORT 2012
MORTALITY (EXCLUDING HIV) PREVALENCE (INCLUDING HIV) INCIDENCE (INCLUDING HIV)YEARPOPULATION(MILLIONS)NUMBER(THOUSANDS)RATE aNUMBER(THOUSANDS)RATE aNUMBER(THOUSANDS)Afghanistan 1990 13 4.3 (1.3–9.1) 33 (10–70) 42 (14–86) 326 (108–660) 25 (15–36) 189 (117–279)1995 20 11 (4.0–20) 53 (20–103) 86 (38–150) 434 (194–769) 37 (31–45) 189 (155–227)2000 23 12 (4.6–23) 53 (20–102) 99 (44–180) 433 (193–767) 43 (35–52) 189 (155–227)2005 28 11 (4.7–21) 41 (17–75) 100 (48–170) 361 (173–618) 52 (43–63) 189 (155–227)2009 31 12 (4.9–21) 38 (16–69) 110 (51–180) 345 (167–586) 58 (48–69) 189 (155–226)2010 31 12 (5.1–22) 38 (16–69) 110 (53–190) 346 (167–589) 59 (49–71) 189 (156–225)2011 32 13 (5.3–23) 39 (16–71) 110 (55–190) 351 (169–597) 61 (51–73) 189 (156–225)Bahrain 1990 < 1 0.017 (0.015–0.019) 3.4 (3.1–3.8) 0.22 (0.088–0.420) 46 (18–86) 0.18 (0.150–0.200) 36 (31–40)1995 < 1 0.013 (0.012–0.015) 2.3 (2.1–2.6) 0.1 (0.039–0.190) 18 (7.0–34) 0.078 (0.068–0.088) 14 (12–16)2000 < 1 0.012 (0.010–0.014) 1.8 (1.6–2.1) 0.24 (0.094–0.460) 38 (15–71) 0.19 (0.170–0.210) 30 (26–33)2005 < 1
YEARPOPULATION(MILLIONS)MORTALITY (EXCLUDING HIV) PREVALENCE (INCLUDING HIV) INCIDENCE (INCLUDING HIV)NUMBER(THOUSANDS)RATE aNUMBER(THOUSANDS)RATE aNUMBER(THOUSANDS)South Sudan 2011 10 3 (1.3–5.5) 29 (12–53) 28 (13–47) 267 (129–455) 15 (12–18) 146 (121–174)Sudan 1990 26 12 (4.5–22) 44 (17–83) 96 (44–170) 362 (166–633) 45 (37–54) 170 (140–203)1995 30 9 (3.8–16) 30 (13–54) 83 (40–140) 275 (134–466) 47 (39–57) 158 (130–188)2000 34 9.2 (3.9–17) 27 (11–49) 85 (41–140) 248 (121–420) 49 (41–59) 144 (119–172)2005 38 8.9 (3.8–16) 23 (10–42) 85 (41–140) 220 (108–372) 51 (42–61) 133 (110–158)2009 42 9.2 (3.9–17) 22 (9.3–39) 86 (42–150) 203 (100–343) 52 (43–61) 121 (100–145)2010 44 9.4 (4.0–17) 22 (9.2–39) 88 (43–150) 202 (99–341) 52 (43–62) 119 (98–142)2011 34 7.5 (3.2–14) 22 (9.2–40) 69 (34–120) 201 (98–339) 40 (33–48) 117 (96–139)Syrian Arab 1990 12 0.9 (0.240–2.0) 7.3 (2.0–16) 10 (3.4–21) 85 (27–174) 7.5 (5.3–10) 61 (43–82)Republic 1995 14 0.81 (0.330–1.5) 5.7 (2.3–11) 9.1 (3.7–17) 64 (26–118) 6.5 (5.3–7.8) 46 (38–55)2000 16 0.5 (0.170–1.0) 3.1 (1.1–6.3) 6.7 (2.2–14) 42 (14–85) 5.6 (4.8–6.4) 35 (30–40)2005 18 0.47 (0.170–0.930) 2.6 (0.92–5.1) 6.1 (2.2–12) 33 (12–65) 4.9 (4.1–5.7) 26 (22–31)2009 20 0.42 (0.140–0.850) 2.1 (0.71–4.2) 5.3 (1.9–11) 27 (9.3–53) 4.2 (3.5–5.0) 21 (17–25)2010 20 0.4 (0.140–0.800) 2 (0.66–3.9) 5.1 (1.8–10) 25 (8.6–49) 4.1 (3.4–4.8) 20 (16–24)2011 21 0.38 (0.120–0.770) 1.8 (0.59–3.7) 4.8 (1.7–9.7) 23 (8.0–47) 3.9 (3.2–4.6) 19 (16–22)Tunisia 1990 8 0.24 (0.100–0.430) 2.9 (1.2–5.2) 2.9 (1.2–5.5) 36 (14–67) 2.3 (2.1–2.7) 29 (25–32)1995 9 0.28 (0.120–0.500) 3.1 (1.3–5.6) 3.4 (1.4–6.4) 38 (15–72) 2.7 (2.4–3.1) 31 (27–35)2000 9 0.24 (0.100–0.430) 2.5 (1.1–4.6) 3 (1.2–5.6) 31 (12–59) 2.4 (2.1–2.7) 25 (22–28)2005 10 0.24 (0.100–0.430) 2.4 (1.0–4.3) 2.9 (1.2–5.5) 30 (12–56) 2.3 (2.0–2.6) 23 (21–27)2009 10 0.28 (0.120–0.510) 2.7 (1.2–5.0) 3.5 (1.4–6.6) 34 (13–64) 2.8 (2.4–3.1) 27 (23–30)2010 10 0.3 (0.130–0.550) 2.9 (1.2–5.2) 3.7 (1.5–7.0) 36 (14–67) 3 (2.6–3.3) 28 (25–32)2011 11 0.33 (0.140–0.590) 3.1 (1.3–5.6) 4 (1.6–7.6) 38 (15–71) 3.2 (2.8–3.6) 30 (26–34)United Arab 1990 2 0.01 (
INCIDENCE (INCLUDING HIV) INCIDENCE HIV-POSITIVE NOTIFIED NEW AND RELAPSE CASE DETECTIONYEARPOPULATION(MILLIONS)NUMBER(THOUSANDS)RATE aNUMBER(THOUSANDS)RATE a NUMBER RATE a PERCENTAfghanistan 1990 13 25 (15–36) 189 (117–279) 0.044 (0.027–0.065) 0.3 (0.21–0.50) 4 332 33 18 (12–28)1995 20 37 (31–45) 189 (155–227) 0.079 (0.043–0.120) 0.4 (0.22–0.63)2000 23 43 (35–52) 189 (155–227) 0.11 (0.061–0.170) 0.5 (0.27–0.75) 7 107 31 16 (14–20)2005 28 52 (43–63) 189 (155–227) 0.17 (0.096–0.260) 0.6 (0.35–0.93) 21 844 79 42 (35–51)2009 31 58 (48–69) 189 (155–226) 0.24 (0.140–0.370) 0.8 (0.47–1.2) 25 417 83 44 (37–53)2010 31 59 (49–71) 189 (156–225) 0.27 (0.160–0.410) 0.9 (0.51–1.3) 28 029 89 47 (40–57)2011 32 61 (51–73) 189 (156–225) 0.3 (0.180–0.450) 0.9 (0.56–1.4) 27 983 86 46 (38–55)Bahrain 1990 < 1 0.18 (0.150–0.200) 36 (31–40) 117 24 67 (59–76)1995 < 1 0.078 (0.068–0.088) 14 (12–16) 43 7.7 55 (49–63)2000 < 1 0.19 (0.170–0.210) 30 (26–33) 207 32 110 (97–130)2005 < 1 0.31 (0.270–0.350) 42 (37–48) 280 39 92 (81–100)2009 1 0.35 (0.310–0.400) 30 (26–34) 0.011 (
YEARPOPULATION(MILLIONS)INCIDENCE (INCLUDING HIV) INCIDENCE HIV-POSITIVE NOTIFIED NEW AND RELAPSE CASE DETECTIONNUMBER(THOUSANDS)RATE aNUMBER(THOUSANDS)RATE a NUMBER RATE a PERCENTSouth Sudan 2011 10 15 (12–18) 146 (121–174) 7 217 70 48 (40–58)Sudan 1990 26 45 (37–54) 170 (140–203) 1.7 (1.4–2.0) 6.4 (5.3–7.6) 212 0.8 0.47 (0.39–0.57)1995 30 47 (39–57) 158 (130–188) 2.4 (1.8–3.1) 7.9 (5.8–10) 14 320 48 30 (25–37)2000 34 49 (41–59) 144 (119–172) 3.2 (2.4–4.1) 9.3 (6.9–12) 24 807 73 50 (42–61)2005 38 51 (42–61) 133 (110–158) 3.7 (2.7–4.7) 9.5 (7.2–12) 27 562 72 54 (45–66)2009 42 52 (43–61) 121 (100–145) 3.7 (2.8–4.7) 8.7 (6.5–11) 26 001 61 50 (42–61)2010 44 52 (43–62) 119 (98–142) 3.7 (2.8–4.7) 8.5 (6.3–11) 26 131 60 50 (42–61)2011 34 40 (33–48) 117 (96–139) 2.8 (2.1–3.6) 8.2 (6.2–11) 19 348 56 48 (41–59)Syrian Arab 1990 12 7.5 (5.3–10) 61 (43–82) 6 018 49 81 (60–110)Republic 1995 14 6.5 (5.3–7.8) 46 (38–55) 4 404 31 68 (56–83)2000 16 5.6 (4.8–6.4) 35 (30–40) 5 090 32 92 (79–110)2005 18 4.9 (4.1–5.7) 26 (22–31) 4 310 23 89 (76–110)2009 20 4.2 (3.5–5.0) 21 (17–25) 4 050 20 96 (80–120)2010 20 4.1 (3.4–4.8) 20 (16–24) 3 666 18 90 (76–110)2011 21 3.9 (3.2–4.6) 19 (16–22) 3 395 16 87 (73–110)Tunisia 1990 8 2.3 (2.1–2.7) 29 (25–32) 0.096 (0.084–0.110) 1.2 (1.0–1.3) 2 054 25 88 (77–100)1995 9 2.7 (2.4–3.1) 31 (27–35) 0.082 (0.060–0.110) 0.9 (0.68–1.2) 2 383 27 87 (77–100)2000 9 2.4 (2.1–2.7) 25 (22–28) 0.053 (0.038–0.071) 0.6 (0.40–0.75) 2 038 22 87 (77–99)2005 10 2.3 (2.0–2.6) 23 (21–27) 0.047 (0.033–0.063) 0.5 (0.34–0.64) 2 079 21 90 (79–100)2009 10 2.8 (2.4–3.1) 27 (23–30) 0.057 (0.040–0.076) 0.6 (0.39–0.73) 2 155 21 78 (69–89)2010 10 3 (2.6–3.3) 28 (25–32) 0.061 (0.043–0.081) 0.6 (0.41–0.78) 2 368 23 80 (71–91)2011 11 3.2 (2.8–3.6) 30 (26–34) 0.066 (0.047–0.088) 0.6 (0.44–0.83) 3 015 28 95 (84–110)United Arab 1990 2 0.22 (0.160–0.290) 12 (8.7–16) 285 16 130 (100–180)Emirates 1995 2 0.28 (0.210–0.370) 12 (8.7–16)2000 3 0.36 (0.260–0.480) 12 (8.7–16) 115 3.8 32 (24–43)2005 4 0.1 (0.076–0.140) 2.6 (1.9–3.4) 103 2.5 99 (75–140)2009 7 0.2 (0.150–0.270) 2.9 (2.1–3.8) 116 1.7 57 (43–79)2010 8 0.24 (0.180–0.320) 3.2 (2.3–4.2) 0.011 (
NEW AND RELAPSENOTIFICATION RATE a1990–2011YEARNEW ANDRELAPSENEW CASESSMEAR- SMEAR-NEGATIVE/POSITIVE UNKNOWNEXTRA-RE-TREAT EXCL.OTHER RELAPSEPULMONARY RELAPSETOTALRETREATHISTORYUNKNOWN% SMEAR-POS AMONGNEW PULMAfghanistan 1990 4 332 –1995 –2000 7 107 2 892 2 358 1 620 237 237 552005 21 844 9 949 6 085 4 954 856 856 622009 25 417 12 497 6 108 5 730 1 082 208 1 290 733 672010 28 029 12 947 7 085 6 248 633 1 116 209 1 325 65• 33 86 • 2011 27 983 13 789 6 155 6 286 623 1 130 184 1 314 69Bahrain 1990 117 –1995 43 17 14 85 0 0 552000 207 23 16 8 592005 280 101 72 107 0 0 0 0 0 582009 326 131 74 121 0 0 0 0 0 642010 246 90 58 98 0 0 0 0 0 61• 24 17 • 2011 225 89 47 89 0 0 0 0 0 65Djibouti 1990 2 100 –1995 –2000 3 971 1 391 518 1 875 184 184 732005 3 109 1 120 739 1 058 0 192 61 253 0 602009 3 783 1 377 507 1 710 0 189 21 210 0 732010 4 172 1 181 538 2 253 0 200 19 219 0 69• 373 407 • 2011 3 686 1 336 569 1 587 0 194 37 231 0 70Egypt 1990 2 142 –1995 11 145 4 229 9 204 4 684 753 753 312000 10 762 4 606 2 693 2 843 620 620 632005 11 446 5 217 2 617 3 163 0 449 289 738 0 672009 9 685 5 201 1 238 2 850 0 396 352 748 0 812010 9 260 4 679 1 158 3 048 0 375 328 703 0 80• 4 11 • 2011 8 974 4 508 1 055 3 074 0 337 333 670 0 81Iran (Islamic 1990 9 255 –Republic of) 1995 15 936 5 347 6 432 3 779 477 477 452000 11 850 5 361 2 642 3 442 405 405 672005 9 192 4 581 1 807 2 530 274 154 428 20 722009 10 097 5 152 1 926 2 685 0 334 439 773 0 732010 10 362 5 188 1 985 2 869 0 320 440 760 0 72• 17 15 • 2011 10 980 5 539 1 980 3 076 0 385 515 900 0 74Iraq 1990 14 735 1 587 12 394 754 111995 9 697 3 194 13 962 1 367 68 68 192000 9 697 3 194 3 188 2 753 562 562 502005 9 454 3 096 2 887 2 703 768 768 522009 9 385 3 347 2 666 2 904 0 468 283 751 0 562010 9 707 3 618 2 693 3 009 0 387 390 777 0 57• 85 27 • 2011 8 837 3 059 2 463 2 957 0 358 411 769 0 55Jordan 1990 439 –1995 498 187 210 101 6 6 472000 306 89 69 145 3 3 562005 367 86 76 187 12 6 4 10 0 532009 367 109 64 190 0 4 16 20 4 632010 338 117 69 150 0 2 16 18 0 63• 13 5 • 2011 314 103 81 128 0 2 16 18 14 56Kuwait 1990 277 –1995 336 175 42 115 0 4 0 4 0 812000 513 180 89 244 0 0 0 0 0 672005 517 187 95 234 0 1 0 1 0 662009 933 386 155 391 0 1 0 1 0 712010 957 385 163 407 0 2 0 2 0 70• 13 24 • 2011 672 222 141 309 0 0 0 0 0 61Lebanon 1990 –1995 983 197 528 255 3 3 272000 571 202 149 214 6 6 582005 391 131 75 181 0 4 0 4 0 642009 499 179 94 218 0 8 2 10 0 662010 513 194 99 210 0 10 2 12 0 66• 0 12 • 2011 496 188 101 206 1 1 65Libyan Arab 1990 442 –Jamahiriya 1995 1 440 626 814 –2000 1 341 607 82 652 882005 2 098 860 474 762 2 269 271 642009 2 096 936 455 696 0 9 14 23 0 672010 –• 10 24 • 2011 1 518 731 305 462 0 20 27 47 71Morocco 1990 27 658 –1995 29 829 14 171 4 095 11 563 782000 28 852 12 872 2 934 13 046 812005 26 269 12 757 2 142 11 370 0 862009 27 348 11 907 2 021 12 131 0 1 289 316 1 605 0 852010 28 359 12 239 2 174 12 730 0 1 216 429 1 645 0 85• 112 89 • 2011 28 640 11 822 2 272 13 331 0 1 215 1 130 2 345 0 84Oman 1990 482 –1995 276 135 60 81 0 0 692000 321 164 37 112 8 8 822005 261 131 37 89 4 4 782009 332 164 36 127 0 5 2 7 0 822010 308 152 28 124 0 4 5 9 0 84• 26 12 • 2011 337 180 32 122 0 3 0 3 0 85Pakistan 1990 156 759 –1995 13 142 2 578 3 806 3 037 184 184 402000 11 050 3 285 5 578 1 846 341 341 372005 142 017 48 220 68 337 22 789 2 671 2 754 5 425 412009 264 248 101 887 112 948 43 416 5 997 3 203 9 200 472010 261 199 104 263 105 623 45 443 0 5 870 5 055 10 925 3 036 50• 140 148 • 2011 261 041 105 733 103 824 45 537 0 5 947 5 460 11 407 3 893 50Qatar 1990 184 –1995 304 60 135 109 1 1 312000 279 53 98 128 0 0 352005 325 96 73 156 0 0 0 572009 619 220 102 297 0 0 0 0 0 682010 580 223 101 256 0 0 0 0 0 69• 39 30 • 2011 553 197 120 236 0 62Saudi Arabia 1990 2 415 –1995 –2000 3 452 1 595 722 1 023 112 112 692005 3 539 1 722 545 1 067 0 205 205 762009 4 043 2 201 578 1 170 94 50 144 792010 4 422 2 302 687 1 311 0 122 84 206 43 77• 15 14 • 2011 3 932 2 055 586 1 227 64 83 147 78EASTERN MEDITERRANEAN REGIONaRates are per 100 000 population.GLOBAL TUBERCULOSIS REPORT 2012 Data can be downloaded from www.who.int/tb/data 201
NEW AND RELAPSENOTIFICATION RATE a1990–2011YEARNEW ANDRELAPSENEW CASESSMEAR- SMEAR-NEGATIVE/POSITIVE UNKNOWNEXTRA-RE-TREAT EXCL.OTHER RELAPSEPULMONARY RELAPSETOTALRETREATHISTORYUNKNOWN% SMEAR-POS AMONGNEW PULMSomalia 1990 –1995 2 504 1 572 692 318 134 134 692000 5 686 3 776 837 722 351 351 822005 12 904 7 068 3 168 2 258 0 410 102 512 0 692009 11 075 6 047 2 604 1 965 0 459 196 655 0 702010 10 139 5 225 2 654 1 885 0 375 330 705 0 66• 0 122 • 2011 11 653 5 884 3 159 2 261 0 349 368 717 0 65South Sudan 2011 7 217 2 797 2 610 1 639 171 366 537 52Sudan 1990 212 –1995 14 320 8 761 2 655 1 675 474 474 772000 24 807 12 311 6 512 3 843 2 141 2 141 652005 27 562 12 730 9 212 5 434 0 186 1 616 1 802 582009 26 001 10 541 8 897 5 530 76 957 1 036 1 993 542010 26 131 9 958 9 144 6 217 812 1 110 1 922 52• 1 56 • 2011 19 348 7 266 6 746 4 624 0 712 1 037 1 749 0 52Syrian Arab 1990 6 018 –Republic 1995 4 404 1 295 1 507 1 574 28 28 462000 5 090 1 584 1 409 2 000 97 97 532005 4 310 1 350 796 2 103 0 61 83 144 632009 4 050 1 143 796 2 036 0 75 101 176 0 592010 3 666 1 122 544 1 948 0 52 161 213 0 67• 49 16 • 2011 3 395 1 027 393 1 915 0 60 55 115 225 72Tunisia 1990 2 054 –1995 2 383 1 243 407 733 752000 2 038 1 099 179 727 61 61 862005 2 079 915 239 874 51 51 792009 2 155 931 232 950 42 42 802010 2 368 1 091 151 1 090 36 36 88• 25 28 • 2011 3 015 1 031 317 1 616 51 51 76United Arab 1990 285 –Emirates 1995 –2000 115 73 3 41 0 0 962005 103 62 12 25 0 4 2 6 0 842009 116 71 15 30 0 0 0 0 0 832010 131 56 28 47 0 0 1 1 0 67• 16 1 • 2011 103 46 27 30 0 0 3 3 0 63West Bank 1990 64 –and Gaza Strip 1995 77 9 58 10 132000 82 37 1002005 28 7 6 15 542009 35 10 9 15 0 1 1 2 0 532010 31 13 6 12 0 0 0 0 0 68• 3 1 • 2011 32 11 5 13 0 3 0 3 0 69Yemen 1990 4 650 –1995 14 428 3 681 7 390 3 082 275 275 332000 13 651 5 565 4 176 3 470 440 440 572005 9 063 3 379 2 780 2 553 351 351 552009 8 562 3 576 2 108 2 564 0 314 0 314 0 632010 8 916 3 584 2 313 2 715 0 304 134 438 0 61• 39 35 • 2011 8 636 3 135 2 400 2 880 0 221 77 298 0 57aRates are per 100 000 population.202 Data can be downloaded from www.who.int/tb/data GLOBAL TUBERCULOSIS REPORT 2012
% OF COHORTTREATMENT SUCCESS (%) a1995–2010YEARNUMBERNOTIFIEDSIZE OFCOHORTCOHORT AS% NOTIFIEDCURED COMPLETED DIED FAILED DEFAULTEDNOTEVALUATEDAfghanistan 1995 –2000 2 892 3 136 108 76 9 3 3 6 22005 9 949 10 013 101 83 7 2 1 2 52008 13 136 13 136 100 83 5 2 1 2 72009 12 497 12 497 100 83 4 2 1 2 9• 0 90 • 2010 12 947 12 947 100 86 3 2 1 2 5Bahrain 1995 17 –2000 23 22 96 73 0 27 0 0 02005 101 15 15 93 0 7 0 0 02008 141 142 101 8 0 1 0 0 902009 131 192 147 98 0 2 0 0 0• 0 96 • 2010 90 162 180 96 0 4 0 0 0Djibouti 1995 1 751 – 60 16 3 1 20 12000 1 391 1 391 100 48 14 2 1 21 142005 1 120 1 120 100 71 9 1 1 16 22008 1 375 1 375 100 78 6 1 0 13 22009 1 377 1 277 93 72 7 1 1 17 3• 75 80 • 2010 1 181 1 177 100 68 12 1 1 16 2Egypt 1995 4 229 2 118 50 38 24 2 3 19 142000 4 606 4 611 100 75 12 3 2 5 32005 5 217 5 154 99 66 13 3 2 3 132008 5 102 5 101 100 69 20 3 3 3 32009 5 201 5 201 100 72 16 3 2 4 3• 62 86 • 2010 4 679 4 682 100 59 27 3 3 4 4Iran (Islamic 1995 5 347 –Republic of) 2000 5 361 5 866 109 81 4 6 2 3 32005 4 581 4 581 100 78 5 7 3 3 42008 4 722 4 824 102 78 6 8 3 2 32009 5 152 5 201 101 77 6 7 3 2 5• 0 83 • 2010 5 188 5 269 102 77 6 7 4 3 3Iraq 1995 3 194 11 553 362 60 20 0 5 10 52000 3 194 3 194 100 86 5 3 2 3 12005 3 096 3 096 100 76 10 3 2 7 32008 3 150 3 150 100 79 9 3 2 6 12009 3 347 3 347 100 80 10 2 1 6 1• 80 89 • 2010 3 618 3 618 100 80 9 3 1 6 1Jordan 1995 187 193 103 91 1 3 1 2 32000 89 89 100 89 1 2 1 4 22005 86 86 100 71 12 5 7 6 02008 104 104 100 73 11 3 1 4 92009 109 109 100 54 21 6 7 11 0• 92 87 • 2010 117 117 100 57 30 1 3 6 3Kuwait 1995 175 175 100 40 31 3 0 1 252000 180 180 100 54 15 1 0 9 212005 187 187 100 53 10 1 0 7 292008 345 345 100 43 37 0 0 7 122009 386 386 100 41 44 0 0 4 11• 71 87 • 2010 385 385 100 63 24 0 0 3 9Lebanon 1995 197 200 102 35 56 0 0 10 02000 202 190 94 89 3 4 1 3 12005 131 131 100 81 11 2 1 6 02008 158 158 100 63 13 3 1 2 182009 179 179 100 65 17 6 1 2 10• 91 80 • 2010 194 192 99 68 12 2 1 18 0Libyan Arab 1995 626 – 65 0 1 1 33 0Jamahiriya 2000 607 –2005 860 860 100 40 29 2 0 27 22008 871 872 100 52 17 3 1 24 42009 936 –• 65 64 • 2010 792 – 43 21 2 0 31 3Morocco 1995 14 171 14 171 100 75 14 2 1 7 12000 12 872 12 872 100 82 7 3 1 7 12005 12 757 12 683 99 76 5 2 1 9 72008 11 825 11 956 101 79 7 2 1 10 12009 11 907 11 935 100 77 8 2 2 9 2• 90 85 • 2010 12 239 12 492 102 77 8 2 1 9 2Oman 1995 135 93 69 84 0 9 1 1 52000 164 112 68 93 0 4 3 0 02005 131 104 79 90 10 02008 171 171 100 96 2 2 0 0 02009 164 334 204 49 49 2 0 0 0• 84 97 • 2010 152 152 100 97 0 3 0 0 0Pakistan 1995 2 578 802 31 51 20 4 1 20 42000 3 285 4 074 124 58 16 4 1 17 42005 48 220 48 205 100 71 13 3 1 9 42008 100 102 100 103 100 74 16 2 1 5 32009 101 887 101 809 100 74 17 2 1 4 2• 70 91 • 2010 104 263 104 434 100 75 16 2 1 4 2Qatar 1995 60 43 72 81 0 5 0 0 142000 53 53 100 66 0 8 0 0 262005 96 96 100 74 9 1 0 0 162008 201 201 100 60 13 1 0 0 262009 220 5 2 80 0 0 0 20 0• 81 67 • 2010 223 219 98 63 3 0 0 0 33Saudi Arabia 1995 –2000 1 595 1 285 81 62 11 7 0 13 62005 1 722 1 722 100 60 5 7 1 10 172008 2 108 2 104 100 54 6 6 2 8 242009 2 201 2 201 100 54 11 6 1 10 18• 0 62 • 2010 2 302 2 302 100 52 10 5 1 14 18Somalia 1995 1 572 1 278 81 82 4 4 5 5 02000 3 776 3 776 100 81 2 4 2 3 92005 7 068 7 059 100 85 4 4 1 4 22008 6 520 6 520 100 78 3 3 2 3 112009 6 047 6 047 100 83 2 4 2 3 7• 86 89 • 2010 5 225 5 225 100 87 2 3 2 3 4South Sudan 2010 2 114 – 67 8 5 1 15 3Sudan 1995 8 761 8 326 95 44 35 2 7 11 12000 12 311 14 599 119 50 25 4 2 9 112005 12 730 12 730 100 64 18 3 1 9 52008 10 800 10 766 100 62 20 3 1 10 52009 10 541 10 883 103 62 19 3 1 10 6• 79 80 • 2010 9 958 7 729 78 56 24 2 1 12 5EASTERN MEDITERRANEAN REGIONa TREATMENT SUCCESS = percent cured + percent completed then rounded to the nearest digit.GLOBAL TUBERCULOSIS REPORT 2012 Data can be downloaded from www.who.int/tb/data 203
TREATMENT SUCCESS (%) a1995–2010YEARNUMBERNOTIFIEDSIZE OFCOHORTCOHORT AS% NOTIFIED% OF COHORTCURED COMPLETED DIED FAILED DEFAULTEDNOTEVALUATEDSyrian Arab 1995 1 295 1 295 100 45 16 2 9 24 5Republic 2000 1 584 1 562 99 69 10 4 3 11 42005 1 350 1 350 100 76 13 3 2 6 12008 1 116 1 115 100 86 3 2 6 22009 1 143 1 144 100 76 12 4 1 4 3• 61 89 • 2010 1 122 1 122 100 75 14 3 2 4 2Tunisia 1995 1 243 –2000 1 099 1 099 100 87 4 3 2 2 22005 915 910 99 83 7 2 1 2 42008 1 005 967 96 76 10 3 1 2 82009 931 931 100 72 11 3 2 3 9• 0 85 • 2010 1 091 1 091 100 62 24 3 1 4 6United Arab 1995 –Emirates 2000 73 73 100 56 18 7 4 5 102005 62 62 100 42 31 6 0 15 62008 50 53 106 25 43 9 0 23 02009 71 71 100 21 52 11 1 14 0• 0 69 • 2010 56 55 98 24 45 7 0 24 0West Bank 1995 9 13 144 100 0and Gaza Strip 2000 37 –2005 7 12 171 58 42 0 0 0 02008 16 16 100 38 56 0 0 6 02009 10 11 110 18 64 9 0 9 0• 100 83 • 2010 13 12 92 8 75 0 17 0 0Yemen 1995 3 681 3 681 100 43 9 1 1 35 112000 5 565 5 565 100 59 13 3 1 14 102005 3 379 3 566 106 69 11 3 1 6 102008 3 540 3 540 100 75 9 3 1 5 72009 3 576 3 557 99 79 9 3 1 4 4• 52 87 • 2010 3 584 3 584 100 77 9 3 1 4 7a TREATMENT SUCCESS = percent cured + percent completed then rounded to the nearest digit.204 Data can be downloaded from www.who.int/tb/data GLOBAL TUBERCULOSIS REPORT 2012
% OF COHORTTREATMENT SUCCESS (%) a1995–2010YEARNUMBERNOTIFIEDSIZE OFCOHORTCOHORT AS% NOTIFIEDCURED COMPLETED DIED FAILED DEFAULTEDNOTEVALUATEDAfghanistan 1995 –2000 237 304 128 73 5 4 4 11 32005 856 856 100 87 2 3 1 2 52008 1 135 –2009 1 290 –• 0 79 • 2010 1 325 1 325 100 73 6 3 3 1 14Bahrain 1995 0 –2000 –2005 0 –2008 0 0 –2009 0 0 –• 0 0 • 2010 0 0 –Djibouti 1995 –2000 184 268 146 27 9 0 3 22 372005 253 253 100 58 10 3 2 24 22008 196 196 100 66 9 3 2 14 62009 210 194 92 67 8 3 2 18 3• 0 70 • 2010 219 213 97 53 17 6 2 19 3Egypt 1995 753 –2000 620 956 154 52 11 7 12 13 52005 738 738 100 41 17 10 12 8 122008 792 779 98 39 32 8 8 9 42009 748 748 100 39 39 6 5 7 4• 0 72 • 2010 703 703 100 38 34 6 8 8 6Iran (Islamic 1995 477 –Republic of) 2000 405 606 150 63 13 6 5 6 72005 428 448 105 68 8 9 3 4 82008 423 692 164 57 15 8 4 5 112009 773 708 92 48 25 8 3 5 11• 0 69 • 2010 760 781 103 49 20 8 5 4 15Iraq 1995 68 –2000 562 –2005 768 953 124 60 12 4 8 12 42008 685 685 100 62 18 2 4 11 22009 751 751 100 57 27 3 3 9 1• 0 75 • 2010 777 777 100 36 40 4 5 13 3Jordan 1995 6 –2000 3 6 200 83 17 0 0 0 02005 10 –2008 1 12 1 200 8 67 0 8 17 02009 20 24 120 17 62 4 0 17 0• 0 60 • 2010 18 5 28 0 60 0 20 0 20Kuwait 1995 4 –2000 0 –2005 1 1 100 0 100 0 0 0 02008 1 1 100 0 100 0 0 0 02009 1 1 100 0 100 0 0 0 0• 0 100 • 2010 2 2 100 0 100 0 0 0 0Lebanon 1995 3 –2000 6 5 83 80 202005 4 4 100 75 25 0 0 0 02008 11 11 100 55 9 27 0 0 92009 10 10 100 60 20 0 0 0 20• 0 75 • 2010 12 12 100 58 17 8 0 17 0Libyan Arab 1995 –Jamahiriya 2000 –2005 271 –2008 32 – 6 31 0 0 62 02009 23 –• 0 33 • 2010 85 – 11 22 2 0 45 20Morocco 1995 1 469 – 65 12 4 4 10 72000 –2005 1 650 – 55 17 4 5 14 52008 1 646 1 535 93 65 8 4 5 18 12009 1 605 1 668 104 60 9 4 3 16 8• 76 64 • 2010 1 645 2 899 176 40 24 4 3 21 9Oman 1995 0 –2000 8 7 88 86 0 0 14 0 02005 4 –2008 4 4 100 50 50 0 0 0 02009 7 7 100 57 43 0 0 0 0• 0 100 • 2010 9 9 100 44 56 0 0 0 0Pakistan 1995 184 374 203 48 22 2 5 24 02000 341 907 266 37 17 6 3 29 82005 5 425 5 009 92 61 15 5 3 11 52008 7 983 7 685 96 62 17 5 3 10 42009 9 200 8 801 96 63 18 4 3 8 3• 70 84 • 2010 10 925 8 394 77 68 16 3 3 6 3Qatar 1995 1 3 300 67 0 0 0 0 332000 0 –2005 0 –2008 0 0 –2009 0 0 –• 67 0 • 2010 0 0 –Saudi Arabia 1995 –2000 112 139 124 43 15 7 3 13 192005 205 96 47 40 9 9 5 18 192008 145 141 97 34 10 5 4 16 312009 144 151 105 45 15 8 1 17 14• 0 50 • 2010 206 249 121 31 19 8 2 22 17Somalia 1995 134 –2000 351 351 100 53 1 5 5 3 342005 512 524 102 76 5 6 2 5 62008 621 621 100 48 4 5 2 3 382009 655 655 100 50 10 6 4 3 27• 0 62 • 2010 705 705 100 48 14 6 5 4 23South Sudan 2010 434 – 23 34 5 9 23 5Sudan 1995 474 –2000 2 141 –2005 1 802 1 828 101 53 29 3 1 9 62008 2 080 1 953 94 39 35 2 1 14 82009 1 993 2 147 108 33 38 3 1 15 10• 0 68 • 2010 1 922 1 517 79 28 40 2 1 14 16EASTERN MEDITERRANEAN REGIONa TREATMENT SUCCESS = percent cured + percent completed then rounded to the nearest digit.GLOBAL TUBERCULOSIS REPORT 2012 Data can be downloaded from www.who.int/tb/data 205
TREATMENT SUCCESS (%) a1995–2010YEARNUMBERNOTIFIEDSIZE OFCOHORTCOHORT AS% NOTIFIED% OF COHORTCURED COMPLETED DIED FAILED DEFAULTEDNOTEVALUATEDSyrian Arab 1995 28 –Republic 2000 97 189 195 44 10 4 20 15 72005 144 144 100 53 14 5 9 19 02008 267 266 100 26 51 5 5 12 32009 176 176 100 48 22 9 4 15 3• 0 81 • 2010 213 213 100 23 58 4 3 11 1Tunisia 1995 –2000 61 42 69 74 0 5 2 10 102005 51 –2008 38 –2009 42 –• 0 0 • 2010 36 –United Arab 1995 –Emirates 2000 0 –2005 6 5 83 80 0 0 0 20 02008 1 1 100 100 0 0 0 0 02009 0 0 –• 0 67 • 2010 1 3 300 0 67 33 0 0 0West Bank 1995 –and Gaza Strip 2000 –2005 0 –2008 1 0 02009 2 0 0• 0 0 • 2010 0 –Yemen 1995 275 14 5 29 14 21 14 14 72000 440 437 99 64 8 7 6 11 42005 351 351 100 48 9 2 3 7 302008 411 376 91 66 9 3 3 9 102009 314 291 93 70 7 3 4 7 9• 43 0 • 2010 438 –a TREATMENT SUCCESS = percent cured + percent completed then rounded to the nearest digit.206 Data can be downloaded from www.who.int/tb/data GLOBAL TUBERCULOSIS REPORT 2012
–% OF TB PATIENTS WITHKNOWN HIV STATUS2005–2011YEAR% OF TBPATIENTS WITHKNOWN HIVSTATUSNUMBER OF TBPATIENTS WITHKNOWN HIVSTATUSPATIENTSNOTIFIED(NEW ANDRETREAT)NUMBER OFHIV-POSITIVETB PATIENTS% OF TESTEDTB PATIENTSHIV-POSITIVE% OF HIV-POSITIVE TBPATIENTS ONCPT% OF HIV-POSITIVE TBPATIENTS ONARTNUMBER OFHIV-POSITIVEPEOPLEPROVIDED IPTAfghanistan 2005 21 8442009 4 1 175 26 358 5 0 100 1002010 18 5 170 28 238 2 0 100 100– 23 • 2011 23 6 445 28 167 5 0 80 80Bahrain 2005 46 128 280 6 5 0 02009 79 256 326 8 3 0 122010 65 161 246 6 4 0 0• 46 69 • 2011 69 155 225 7 5 0 43Djibouti 2005 7 224 3 170 135 60 15 15 02009 55 2 091 3 804 207 10 0 232010 52 2 163 4 191 248 11 0 11• 7 34 • 2011 34 1 274 3 723 177 14Egypt 2005 11 7352009 32 3 204 10 037 11 0 100 100 12010 47 4 483 9 588 7 0 100 100 0– 37 • 2011 37 3 441 9 307 12 0 100 100Iran (Islamic 2005 9 366Republic of) 2009 7 700 10 536 223 32 13 21 4182010 8 904 10 802 254 28 16 28 161– 11 • 2011 11 1 262 11 495 289 23 18 36Iraq 2005 9 4542009 63 6 121 9 668 1 0 100 0 02010 66 6 711 10 097 1 0 100 0 0– 42 • 2011 42 3 858 9 248 2 0 50 50Jordan 2005 23 86 371 0 02009 100 387 387 0 0 22010 99 352 354 0 0 0• 23 97 • 2011 97 332 344 0 0Kuwait 2005 100 517 517 3 1 100 1002009 100 933 933 4 0 100 100 02010 100 957 957 3 0 100 100• 100 100 • 2011 100 672 672 0 0Lebanon 2005 1 3 391 3 100 02009 59 298 501 25 8 100 100 192010 52 269 515 7 3 100 100 68• 1 48 • 2011 48 236 496 9 4 100 100Libyan Arab 2005 2 367Jamahiriya 2009 45 950 2 110 144 152010 2 128 212 10 1– 97 • 2011 97 1 498 1 545 128 9 0Morocco 2005 26 2692009 3 930 27 664 99 11 23 45 02010 1 215 28 788 17 8 100 100– 6 • 2011 6 1 856 29 770 41 2 100 68Oman 2005 98 257 261 10 4 100 1002009 100 334 334 3 1 100 100 02010 100 313 313 4 1 100 100 0• 98 100 • 2011 100 337 337 8 2 88 88Pakistan 2005 0 0 144 771 02009 3 8 208 267 451 31 0 23 39 02010 2 6 283 269 290 28 0 39 43• 0 3 • 2011 3 8 322 270 394 33 0 33 85Qatar 2005 100 325 325 0 02009 100 619 619 0 0 02010 0 0 580 0• 100 0 • 2011 0 0 553Saudi Arabia 2005 3 5392009 47 1 929 4 093 63 32010 72 3 278 4 549 77 2– 86 • 2011 86 3 443 4 015 77 2 14Somalia 2005 0 0 13 006 21 38 02009 8 875 11 271 107 12 88 7 02010 26 2 741 10 469 231 8 68 26• 0 34 • 2011 34 4 140 12 021 206 5 85 20 0South Sudan 2011 47 3 570 7 583 475 13 85 29Sudan 2005 1 180 29 178 150 83 10 102009 60 16 168 27 037 692 4 43 542010 28 7 532 27 241 247 3 162 100• 1 15 • 2011 15 3 082 20 385 292 9 0 100Syrian Arab 2005 8 345 4 393 0 0Republic 2009 0 0 4 151 02010 2 85 3 827 5 6 100 0 0• 8 16 • 2011 16 577 3 675 7 1 57 0Tunisia 2005 6 129 2 079 2 2 100 1002009 4 80 2 155 2 2 0 100 242010 7 156 2 368 7 4 100 100 24• 6 12 • 2011 12 360 3 015 10 3 100 100 38United Arab 2005 105Emirates 2009 99 115 116 0 02010 64 84 132 4 5 100 100– 76 • 2011 76 81 106 3 4 100 100West Bank 2005 0 0 28 0and Gaza Strip 2009 97 35 36 0 0 02010 100 31 31 0 0• 0 100 • 2011 100 32 32 0 0Yemen 2005 0 0 9 063 02009 0 0 8 562 02010 0 0 9 050 0 0• 0 – 2011 8 713 0EASTERN MEDITERRANEAN REGIONGLOBAL TUBERCULOSIS REPORT 2012 Data can be downloaded from www.who.int/tb/data 207
YEARTOTALCONFIRMEDCASES OFMDR-TB aESTIMATED CASESOF MDR-TB AMONGNOTIFIEDESTIMATED CASESOF MDR-TB AMONGNOTIFIEDNEW PULMONARY CASESNUMBER OFBACT+VE bTESTED FORMDR-TB% OFBACT+VE bTESTED FORMDR-TBESTIMATED CASESOF MDR-TB AMONGNOTIFIEDPREVIOUSLY TREATED CASESNUMBER OFNOTIFIEDTESTED FORMDR-TB% OF NOTIFIEDTESTED FORMDR-TBAfghanistan 2005 – –2009 – –2010 19 238 1.8 34 2.62011 19 1 100 (0–2 600) 700 (21–2 300) – 380 (34–730) –Bahrain 2005 4 2 2.0 0 –2009 0 42 15 0 –2010 0 162 70 0 –2011 9 7.9 (3.7–15) 7.9 (3.7–15) 154 99 0 (0–0) 0 –Djibouti 2005 39 0 0 0 02009 – –2010 – –2011 0 79 (40–120) 34 (9.5–59) – 44 (15–73) –Egypt 2005 – –2009 204 60 0.95 775 1002010 – –2011 134 400 (310–500) 190 (110–270) 39 0.70 220 (160–270) 497 74Iran (Islamic 2005 27 205 4.5 41 9.6Republic of) 2009 – –2010 58 271 4.7 169 222011 43 810 (640–980) 370 (260–520) 717 13 430 (310–560) 322 36Iraq 2005 – –2009 72 0 0 163 222010 110 0 0 185 242011 84 410 (0–860) 190 (5.5–620) – 220 (20–430) 224 29Jordan 2005 19 98 97 33 3302009 8 95 87 7 352010 10 74 63 7 392011 4 17 (5.9–28) 12 (4.3–24) 55 30 5.1 (0.66–13) 6 33Kuwait 2005 6 516 280 1 1002009 9 427 100 1 1002010 5 437 100 0 02011 0 0 (0–47) 0 (0–47) 282 100 0 (0–0) 0 –Lebanon 2005 3 48 37 4 1002009 4 14 7.8 10 1002010 7 4 2.1 14 1202011 3 4.0 (0–8.2) 3.0 (0.37–11) 18 9.6 1.0 (
MALEFEMALEYEAR 0–14 15–24 25–34 35–44 45–54 55–64 65+0–14 15–24 25–34 35–44 45–54 55–64 65+UN-KNOWNUN-KNOWNMALE:FEMALERATIOAfghanistan 1995 –2000 52 228 183 149 129 94 80 93 414 565 339 205 99 36 0.522005 151 606 560 472 453 470 419 320 1 651 1 959 1 302 869 471 246 0.462010 197 986 819 491 490 641 622 0 445 2 107 2 263 1 455 1 112 831 488 0 0.492011 204 1 010 895 613 570 700 692 465 2 167 2 325 1 564 1 146 903 535 0.51Bahrain 1995 0 0 1 2 3 1 3 0 1 1 2 0 1 1 1.72000 0 0 3 2 5 3 4 0 1 2 0 1 1 1 2.82005 0 0 0 2 3 0 4 1 1 0 3 1 0 0 1.52010 0 10 16 11 12 4 4 0 0 8 15 7 1 1 1 1.72011 1 5 19 13 14 8 2 0 0 9 5 6 6 0 1 0 2.3Djibouti 1995 –2000 17 302 347 139 67 60 42 12 147 156 47 31 17 10 2.32005 18 220 252 119 62 47 29 23 123 117 66 23 13 8 2.02010 28 211 243 151 67 49 20 0 20 104 120 89 36 24 19 0 1.92011 35 212 265 149 97 45 33 0 31 139 118 104 57 30 21 0 1.7Egypt 1995 223 542 665 460 408 463 160 134 288 367 274 256 160 75 1.92000 21 641 827 667 476 307 158 55 457 343 257 211 112 48 2.12005 25 524 606 421 414 243 123 48 431 298 205 218 132 42 1.72010 9 358 617 783 725 407 217 0 8 199 352 423 292 192 97 0 2.02011 23 382 611 596 715 387 168 0 7 192 355 387 280 198 94 0 1.9Iran (Islamic 1995 118 751 754 636 494 737 921 234 1 039 890 664 613 685 788 0.90Republic of) 2000 29 438 467 387 295 344 642 77 593 410 322 320 407 647 0.942005 16 352 531 338 281 260 630 45 394 205 186 260 382 701 1.12010 18 292 487 354 296 310 760 0 54 433 288 208 276 398 1 014 0 0.942011 13 289 543 398 315 351 877 0 37 473 313 184 296 441 1 009 0 1.0Iraq 1995 1 125 862 1 409 1 085 863 900 271 725 304 1 208 915 800 886 200 1.32000 21 627 317 297 205 135 101 37 338 241 136 134 103 87 1.62005 13 424 644 261 245 189 148 44 305 260 151 197 135 80 1.62010 42 370 482 384 276 286 228 73 394 294 198 205 220 166 1.32011 35 304 395 313 237 223 183 0 66 368 258 164 159 201 153 0 1.2Jordan 1995 0 19 37 17 20 26 11 1 15 4 10 14 12 7 2.12000 0 8 16 13 9 14 2 0 8 9 1 2 2 5 2.32005 0 8 17 9 4 6 5 1 6 6 6 5 8 5 1.32010 2 5 14 10 12 12 6 0 3 14 24 4 3 5 3 0 1.12011 0 9 10 13 8 13 5 0 0 8 11 8 4 8 6 0 1.3Kuwait 1995 0 15 51 32 17 9 0 0 8 24 9 4 4 2 2.42000 0 10 44 32 21 11 5 1 11 24 12 5 3 1 2.22005 0 12 45 29 26 8 3 0 13 31 11 3 1 5 1.92010 1 16 67 50 48 10 11 0 4 41 78 30 10 11 8 0 1.12011 0 13 41 36 35 11 5 0 0 23 30 15 9 2 2 0 1.7Lebanon 1995 3 26 32 30 16 16 10 1 16 18 13 8 5 3 2.12000 5 16 28 20 15 17 14 4 31 26 9 7 4 6 1.32005 0 12 19 15 10 12 8 1 25 14 8 3 3 1 1.42010 1 8 21 15 12 12 10 0 0 36 48 17 7 4 3 0 0.692011 1 14 18 13 15 6 8 0 37 51 12 9 1 3 0.66Libyan Arab 1995 2 112 212 78 46 22 21 5 34 31 19 20 13 11 3.7Jamahiriya 2000 5 101 239 86 36 29 32 6 43 35 24 24 16 22 3.12005 2 114 293 168 52 19 35 8 36 36 35 21 21 20 3.92010 –2011 5 85 173 148 54 18 21 0 8 59 47 37 22 25 29 0 2.2Morocco 1995 142 2 508 2 872 1 737 819 573 553 191 1 708 1 288 703 461 317 299 1.92000 99 2 061 2 423 1 705 855 485 595 170 1 530 1 121 672 398 406 352 1.82005 79 2 222 2 515 1 583 1 057 580 591 167 1 330 943 546 403 343 398 2.12010 51 1 982 2 553 1 611 1 273 712 515 0 117 1 098 841 426 386 310 364 0 2.52011 79 1 929 2 450 1 479 1 175 682 518 0 100 1 153 794 433 371 324 335 0 2.4Oman 1995 1 7 12 7 7 10 11 2 18 13 5 5 6 3 1.12000 1 8 9 11 12 9 11 2 17 5 7 5 11 6 1.22005 1 21 11 24 15 19 5 2 13 5 3 4 5 3 2.72010 2 12 27 15 16 8 10 0 3 18 22 6 4 4 5 0 1.52011 1 17 25 12 23 10 11 0 5 20 21 9 13 7 6 0 1.2Pakistan 1995 29 274 230 178 140 124 95 85 375 381 267 178 143 79 0.712000 55 498 387 256 232 153 130 130 591 416 274 163 103 56 0.992005 621 5 278 4 759 4 263 3 834 3 332 2 453 1 447 6 463 5 611 3 987 2 866 2 060 1 338 1.02010 1 548 11 860 10 462 8 320 7 969 6 934 6 066 3 212 14 481 10 513 7 749 6 410 4 879 4 338 1.02011 1 216 12 143 10 515 8 435 8 608 7 320 6 323 2 679 14 652 10 684 7 880 6 590 4 977 3 711 1.1Qatar 1995 0 8 12 11 13 4 4 1 2 3 1 0 0 1 6.52000 0 7 19 9 7 2 1 0 0 4 3 1 0 0 5.62005 19 15 17 19 5 1 5 10 2 1 2 0 3.82010 0 59 72 38 22 5 0 0 0 7 16 2 1 1 0 0 7.32011 0 36 64 36 14 10 3 0 9 15 6 1 2 1 4.8Saudi Arabia 1995 –2000 0 131 268 213 158 86 107 28 172 182 79 51 50 70 1.52005 8 182 276 201 175 70 107 31 205 184 98 73 51 61 1.42010 14 335 458 242 210 116 102 0 33 239 271 105 70 49 58 0 1.82011 4 227 406 225 225 113 106 0 35 200 245 110 64 49 46 0 1.7Somalia 1995 46 334 730 201 127 278 109 38 158 139 97 40 25 16 3.62000 113 740 724 408 254 195 142 85 354 319 219 110 72 41 2.12005 125 1 343 1 114 725 458 330 319 169 752 636 436 292 212 157 1.72010 109 1 036 886 496 355 266 277 0 91 467 444 341 188 137 132 0 1.92011 113 1 147 1 047 587 398 330 277 0 114 495 465 348 260 168 135 0 2.0South Sudan 2011 39 251 599 402 259 135 57 0 60 181 318 239 172 59 26 0 1.7Sudan 1995 250 604 796 634 486 362 337 359 490 613 299 403 342 305 1.22000 785 1 028 1 511 1 351 1 119 638 677 817 925 1 134 905 771 327 323 1.42005 425 1 358 1 990 1 541 1 151 724 493 381 1 102 1 203 978 729 411 244 1.52010 209 1 185 1 781 1 335 863 497 391 195 761 979 772 520 279 191 1.72011 107 899 1 359 981 689 386 372 0 113 512 620 513 352 188 175 0 1.9Syrian Arab 1995 13 332 255 111 70 59 50 22 158 97 53 44 37 20 2.1Republic 2000 8 359 289 125 86 76 55 23 195 101 53 46 38 28 2.12005 9 266 237 111 112 62 63 27 182 108 59 59 32 23 1.82010 7 170 212 101 80 65 49 0 16 164 105 47 41 38 27 0 1.62011 8 139 195 116 81 49 45 0 20 113 97 56 35 36 37 0 1.6Tunisia 1995 –2000 16 139 208 156 109 65 101 7 68 59 43 21 21 58 2.92005 5 103 172 133 115 53 81 7 66 61 39 36 16 28 2.62010 9 115 194 170 125 93 88 4 64 64 39 34 40 52 2.72011 6 110 194 118 126 108 63 0 10 60 60 50 44 35 47 0 2.4United Arab 1995 –Emirates 2000 2 4 4 6 5 12 10 3 16 1 3 0 0 4 1.62005 –2010 1 7 13 7 3 4 4 0 1 2 4 1 5 1 3 0 2.32011 0 3 7 3 5 1 3 0 4 6 6 3 2 1 2 0 0.92West Bank 1995 1 2 0 0 1 0 3 0 1 0 0 1 0 0 3.5and Gaza Strip 2000 –2005 1 1 3 1 1 2.52010 0 2 0 2 1 1 3 0 0 0 1 0 1 2 0 0 2.22011 1 0 1 1 1 0 3 0 0 0 1 1 0 2 0 0 1.8Yemen 1995 57 400 605 256 201 148 45 83 420 720 348 200 106 92 0.872000 110 789 689 493 314 255 127 161 799 627 517 345 247 92 1.02005 48 493 553 366 242 149 78 44 426 410 265 181 85 39 1.32010 68 507 569 322 231 164 138 0 98 471 409 264 174 106 63 0 1.32011 33 406 471 297 193 143 96 0 85 446 375 251 168 113 58 0 1.1EASTERN MEDITERRANEAN REGIONGLOBAL TUBERCULOSIS REPORT 2012 Data can be downloaded from www.who.int/tb/data 209
SMEAR LABS % OF SMEARPER 100K LABS USINGPOPULATION LED aCULTURELABS PER 5MPOPULATIONLABORATORIESDST b LABSPER 5MPOPULATIONLPA c LABSPER 5MPOPULATIONNUMBER OFLABS USINGXPERT MTB/RIFSECOND-LINE DSTAVAILABLENRL dFREE THROUGH NTPTB DIAGNOSISFIRST-LINEDRUGSTB NOTIF.RIFAMPICINRATE PERUSED100 000THROUGHOUTHEALTH-CARETREATMENTWORKERSAfghanistan 1.9 2 0.5Out ofcountryyes Yes (all suspects) yes NoBahrain 1.4 – 7.6 3.8 3.8 1Out ofcountryyes Yes (all suspects) yes YesDjibouti 1.8 0 0 0 0 0 No yes Yes (all suspects) yes YesEgypt 0.3 0 1.1
EUROPEAN REGIONTable A4.1 Estimates of the burden of disease caused by TB, 1990–2011 213Table A4.2 Incidence, notification and case detection rates, all forms, 1990–2011 217Table A4.3 Case notifi cations, 1990–2011 221Table A4.4 Treatment outcomes, new smear-positive cases, 1995–2010 225Table A4.5 Treatment outcomes, retreatment cases, 1995–2010 228Table A4.6 HIV testing and provision of CPT, ART and IPT, 2005–2011 231Table A4.7 Testing for MDR-TB and number of confi rmed cases of MDR-TB, 2005–2011 233Table A4.8 New smear-positive case notifi cation by age and sex, 1995–2011 235Table A4.9 Laboratories, NTP services, drug management and infection control, 2011 238
Estimates of mortality, prevalence and incidenceEstimated values are shown as best estimates followed by lower and upper bounds. The lower and upper bounds aredefined as the 2.5th and 97.5th centiles of outcome distributions produced in simulations. See Annex 1 for furtherdetails.Estimated numbers are shown rounded to two significant figures. Estimated rates are shown rounded to three significantfigures unless the value is under 100, in which case rates are shown rounded to two significant figures. Blank cellsindicate that estimates are not available.Estimates for all years are recalculated as new information becomes available and techniques are refined, so they maydiffer from those published in previous reports in this series. Estimates published in previous global TB control reportsshould no longer be used.Data sourceData shown in this annex are taken from the WHO global TB database on 25 September 2012. Data shown in the mainpart of the report were taken from the database in July 2012. As a result, data in this annex may differ slightly fromthose in the main part of the report.Data can be downloaded from www.who.int/tb/data.Country notesEU/EEA countriesNotification and treatment outcome data for European Union and European Economic Area countries are provision al.DenmarkData for Denmark exclude Greenland.Russian Federation<strong>Report</strong>ed number of TB patients with known HIV status in Table A4.6 is for new TB patients only in 2010 and 2011. Itwas not possible to calculate the % of all TB patients with known HIV status.212 Data can be downloaded from www.who.int/tb/data GLOBAL TUBERCULOSIS REPORT 2012
MORTALITY (EXCLUDING HIV) PREVALENCE (INCLUDING HIV) INCIDENCE (INCLUDING HIV)YEARPOPULATION(MILLIONS)NUMBER(THOUSANDS)RATE aNUMBER(THOUSANDS)RATE aNUMBER(THOUSANDS)Albania 1990 3 0.054 (0.038–0.073) 1.6 (1.2–2.2) 1.1 (0.390–2.3) 35 (12–69) 0.8 (0.580–1.1) 24 (18–32)1995 3 0.039 (0.031–0.048) 1.3 (1.0–1.5) 0.94 (0.320–1.9) 30 (10–60) 0.77 (0.640–0.900) 24 (20–29)2000 3 0.026 (0.018–0.035) 0.83 (0.57–1.1) 0.85 (0.290–1.7) 28 (9.5–55) 0.7 (0.590–0.810) 23 (19–26)2005 3 0.016 (0.012–0.022) 0.52 (0.37–0.71) 0.77 (0.300–1.5) 25 (9.6–46) 0.59 (0.500–0.680) 19 (16–22)2009 3
YEARPOPULATION(MILLIONS)MORTALITY (EXCLUDING HIV) PREVALENCE (INCLUDING HIV) INCIDENCE (INCLUDING HIV)NUMBER(THOUSANDS)RATE aNUMBER(THOUSANDS)RATE aNUMBER(THOUSANDS)Georgia 1990 5 0.46 (0.400–0.510) 8.3 (7.3–9.4) 37 (16–65) 675 (300–1 200) 15 (14–17) 280 (250–312)1995 5 0.4 (0.350–0.450) 7.8 (6.8–8.9) 28 (13–46) 543 (265–917) 13 (12–15) 263 (234–293)2000 5 0.36 (0.320–0.410) 7.6 (6.6–8.7) 23 (12–38) 487 (246–809) 12 (11–14) 256 (228–285)2005 4 0.23 (0.190–0.270) 5.2 (4.3–6.1) 14 (7.0–22) 304 (156–500) 7.8 (7.0–8.7) 175 (156–195)2009 4 0.17 (0.150–0.200) 3.9 (3.3–4.6) 8.1 (3.7–14) 184 (84–324) 5.8 (5.2–6.4) 132 (118–147)2010 4 0.17 (0.140–0.190) 3.8 (3.3–4.4) 7.4 (3.1–13) 169 (72–307) 5.6 (5.0–6.2) 128 (114–142)2011 4 0.16 (0.140–0.190) 3.7 (3.2–4.3) 6.9 (2.8–13) 159 (64–298) 5.4 (4.8–6.1) 125 (112–140)Germany 1990 79 1 (0.990–1.0) 1.3 (1.2–1.3) 21 (8.3–40) 27 (10–50) 17 (15–19) 21 (18–24)1995 82 0.71 (0.710–0.720) 0.87 (0.86–0.88) 18 (7.3–34) 22 (8.9–42) 14 (13–16) 18 (15–20)2000 82 0.47 (0.460–0.480) 0.57 (0.56–0.58) 13 (5.0–24) 15 (6.0–29) 10 (8.7–11) 12 (11–14)2005 83 0.34 (0.340–0.350) 0.42 (0.41–0.42) 7.8 (3.0–15) 9.4 (3.7–18) 6.1 (5.4–6.9) 7.4 (6.5–8.4)2009 82 0.3 (0.290–0.300) 0.36 (0.35–0.36) 5.4 (2.1–10) 6.6 (2.6–12) 4.3 (3.8–4.8) 5.2 (4.6–5.9)2010 82 0.29 (0.280–0.290) 0.35 (0.34–0.35) 5 (2.0–9.4) 6.1 (2.4–11) 4 (3.5–4.5) 4.8 (4.2–5.4)2011 82 0.28 (0.280–0.280) 0.34 (0.34–0.35) 4.7 (1.8–8.8) 5.7 (2.2–11) 3.7 (3.2–4.2) 4.5 (3.9–5.1)Greece 1990 10 0.2 (0.190–0.210) 2 (1.9–2.1) 1.2 (0.460–2.2) 12 (4.5–22) 0.93 (0.810–1.0) 9.1 (8.0–10)1995 11 0.14 (0.130–0.160) 1.3 (1.2–1.5) 1.4 (0.550–2.6) 13 (5.1–25) 1.1 (0.970–1.2) 10 (9.1–12)2000 11 0.097 (0.093–0.100) 0.88 (0.84–0.92) 1.1 (0.430–2.1) 10 (3.9–19) 0.86 (0.760–0.980) 7.8 (6.9–8.9)2005 11 0.092 (0.088–0.096) 0.83 (0.79–0.86) 0.83 (0.330–1.6) 7.4 (2.9–14) 0.65 (0.570–0.740) 5.9 (5.1–6.6)2009 11 0.092 (0.089–0.096) 0.82 (0.78–0.85) 0.68 (0.270–1.3) 6 (2.4–11) 0.54 (0.470–0.610) 4.7 (4.1–5.3)2010 11 0.092 (0.087–0.097) 0.81 (0.76–0.85) 0.62 (0.240–1.2) 5.4 (2.2–10) 0.49 (0.430–0.550) 4.3 (3.8–4.9)2011 11 0.091 (0.086–0.096) 0.8 (0.75–0.84) 0.55 (0.220–1.0) 4.8 (1.9–9.0) 0.43 (0.380–0.490) 3.8 (3.3–4.3)Greenland 1990 < 1
MORTALITY (EXCLUDING HIV) PREVALENCE (INCLUDING HIV) INCIDENCE (INCLUDING HIV)YEARPOPULATION(MILLIONS)NUMBER(THOUSANDS)RATE aNUMBER(THOUSANDS)RATE aNUMBER(THOUSANDS)Montenegro 2005 < 1
YEARPOPULATION(MILLIONS)MORTALITY (EXCLUDING HIV) PREVALENCE (INCLUDING HIV) INCIDENCE (INCLUDING HIV)NUMBER(THOUSANDS)RATE aNUMBER(THOUSANDS)RATE aNUMBER(THOUSANDS)The Former 1990 2 0.13 (0.120–0.140) 6.8 (6.3–7.2) 3.4 (1.0–7.2) 178 (54–374) 1.5 (0.950–2.3) 81 (50–119)Yugoslav Republic 1995 2 0.13 (0.120–0.140) 6.6 (6.2–7.0) 1.6 (0.680–3.0) 82 (35–150) 1.1 (0.930–1.4) 58 (47–69)of Macedonia 2000 2 0.1 (0.096–0.110) 5.1 (4.8–5.5) 1.2 (0.510–2.2) 60 (25–109) 0.83 (0.680–1.0) 41 (34–50)2005 2 0.07 (0.065–0.074) 3.4 (3.2–3.6) 0.66 (0.190–1.4) 33 (9.3–70) 0.6 (0.540–0.670) 30 (27–33)2009 2 0.039 (0.036–0.042) 1.9 (1.8–2.1) 0.54 (0.170–1.1) 26 (8.5–54) 0.46 (0.400–0.530) 23 (20–26)2010 2 0.032 (0.030–0.034) 1.6 (1.5–1.7) 0.54 (0.200–1.1) 26 (9.7–51) 0.43 (0.370–0.500) 21 (18–24)2011 2 0.025 (0.024–0.027) 1.2 (1.1–1.3) 0.57 (0.250–1.0) 27 (12–49) 0.41 (0.350–0.470) 20 (17–23)Turkey 1990 54 3.2 (0.750–7.5) 6 (1.4–14) 27 (11–51) 51 (20–95) 28 (25–32) 53 (46–60)1995 59 2.3 (0.840–4.5) 3.9 (1.4–7.7) 34 (17–57) 58 (28–98) 28 (24–31) 47 (41–53)2000 64 1.7 (0.710–3.1) 2.7 (1.1–4.9) 29 (14–49) 45 (22–76) 23 (20–26) 36 (32–41)2005 68 0.96 (0.510–1.5) 1.4 (0.75–2.3) 19 (8.7–33) 28 (13–48) 21 (18–24) 31 (27–35)2009 72 0.63 (0.200–1.3) 0.88 (0.28–1.8) 18 (8.4–31) 25 (12–43) 19 (17–22) 27 (24–31)2010 73 0.58 (0.180–1.2) 0.79 (0.25–1.6) 18 (8.2–31) 24 (11–42) 19 (16–21) 26 (22–29)2011 74 0.53 (0.170–1.1) 0.72 (0.23–1.5) 17 (8.1–30) 24 (11–41) 18 (15–20) 24 (21–27)Turkmenistan 1990 4 0.49 (0.400–0.590) 13 (11–16) 6 (2.8–10) 165 (78–284) 3.7 (3.0–4.4) 101 (82–121)1995 4 0.83 (0.720–0.950) 20 (17–23) 12 (5.7–20) 286 (137–488) 6.3 (5.1–7.5) 150 (122–180)2000 5 1.3 (0.820–1.8) 28 (18–40) 18 (8.8–32) 411 (196–703) 9.6 (7.8–12) 213 (174–256)2005 5 1.1 (0.700–1.6) 23 (15–33) 16 (7.5–27) 329 (157–561) 8.2 (6.7–9.8) 172 (141–207)2009 5 0.7 (0.450–1.0) 14 (9.1–20) 8.6 (4.0–15) 173 (81–298) 5.3 (4.3–6.3) 106 (87–127)2010 5 0.6 (0.390–0.860) 12 (7.7–17) 6.7 (3.0–12) 134 (59–239) 4.5 (3.7–5.4) 90 (73–108)2011 5 0.5 (0.330–0.720) 9.9 (6.4–14) 4.9 (1.8–9.6) 96 (34–188) 3.8 (3.1–4.6) 74 (61–89)Ukraine 1990 52 4.6 (4.3–4.8) 8.8 (8.4–9.3) 34 (15–60) 66 (30–116) 23 (19–27) 44 (36–52)1995 51 7.5 (7.2–7.7) 15 (14–15) 61 (29–100) 119 (57–203) 37 (31–44) 73 (60–86)2000 49 10 (10–11) 21 (21–22) 75 (36–130) 154 (74–264) 52 (43–62) 106 (88–126)2005 47 11 (11–11) 24 (23–24) 75 (36–130) 161 (76–276) 56 (46–66) 119 (99–141)2009 46 9.6 (9.1–10) 21 (20–22) 63 (28–110) 137 (61–243) 48 (39–56) 104 (86–123)2010 45 8.9 (8.4–9.3) 20 (19–21) 54 (24–97) 120 (53–213) 44 (37–52) 97 (80–115)2011 45 8.1 (7.8–8.3) 18 (17–18) 47 (21–84) 104 (46–187) 40 (33–47) 89 (74–105)United Kingdom of 1990 57 0.45 (0.450–0.450) 0.79 (0.79–0.79) 8 (3.0–15) 14 (5.2–27) 6.6 (6.2–7.1) 12 (11–12)Great Britain and 1995 58 0.61 (0.600–0.620) 1.1 (1.0–1.1) 8.5 (3.3–16) 15 (5.7–28) 6.9 (6.5–7.4) 12 (11–13)Northern Ireland 2000 59 0.44 (0.430–0.440) 0.74 (0.73–0.75) 8.6 (3.4–16) 15 (5.8–27) 7 (6.5–7.4) 12 (11–13)2005 60 0.4 (0.390–0.410) 0.66 (0.65–0.68) 12 (5.7–22) 21 (9.5–36) 9.2 (8.6–9.8) 15 (14–16)2009 62 0.36 (0.350–0.380) 0.59 (0.57–0.61) 9 (3.1–18) 15 (5.0–29) 7.8 (7.3–8.4) 13 (12–14)2010 62 0.35 (0.340–0.370) 0.57 (0.55–0.59) 9.6 (3.6–18) 15 (5.8–30) 8.1 (7.6–8.6) 13 (12–14)2011 62 0.35 (0.340–0.350) 0.55 (0.54–0.56) 12 (5.2–20) 19 (8.3–33) 8.8 (8.2–9.4) 14 (13–15)Uzbekistan 1990 21 1.5 (1.3–1.8) 7.5 (6.6–8.5) 51 (24–87) 248 (118–425) 26 (21–30) 125 (103–148)1995 23 2.8 (2.4–3.1) 12 (10–14) 97 (45–170) 423 (197–734) 46 (38–54) 199 (165–237)2000 25 4.3 (3.7–4.9) 17 (15–20) 150 (71–270) 618 (286–1 080) 71 (59–84) 286 (237–341)2005 26 3.6 (3.2–4.2) 14 (12–16) 120 (58–210) 467 (223–800) 60 (50–72) 233 (192–277)2009 27 2.4 (2.0–2.7) 8.7 (7.4–10) 71 (35–120) 263 (128–447) 39 (32–46) 144 (119–171)2010 27 2 (1.7–2.3) 7.4 (6.3–8.5) 60 (29–100) 219 (107–370) 34 (28–40) 122 (101–145)2011 28 1.7 (1.4–2.0) 6.1 (5.2–7.1) 49 (24–84) 177 (86–301) 28 (23–33) 101 (84–121)RATE aaRates are per 100 000 population.216 Data can be downloaded from www.who.int/tb/data GLOBAL TUBERCULOSIS REPORT 2012
INCIDENCE (INCLUDING HIV) INCIDENCE HIV-POSITIVE NOTIFIED NEW AND RELAPSE CASE DETECTIONYEARPOPULATION(MILLIONS)NUMBER(THOUSANDS)RATE aNUMBER(THOUSANDS)RATE a NUMBER RATE a PERCENTAlbania 1990 3 0.8 (0.580–1.1) 24 (18–32) 653 20 81 (61–110)1995 3 0.77 (0.640–0.900) 24 (20–29) 641 20 84 (71–100)2000 3 0.7 (0.590–0.810) 23 (19–26) 604 20 87 (75–100)2005 3 0.59 (0.500–0.680) 19 (16–22) 506 16 86 (74–100)2009 3 0.47 (0.400–0.540) 15 (12–17) 435 14 93 (80–110)2010 3 0.45 (0.380–0.520) 14 (12–16) 431 13 97 (83–110)2011 3 0.42 (0.360–0.490) 13 (11–15) 422 13 100 (87–120)Andorra 1990 < 1 0.026 (0.023–0.030) 50 (44–57) 23 44 87 (77–99)1995 < 1 0.021 (0.019–0.024) 33 (29–37)2000 < 1 0.011 (
YEARPOPULATION(MILLIONS)INCIDENCE (INCLUDING HIV) INCIDENCE HIV-POSITIVE NOTIFIED NEW AND RELAPSE CASE DETECTIONNUMBER(THOUSANDS)RATE aNUMBER(THOUSANDS)RATE a NUMBER RATE a PERCENTGeorgia 1990 5 15 (14–17) 280 (250–312) 0.01 (
INCIDENCE (INCLUDING HIV) INCIDENCE HIV-POSITIVE NOTIFIED NEW AND RELAPSE CASE DETECTIONYEARPOPULATION(MILLIONS)NUMBER(THOUSANDS)RATE aNUMBER(THOUSANDS)RATE a NUMBER RATE a PERCENTMontenegro 2005 < 1 0.17 (0.150–0.190) 27 (23–31) 156 25 93 (82–110)2009 < 1 0.13 (0.120–0.150) 21 (19–24) 113 18 85 (75–97)2010 < 1 0.12 (0.110–0.140) 19 (17–21)
YEARPOPULATION(MILLIONS)INCIDENCE (INCLUDING HIV) INCIDENCE HIV-POSITIVE NOTIFIED NEW AND RELAPSE CASE DETECTIONNUMBER(THOUSANDS)RATE aNUMBER(THOUSANDS)RATE a NUMBER RATE a PERCENTThe Former 1990 2 1.5 (0.950–2.3) 81 (50–119)Yugoslav Republic 1995 2 1.1 (0.930–1.4) 58 (47–69) 786 40 69 (58–85)of Macedonia 2000 2 0.83 (0.680–1.0) 41 (34–50) 641 32 77 (64–94)2005 2 0.6 (0.540–0.670) 30 (27–33) 598 29 99 (90–110)2009 2 0.46 (0.400–0.530) 23 (20–26) 450 22 97 (85–110)2010 2 0.43 (0.370–0.500) 21 (18–24) 384 19 89 (77–100)2011 2 0.41 (0.350–0.470) 20 (17–23) 335 16 83 (72–96)Turkey 1990 54 28 (25–32) 53 (46–60)
NEW AND RELAPSENOTIFICATION RATE a1990–2011YEARNEW ANDRELAPSENEW CASESSMEAR- SMEAR-NEGATIVE/POSITIVE UNKNOWNEXTRA-RE-TREAT EXCL.OTHER RELAPSEPULMONARY RELAPSETOTALRETREATHISTORYUNKNOWN% SMEAR-POS AMONGNEW PULMAlbania 1990 653 –1995 641 139 223 226 53 53 382000 604 171 188 234 11 8 19 482005 506 196 134 167 9 34 43 592009 435 171 109 136 19 2 21 10 612010 431 145 105 165 0 16 14 30 0 58• 20 13 • 2011 422 180 105 128 0 9 9 18 0 63Andorra 1990 23 –1995 –2000 12 1 9 2 0 0 0 102005 10 5 1 4 0 0 0 832009 8 2 4 1 0 1 1 2 0 332010 7 0 4 3 0 0 0 0 0 0• 44 3 • 2011 3 1 2 0 0 0 1 1 0 33Armenia 1990 590 –1995 1 000 436 451 75 38 38 492000 1 333 621 505 153 54 22 76 552005 2 206 581 1 049 365 211 116 327 362009 1 560 440 725 299 0 96 446 542 0 382010 1 410 339 639 351 0 81 370 451 0 35• 17 41 • 2011 1 261 329 582 289 0 61 321 382 0 36Austria 1990 1 521 –1995 1 481 467 765 249 382000 1 185 324 652 209 0 30 30 332005 928 234 519 175 0 26 26 312009 441 90 268 34 45 4 21 25 245 252010 358 76 213 69 0 0 29 29 301 26• 20 5 • 2011 400 94 217 85 0 4 16 20 271 30Azerbaijan 1990 2 620 –1995 1 630 669 620 93 47 47 522000 5 187 890 3 978 245 74 0 74 182005 6 034 1 561 2 508 651 1 314 1 886 3 200 382009 7 301 1 487 3 124 1 261 1 429 955 2 384 2 161 322010 6 390 1 997 2 275 965 0 1 153 844 1 997 1 160 47• 36 70 • 2011 6 527 1 426 2 752 1 130 0 1 219 3 290 4 509 0 34Belarus 1990 3 039 –1995 4 854 1 845 2 148 518 343 343 462000 6 799 2 547 2 985 442 825 0 825 462005 5 308 1 235 3 710 363 1 049 1 049 252009 5 250 1 201 3 002 430 617 261 878 292010 5 003 1 269 2 647 429 0 658 456 1 114 95 32• 30 49 • 2011 4 697 1 217 2 439 387 654 421 1 075 33Belgium 1990 1 577 –1995 1 380 400 534 366 80 80 432000 1 278 409 454 326 89 0 89 472005 1 076 380 406 290 68 68 482009 806 280 294 107 125 214 492010 814 244 340 230 0 87 87 214 42• 16 0 • 2011 –Bosnia and 1990 4 073 –Herzegovina 1995 2 132 865 997 140 130 130 462000 2 476 759 1 287 261 169 24 193 372005 2 111 640 1 106 258 107 49 156 0 372009 1 725 609 862 188 0 66 47 113 0 412010 1 321 441 529 161 158 32 69 101 0 45• 95 36 • 2011 1 360 547 611 162 0 40 25 65 0 47Bulgaria 1990 2 256 –1995 3 245 1 087 1 709 449 392000 3 349 2 524 0 442 383 0 383 1002005 3 225 1 214 1 511 376 124 77 201 452009 2 683 894 892 443 297 157 215 372 13 502010 2 412 806 748 747 0 111 237 348 0 52• 26 29 • 2011 2 172 716 708 628 0 120 235 355 0 50Croatia 1990 2 576 –1995 2 114 1 204 703 165 42 42 632000 1 630 –2005 1 050 372 575 103 0 94 94 392009 832 302 410 81 0 39 23 62 422010 688 183 382 87 36 7 43 32• 57 14 • 2011 619 201 343 75 37Cyprus 1990 29 –1995 36 6 11 13 0 0 352000 33 4 10 17 0 0 292005 34 9 13 12 0 3 3 412009 43 14 15 3 9 2 1 3 11 482010 33 8 12 13 0 0 0 0 28 40• 4 0 • 2011 –Czech Republic 1990 1 937 –1995 1 834 487 1 026 300 21 21 322000 1 414 420 679 290 25 0 25 382005 973 308 461 204 0 34 34 402009 638 218 322 54 44 64 402010 627 200 333 94 0 0 51 51 0 38• 19 0 • 2011 –Denmark 1990 350 –1995 448 128 186 128 6 6 412000 587 171 244 144 28 0 28 412005 395 129 145 121 0 29 29 472009 294 101 125 25 37 6 4 10 41 452010 313 115 102 39 57 46 46 0 53• 7 0 • 2011 –Estonia 1990 423 –1995 624 369 124 60 71 71 752000 791 255 320 67 116 0 116 442005 479 162 217 46 54 40 94 432009 361 135 175 18 3 30 50 80 442010 283 99 134 17 0 33 46 79 0 42• 27 22 • 2011 296 123 124 18 0 31 45 76 0 50Finland 1990 772 –1995 661 244 193 224 562000 527 205 136 157 29 0 29 602005 339 130 114 95 0 22 22 0 532009 519 93 198 114 114 14 322010 312 82 146 84 0 0 15 15 0 36• 15 6 • 2011 312 82 143 87 0 0 13 13 0 36EUROPEAN REGIONaRates are per 100 000 population.GLOBAL TUBERCULOSIS REPORT 2012 Data can be downloaded from www.who.int/tb/data 221
NEW AND RELAPSENOTIFICATION RATE a1990–2011YEARNEW ANDRELAPSENEW CASESSMEAR- SMEAR-NEGATIVE/POSITIVE UNKNOWNEXTRA-RE-TREAT EXCL.OTHER RELAPSEPULMONARY RELAPSETOTALRETREATHISTORYUNKNOWN% SMEAR-POS AMONGNEW PULMFrance 1990 9 030 –1995 8 723 3 449 2 969 2 305 542000 6 122 1 815 1 364 1 665 0 0 572005 4 887 1 941 1 557 1 389 0 371 371 116 552009 2 890 1 019 1 038 439 394 502010 2 752 960 1 015 765 12 0 315 315 2 049 49• 16 0 • 2011 –Georgia 1990 1 537 –1995 1 625 221 1 087 121 196 196 172000 4 397 601 2 213 1 324 259 422 681 212005 4 501 1 509 1 524 1 261 207 1 945 2 152 2 502009 4 732 2 055 1 119 1 283 0 275 291 566 955 652010 4 674 2 140 1 088 1 155 0 291 1 118 1 409 4 66• 28 105 • 2011 4 547 2 026 1 141 1 056 0 324 986 1 310 0 64Germany 1990 14 653 –1995 12 198 3 852 6 473 1 873 372000 9 064 –2005 5 539 1 379 2 801 1 211 148 345 493 161 332009 3 659 1 025 1 765 353 402 114 138 252 635 372010 3 524 910 1 713 789 16 96 271 367 535 35• 19 4 • 2011 3 528 942 1 768 728 17 73 223 296 513 35Greece 1990 877 –1995 939 –2000 703 235 339 81 48 48 412005 626 197 322 107 0 74 74 67 382009 465 198 196 44 26 1 2 3 121 502010 356 178 129 49 0 0 44 44 89 58• 9 0 • 2011 –Greenland 1990 –1995 –2000 –2005 –2009 63 24 30 3 6 0 6 442010 114 38 59 7 10 2 12 39• 0 0 • 2011 –Hungary 1990 3 588 –1995 4 339 796 3 292 251 192000 3 073 412 2 361 221 79 292 371 152005 1 808 423 1 137 117 131 216 347 272009 1 315 363 800 51 16 85 126 211 7 312010 1 543 270 1 147 70 0 56 198 254 0 19• 35 0 • 2011 –Iceland 1990 18 –1995 12 2 3 7 0 0 402000 13 1 7 4 1 0 1 122005 10 2 3 5 0 1 1 402009 11 3 3 2 2 1 0 1 1 502010 22 6 12 4 0 0 0 0 0 33• 7 2 • 2011 8 1 2 5 0 0 1 1 0 33Ireland 1990 624 –1995 458 –2000 386 138 150 96 2 20 22 482005 387 130 156 99 2 38 40 36 452009 340 95 119 60 59 7 9 16 139 442010 319 84 122 112 1 31 31 77 41• 18 6 • 2011 281 85 110 83 3 28 28 121 44Israel 1990 234 –1995 398 –2000 537 216 213 100 0 8 0 8 0 502005 371 142 168 55 0 6 1 7 0 462009 347 119 130 89 0 9 0 9 0 482010 340 103 162 74 0 1 3 4 0 39• 5 5 • 2011 412 135 207 66 0 4 6 10 0 39Italy 1990 4 246 –1995 5 627 1 413 2 700 1 514 342000 3 501 687 891 522 269 356 625 442005 3 828 1 275 1 506 1 047 0 293 293 16 462009 2 541 885 863 408 385 1 336 512010 1 693 586 779 328 0 0 74 74 1 482 43• 7 3 • 2011 1 658 476 730 452 0 0 69 69 1 167 39Kazakhstan 1990 10 969 –1995 11 310 3 022 5 966 1 002 1 320 1 320 342000 25 843 8 903 11 324 2 555 3 061 2 032 5 093 442005 25 512 6 911 14 472 920 3 209 11 800 15 009 3 117 322009 20 508 5 213 9 319 2 278 0 3 698 5 673 9 371 4 397 362010 19 703 4 769 8 745 2 127 0 4 062 5 151 9 213 3 696 35• 66 113 • 2011 18 254 4 306 8 094 1 996 0 3 858 4 822 8 680 0 35Kyrgyzstan 1990 2 306 –1995 3 393 832 1 685 749 127 127 332000 6 205 1 296 2 929 1 683 297 258 555 312005 6 329 1 972 2 141 1 805 411 436 847 0 482009 5 765 1 609 2 267 1 558 331 427 758 166 422010 5 652 1 645 2 028 1 635 0 344 643 987 45• 52 103 • 2011 5 529 1 537 2 125 1 518 0 349 725 1 074 42Latvia 1990 906 –1995 1 541 504 693 226 118 118 422000 1 982 637 793 285 267 108 375 452005 1 409 536 554 148 171 34 205 492009 951 367 377 47 39 121 26 147 492010 913 339 400 86 0 88 21 109 0 46• 34 39 • 2011 864 293 410 85 0 76 21 97 0 42Lithuania 1990 1 471 –1995 2 362 979 1 049 206 128 128 482000 2 657 776 1 051 503 327 182 509 422005 2 114 964 793 357 0 460 460 552009 1 895 742 702 158 75 218 186 404 512010 1 750 719 633 221 0 177 187 364 1 53• 40 53 • 2011 1 745 681 664 187 0 213 156 369 3 51Luxembourg 1990 48 –1995 32 –2000 44 21 19 0 4 4 522005 37 14 20 3 0 0 0 412009 27 –2010 24 0 18 6 0 0 0 0 5 0• 13 2 • 2011 11 4 4 3 0 0 1 1 14 50aRates are per 100 000 population.222 Data can be downloaded from www.who.int/tb/data GLOBAL TUBERCULOSIS REPORT 2012
NEW AND RELAPSENOTIFICATION RATE a1990–2011YEARNEW ANDRELAPSENEW CASESSMEAR- SMEAR-NEGATIVE/POSITIVE UNKNOWNEXTRA-RE-TREAT EXCL.OTHER RELAPSEPULMONARY RELAPSETOTALRETREATHISTORYUNKNOWN% SMEAR-POS AMONGNEW PULMMalta 1990 13 –1995 11 5 4 2 0 0 562000 16 5 9 2 0 0 0 362005 21 5 10 6 0 1 1 1 332009 41 12 11 6 12 2 2 1 522010 20 4 6 10 0 0 3 3 9 40• 4 5 • 2011 22 7 8 7 0 0 3 3 8 47Monaco 1990 1 –1995 1 –2000 0 0 0 0 0 0 02005 –2009 –2010 1 1 –• 3 0 • 2011 –Montenegro 2005 156 64 66 13 13 14 27 492009 113 53 43 12 0 5 6 11 1 552010 110 39 49 14 0 8 4 12 0 4417 • 2011 110 48 40 12 0 10 2 12 0 55Netherlands 1990 1 369 –1995 1 619 575 1 522 513 272000 1 244 289 528 427 0 70 70 352005 1 127 237 491 385 14 30 44 332009 1 111 203 392 499 17 29 46 20 342010 1 029 176 370 463 4 16 27 43 17 32• 9 6 • 2011 970 177 353 425 3 12 26 38 11 33Norway 1990 285 –1995 236 62 57 89 28 28 522000 221 37 103 79 2 10 12 262005 269 48 119 102 0 14 14 7 292009 258 42 125 37 54 105 252010 274 49 110 115 0 42 42 23 31• 7 0 • 2011 –Poland 1990 16 136 –1995 15 958 6 955 7 285 647 1 071 1 071 492000 10 931 3 180 6 392 477 882 0 882 332005 8 203 2 823 4 591 789 0 1 077 1 077 382009 7 645 2 658 4 047 408 155 377 311 688 280 402010 7 002 2 484 3 625 501 0 392 507 899 0 41• 42 21 • 2011 7 946 2 587 4 344 584 0 431 532 963 0 37Portugal 1990 6 214 –1995 5 577 2 019 1 531 1 759 268 268 572000 4 227 1 863 1 005 1 178 177 304 481 652005 3 303 1 302 974 905 122 228 350 5 572009 2 723 1 043 826 405 326 123 148 271 562010 2 487 912 791 679 16 89 139 228 0 54• 63 0 • 2011 –Republic of 1990 1 728 –Moldova 1995 2 925 665 1 958 154 148 148 252000 2 935 651 1 788 122 374 0 374 272005 5 141 1 696 2 237 568 640 1 137 1 777 432009 4 347 1 318 2 015 471 0 543 1 120 1 663 124 402010 4 122 1 267 2 073 405 0 377 1 312 1 689 13 38• 40 119 • 2011 4 208 1 272 2 140 424 0 372 1 108 1 480 25 37Romania 1990 16 256 –1995 23 271 10 469 8 303 3 422 1 077 1 077 562000 27 470 10 202 10 180 3 474 3 614 156 3 770 502005 26 104 10 801 8 038 3 568 3 697 3 241 6 938 2 572009 20 868 8 987 5 681 2 486 712 3 002 2 399 5 401 612010 18 379 7 951 5 113 2 899 0 2 416 2 699 5 115 0 61• 70 79 • 2011 16 866 7 362 4 557 2 634 0 2 313 2 352 4 665 0 62Russian 1990 50 641 –Federation 1995 84 980 37 512 42 241 5 227 472000 140 677 27 467 102 228 5 313 5 669 12 478 18 147 212005 127 930 32 605 74 301 12 320 8 704 26 449 35 153 302009 126 227 33 351 72 931 10 945 0 9 000 23 569 32 569 6 426 312010 118 641 31 416 67 894 3 513 7 081 8 737 37 243 45 980 6 669 32• 34 79 • 2011 112 910 29 191 65 106 10 023 8 590 46 569 55 159 31San Marino 1990 1 –1995 2 –2000 1 1 0 0 0 0 0 1002005 –2009 –2010 –• 4 0 • 2011 –Serbia 2005 3 208 1 105 1 584 479 40 260 300 0 412009 1 879 1 055 488 197 0 139 64 203 652 682010 2 326 977 700 501 0 148 52 200 7 5822 • 2011 2 171 905 745 401 0 120 42 162 3 55Serbia (without Kosovo) 2005 2 146 873 714 245 552009 1 625 801 5 1002010 1 442 690 431 202 119 119 622011 1 296 654 372 155 91 91 64Kosovo 2005 1 062 232 596 234 282009 254 254 647 1002010 884 287 269 299 29 29 522011 875 251 349 246 29 29 42Serbia & 1990 4 194 –Montenegro 1995 2 798 1 497 930 173 198 198 62• 41 2000 2 864 0 2 486 175 203 0 203 0Slovakia 1990 1 448 –1995 1 540 788 555 177 20 20 592000 1 010 236 469 203 102 18 120 332005 710 162 356 134 58 50 108 312009 438 121 202 61 22 32 47 79 21 372010 386 112 190 59 0 25 30 55 23 37• 27 6 • 2011 352 96 170 57 0 29 21 50 26 36Slovenia 1990 722 –1995 525 303 83 109 30 30 782000 368 145 133 59 31 16 47 522005 269 109 110 30 20 9 29 502009 186 85 70 13 12 6 2 8 552010 169 64 67 30 0 8 3 11 0 49• 37 9 • 2011 181 82 73 26 0 11 11 0 53EUROPEAN REGIONaRates are per 100 000 population.GLOBAL TUBERCULOSIS REPORT 2012 Data can be downloaded from www.who.int/tb/data 223
NEW AND RELAPSENOTIFICATION RATE a1990–2011YEARNEW ANDRELAPSENEW CASESSMEAR- SMEAR-NEGATIVE/POSITIVE UNKNOWNEXTRA-RE-TREAT EXCL.OTHER RELAPSEPULMONARY RELAPSETOTALRETREATHISTORYUNKNOWN% SMEAR-POS AMONGNEW PULMSpain 1990 7 600 –1995 8 764 2 605 6 159 302000 7 993 3 423 4 446 124 0 0 0 432005 7 281 2 511 3 880 890 0 1 078 1 078 392009 6 687 2 236 2 879 1 572 905 442010 6 377 2 076 2 621 1 680 0 0 324 324 388 44• 20 13 • 2011 6 044 2 186 2 242 1 616 0 0 370 370 348 49Sweden 1990 557 –1995 564 102 235 216 11 11 302000 417 118 147 152 0 40 40 452005 539 134 208 197 0 30 30 392009 515 107 180 228 112 372010 552 117 226 209 0 0 52 52 71 34• 7 5 • 2011 457 99 182 173 0 3 42 45 87 35Switzerland 1990 1 278 –1995 830 185 515 126 5 5 262000 404 86 216 102 63 63 173 282005 381 84 187 110 49 49 133 312009 334 74 163 97 51 51 169 312010 322 82 149 91 40 40 186 35• 19 5 • 2011 379 90 170 119 54 54 145 35Tajikistan 1990 2 460 –1995 2 029 1 042 617 370 370 632000 2 779 434 1 918 427 182005 5 460 1 745 2 175 1 417 123 2 066 2 189 452009 6 125 1 972 2 208 1 684 261 272 533 1 085 472010 6 297 2 290 2 038 1 631 0 338 647 985 697 53• 46 90 • 2011 6 290 2 174 2 148 1 613 0 355 574 929 745 50The Former 1990 –Yugoslav Republic 1995 786 319 376 66 25 25 46of Macedonia 2000 641 167 308 150 16 0 16 352005 598 178 236 141 43 60 103 432009 450 198 103 116 0 33 23 56 0 662010 384 141 135 92 0 16 36 52 0 51• 0 16 • 2011 335 132 99 76 0 28 27 55 0 57Turkey 1990 24 468 –1995 22 981 4 383 17 534 1 064 202000 18 038 4 315 8 544 4 371 808 808 342005 19 744 7 450 5 944 5 359 991 1 559 2 550 562009 16 757 6 007 4 289 5 647 0 814 631 1 445 14 582010 15 879 5 375 4 191 5 617 0 696 672 1 368 0 56• 45 20 • 2011 15 054 4 927 3 925 5 565 0 637 625 1 262 0 56Turkmenistan 1990 2 325 –1995 1 939 544 1 327 1 67 67 292000 4 038 1 017 2 709 241 71 1 894 1 965 272005 3 191 995 1 498 656 42 100 142 402009 3 157 1 370 1 223 564 532010 3 230 1 153 1 248 473 274 82 82 48• 63 0 • 2011 –Ukraine 1990 16 465 –1995 21 459 8 263 9 793 1 514 1 889 1 889 462000 32 945 10 738 17 258 1 739 3 210 0 3 210 382005 39 608 –2009 36 075 13 632 15 934 3 858 2 651 2 826 5 477 462010 33 857 9 976 17 599 3 355 365 2 562 2 552 5 114 36• 32 76 • 2011 34 237 10 502 14 106 3 367 3 213 3 049 7 858 10 907 581 43United Kingdom of 1990 5 908 –Great Britain and 1995 6 176 4 162 2 014 –Northern Ireland 2000 6 220 1 204 2 037 2 478 0 0 0 372005 8 173 1 821 2 752 3 600 0 460 460 402009 7 008 1 256 2 462 3 262 28 2 032 342010 7 219 1 201 2 551 3 443 24 576 576 688 32• 10 13 • 2011 7 850 1 204 2 827 3 783 36 524 524 589 30Uzbekistan 1990 9 414 –1995 9 866 2 735 5 798 1 333 322000 15 750 3 825 10 142 1 760 23 324 347 272005 21 513 5 695 7 857 6 324 1 637 7 378 9 015 422009 17 540 4 959 6 943 4 667 971 1 480 2 451 2 433 422010 16 883 4 711 6 735 4 288 0 1 149 3 447 4 596 0 41• 46 52 • 2011 14 501 4 198 5 958 3 839 0 506 568 1 074 844 41aRates are per 100 000 population.224 Data can be downloaded from www.who.int/tb/data GLOBAL TUBERCULOSIS REPORT 2012
% OF COHORTTREATMENT SUCCESS (%) a1995–2010YEARNUMBERNOTIFIEDSIZE OFCOHORTCOHORT AS% NOTIFIEDCURED COMPLETED DIED FAILED DEFAULTEDNOTEVALUATEDAlbania 1995 139 –2000 171 –2005 196 196 100 43 35 4 2 5 112008 170 170 100 52 39 4 1 2 42009 171 171 100 64 25 2 1 4 4• 0 91 • 2010 145 145 100 49 42 3 0 3 3Andorra 1995 –2000 1 2 200 50 50 02005 5 5 100 80 0 0 0 0 202008 3 3 100 33 67 0 0 0 02009 2 3 150 33 67 0 0 0 0• 0 0 • 2010 0 0 –Armenia 1995 436 507 116 52 2 8 36 1 02000 621 447 72 81 6 4 3 7 02005 581 581 100 59 13 3 5 14 42008 487 487 100 62 11 5 6 10 72009 440 440 100 60 12 7 3 8 10• 55 72 • 2010 339 339 100 55 16 4 15 8 1Austria 1995 467 383 82 2 81 10 0 7 12000 324 298 92 0 73 9 0 6 112005 234 230 98 17 58 7 0 7 112008 380 – 7 40 10 13 9 212009 90 226 251 8 59 9 0 8 16• 82 65 • 2010 76 206 271 6 59 6 0 6 23Azerbaijan 1995 669 538 80 58 7 12 19 42000 890 890 100 89 0 1 2 3 42005 1 561 1 561 100 48 11 4 4 12 222008 1 409 1 392 99 48 8 3 2 10 292009 1 487 1 480 100 47 15 3 7 16 12• 65 77 • 2010 1 997 1 733 87 43 33 3 4 11 5Belarus 1995 1 845 –2000 2 547 –2005 1 235 –2008 1 060 1 902 179 68 3 9 7 3 102009 1 201 2 160 180 64 0 10 4 1 20• 0 66 • 2010 1 269 2 184 172 66 0 8 22 1 2Belgium 1995 400 –2000 409 358 88 25 41 10 1 17 62005 380 304 80 21 45 10 0 0 242008 311 502 161 20 55 7 4 9 42009 280 485 173 14 62 8 0 11 4• 0 0 • 2010 244 –Bosnia and 1995 865 865 100 97 1 0 1 1 1Herzegovina 2000 759 756 100 77 18 1 1 2 12005 640 1 035 162 93 3 1 0 0 22008 509 757 149 87 5 4 1 1 12009 609 852 140 97 2 0 0 0 0• 97 0 • 2010 441 –Bulgaria 1995 1 087 –2000 2 524 –2005 1 214 1 342 111 82 3 4 2 7 12008 1 020 1 193 117 79 5 6 2 6 12009 894 1 055 118 78 7 9 2 4 1• 0 86 • 2010 806 946 117 84 2 8 2 3 1Croatia 1995 1 204 –2000 –2005 372 391 105 40 7 7 0 1 452008 328 602 184 46 11 18 3 2 192009 302 234 77 48 15 26 0 3 7• 0 75 • 2010 183 181 99 58 17 14 0 4 7Cyprus 1995 6 6 100 100 0 0 0 0 02000 4 –2005 9 8 89 38 25 12 0 0 252008 6 12 200 33 25 8 17 172009 14 28 200 29 0 0 0 0 71• 100 0 • 2010 8 –Czech Republic 1995 487 487 100 57 3 0 3 2 352000 420 396 94 59 11 17 1 1 112005 308 315 102 62 10 6 0 2 202008 249 470 189 67 1 21 3 6 22009 218 402 184 66 2 21 0 7 4• 60 0 • 2010 200 –Denmark 1995 128 –2000 171 110 64 37 49 5 0 0 92005 129 128 99 44 39 6 1 2 82008 106 200 189 16 25 1 1 1 562009 101 175 173 22 31 4 1 1 42• 0 0 • 2010 115 –Estonia 1995 369 –2000 255 257 101 67 2 11 1 6 122005 162 162 100 70 2 8 1 10 102008 144 259 180 59 1 15 18 6 12009 135 240 178 57 1 15 2 6 18• 0 68 • 2010 99 191 193 65 3 10 2 4 17Finland 1995 244 –2000 205 –2005 130 –2008 104 170 163 46 26 16 6 1 52009 93 227 244 33 34 17 0 1 14• 0 74 • 2010 82 184 224 48 27 9 0 2 15France 1995 3 449 –2000 1 815 –2005 1 941 –2008 1 222 –2009 1 019 –• 0 0 • 2010 960 –Georgia 1995 221 221 100 41 18 8 3 29 22000 601 807 134 38 25 3 9 25 02005 1 509 1 489 99 60 13 3 5 13 72008 1 868 2 196 118 53 20 3 12 8 42009 2 055 2 352 114 57 19 3 12 7 3• 58 76 • 2010 2 140 2 500 117 59 17 3 12 7 2Germany 1995 3 852 –2000 454 – 61 16 16 1 2 42005 1 379 1 199 87 39 32 9 0 2 182008 954 2 126 223 33 34 12 7 2 112009 1 025 2 220 217 33 44 12 0 1 9• 0 77 • 2010 910 2 064 227 32 44 12 0 2 9a TREATMENT SUCCESS = percent cured + percent completed then rounded to the nearest digit.EUROPEAN REGIONGLOBAL TUBERCULOSIS REPORT 2012 Data can be downloaded from www.who.int/tb/data 225
TREATMENT SUCCESS (%) a1995–2010YEARNUMBERNOTIFIEDSIZE OFCOHORTCOHORT AS% NOTIFIED% OF COHORTCURED COMPLETED DIED FAILED DEFAULTEDNOTEVALUATEDGreece 1995 –2000 235 –2005 197 –2008 80 –2009 198 –• 0 0 • 2010 178 –Greenland 1995 –2000 –2005 –2008 –2009 24 –• 0 0 • 2010 38 –Hungary 1995 796 –2000 412 651 158 28 36 10 3 12 112005 423 412 97 32 13 13 12 9 202008 346 602 174 32 21 11 20 7 92009 363 597 164 45 12 10 19 7 7• 0 0 • 2010 270 –Iceland 1995 2 2 100 0 100 0 0 0 02000 1 2 200 0 100 0 0 0 02005 2 2 100 0 100 0 0 0 02008 2 5 250 80 202009 3 4 133 0 75 0 0 0 25• 100 88 • 2010 6 16 267 0 88 6 0 0 6Ireland 1995 –2000 138 73 53 33 51 12 0 4 02005 130 107 82 3 62 9 3 1 222008 123 188 153 7 69 7 2 152009 95 188 198 5 62 9 0 1 23• 0 62 • 2010 84 164 195 0 62 7 0 0 31Israel 1995 –2000 216 336 156 65 18 15 0 0 12005 142 227 160 69 15 11 0 3 22008 95 178 187 78 11 10 0 1 12009 119 202 170 72 14 10 0 1 3• 0 76 • 2010 103 99 96 69 7 11 0 0 13Italy 1995 1 413 295 21 73 6 3 2 11 42000 687 223 32 37 36 1 0 9 162005 1 275 –2008 938 –2009 885 –• 80 0 • 2010 586 –Kazakhstan 1995 3 022 –2000 8 903 8 781 99 76 3 5 10 3 32005 6 911 6 884 100 70 1 5 12 5 82008 6 193 6 167 100 64 0 4 26 4 22009 5 213 5 355 103 62 0 4 30 3 2• 0 61 • 2010 4 769 4 919 103 61 0 3 7 2 27Kyrgyzstan 1995 832 –2000 1 296 1 233 95 73 9 3 4 5 62005 1 972 1 897 96 81 4 3 5 5 22008 1 712 1 640 96 80 5 3 6 5 22009 1 609 1 543 96 79 4 3 4 6 4• 0 0 • 2010 1 645 –Latvia 1995 504 475 94 61 0 9 3 21 72000 637 637 100 68 4 12 3 7 72005 536 536 100 72 1 11 1 7 82008 400 1 471 368 32 0 4 5 2 572009 367 592 161 72 3 9 1 5 11• 61 76 • 2010 339 596 176 72 3 8 1 6 10Lithuania 1995 979 –2000 776 776 100 73 10 4 12 22005 964 958 99 70 0 11 3 11 62008 884 1 764 200 51 31 7 3 7 02009 742 1 033 139 73 0 10 2 9 6• 0 68 • 2010 719 959 133 68 0 11 1 11 8Luxembourg 1995 37 – 100 0 0 0 0 02000 21 –2005 14 0 02008 0 –2009 –• 100 0 • 2010 0 14 – 0 0 7 0 0 93Malta 1995 5 5 100 80 20 0 0 0 02000 5 4 80 0 100 0 0 0 02005 5 5 100 0 100 0 0 0 02008 15 20 133 60 15 252009 12 10 83 0 80 0 0 0 20• 100 20 • 2010 4 5 125 0 20 0 0 0 80Monaco 1995 –2000 0 –2005 –2008 –2009 –• 0 0 • 2010 –Montenegro 2005 64 63 98 10 21 702008 65 65 100 52 32 5 0 2 92009 53 78 147 49 37 8 0 4 387 • 2010 39 39 100 46 41 5 0 3 5Netherlands 1995 575 715 124 17 55 8 5 152000 289 301 104 23 53 6 0 3 152005 237 208 88 9 75 7 0 1 82008 189 467 247 14 71 7 1 72009 203 454 224 11 69 9 0 3 8• 72 78 • 2010 176 469 266 1 76 7 0 4 12Norway 1995 62 87 140 43 34 14 1 8 02000 37 37 100 49 22 14 3 3 112005 48 47 98 62 30 2 0 4 22008 53 105 198 62 22 6 4 72009 42 146 348 45 37 4 1 0 13• 77 0 • 2010 49 –Poland 1995 6 955 –2000 3 180 214 7 50 22 11 6 6 52005 2 823 2 823 100 65 12 5 1 9 82008 2 650 4 228 160 54 20 7 0 10 92009 2 658 4 391 165 48 19 5 0 10 17• 0 65 • 2010 2 484 3 998 161 47 18 6 0 9 20a TREATMENT SUCCESS = percent cured + percent completed then rounded to the nearest digit.226 Data can be downloaded from www.who.int/tb/data GLOBAL TUBERCULOSIS REPORT 2012
% OF COHORTTREATMENT SUCCESS (%) a1995–2010YEARNUMBERNOTIFIEDSIZE OFCOHORTCOHORT AS% NOTIFIEDCURED COMPLETED DIED FAILED DEFAULTEDNOTEVALUATEDPortugal 1995 2 019 1 240 61 45 23 4 4 4 192000 1 863 1 924 103 9 71 6 0 5 92005 1 302 1 393 107 13 76 6 0 4 22008 1 053 1 683 160 11 77 3 2 72009 1 043 1 565 150 9 75 6 0 3 7• 69 0 • 2010 912 –Republic of 1995 665 –Moldova 2000 651 651 100 1 62 0 0 0 372005 1 696 1 690 100 60 2 9 11 11 72008 1 533 1 533 100 54 7 11 8 12 82009 1 318 1 318 100 49 5 10 17 14 5• 0 57 • 2010 1 267 1 267 100 52 5 11 5 13 13Romania 1995 10 469 11 597 111 38 13 6 7 6 312000 10 202 10 158 100 28 42 4 8 8 92005 10 801 10 929 101 71 11 5 4 6 42008 9 511 10 082 106 72 13 5 4 5 22009 8 987 10 737 119 72 14 4 4 6 1• 51 84 • 2010 7 951 9 445 119 70 14 5 4 6 2Russian 1995 37 512 54 0 54 11 15 6 11 4Federation 2000 27 467 3 616 13 64 4 6 13 9 42005 32 605 25 692 79 55 3 13 14 11 42008 33 949 32 356 95 54 3 12 18 9 42009 33 351 32 316 97 52 3 11 20 8 5• 65 53 • 2010 31 416 30 123 96 50 3 12 23 7 5San Marino 1995 –2000 1 1 100 0 0 100 0 0 02005 –2008 –2009 –• 0 0 • 2010 –Serbia 2005 1 105 1 154 104 72 13 5 1 5 42008 1 172 1 391 119 80 6 7 2 4 22009 1 055 1 392 132 80 6 6 1 4 286 • 2010 977 702 72 80 5 7 1 4 2Serbia & 1995 1 497 1 956 131 34 18 2 3 10 33Montenegro 2000 0 267 – 82 7 4 0 6 1Slovakia 1995 788 807 102 64 16 4 162000 236 238 101 81 0 14 1 2 12005 162 158 98 66 26 6 0 1 12008 126 498 395 47 46 5 1 1 02009 121 174 144 82 0 14 0 2 2• 64 84 • 2010 112 177 158 84 0 12 0 3 1Slovenia 1995 303 270 89 64 26 4 2 1 32000 145 145 100 33 51 8 0 5 32005 109 109 100 47 38 12 0 1 32008 81 159 196 38 42 15 1 2 22009 85 149 175 24 63 9 1 1 3• 90 85 • 2010 64 123 192 28 57 11 0 1 3Spain 1995 2 605 –2000 3 423 –2005 2 511 –2008 2 333 –2009 2 236 –• 0 70 • 2010 2 076 3 574 172 39 32 6 0 1 23Sweden 1995 102 –2000 118 112 95 0 79 11 0 2 82005 134 133 99 0 74 6 1 1 182008 97 221 228 87 6 1 1 42009 107 255 238 0 85 6 0 1 8• 0 85 • 2010 117 289 247 70 15 5 0 1 9Switzerland 1995 185 –2000 86 –2005 84 –2008 64 –2009 74 –• 0 0 • 2010 82 –Tajikistan 1995 1 042 348 33 69 18 7 3 2 02000 434 665 153 74 3 15 8 0 02005 1 745 1 729 99 74 9 4 6 7 02008 2 057 2 044 99 76 7 4 7 5 12009 1 972 1 972 100 75 6 4 8 5 1• 88 80 • 2010 2 290 2 290 100 76 4 5 11 3 1The Former 1995 319 222 70 61 9 13 9 9 0Yugoslav Republic 2000 167 152 91 51 35 4 2 7 1of Macedonia 2005 178 179 101 62 22 2 0 14 02008 188 188 100 81 7 7 1 2 12009 198 199 101 85 5 4 2 5 0• 70 90 • 2010 141 143 101 83 7 4 3 2 1Turkey 1995 4 383 –2000 4 315 3 461 80 0 73 3 0 6 192005 7 450 7 450 100 45 44 2 0 5 32008 6 993 6 993 100 59 33 3 1 3 22009 6 007 6 007 100 61 30 3 1 2 3• 0 91 • 2010 5 375 5 375 100 63 29 3 1 3 2Turkmenistan 1995 544 544 100 55 18 11 7 2 72000 1 017 1 017 100 79 2 9 6 3 12005 995 995 100 70 14 6 4 5 12008 1 331 1 331 100 83 1 6 6 5 12009 1 370 1 375 100 83 1 5 6 5 1• 73 0 • 2010 1 153 –Ukraine 1995 8 263 9 564 116 83 6 7 42000 10 738 –2005 –2008 14 574 14 407 99 56 6 12 12 9 52009 13 632 13 111 96 52 7 13 16 8 3• 83 60 • 2010 9 976 13 279 133 51 9 13 17 8 3United Kingdom of 1995 –Great Britain and 2000 1 204 –Northern Ireland 2005 1 821 1 348 74 0 68 7 0 1 242008 1 286 6 510 506 78 4 1 162009 1 256 2 569 205 0 82 6 0 5 7• 0 81 • 2010 1 201 2 602 217 0 81 5 0 6 8Uzbekistan 1995 2 735 2 598 95 78 0 9 7 4 32000 3 825 1 030 27 27 53 3 6 5 62005 5 695 5 336 94 72 9 6 6 7 12008 5 117 5 117 100 75 6 6 6 4 32009 4 959 4 959 100 77 5 6 5 5 3• 78 81 • 2010 4 711 4 711 100 76 5 6 6 5 3a TREATMENT SUCCESS = percent cured + percent completed then rounded to the nearest digit.EUROPEAN REGIONGLOBAL TUBERCULOSIS REPORT 2012 Data can be downloaded from www.who.int/tb/data 227
TREATMENT SUCCESS (%) a1995–2010YEARNUMBERNOTIFIEDSIZE OFCOHORTCOHORT AS% NOTIFIED% OF COHORTCURED COMPLETED DIED FAILED DEFAULTEDNOTEVALUATEDAlbania 1995 53 –2000 19 –2005 43 30 70 37 37 3 0 10 132008 32 28 88 39 36 14 4 4 42009 21 21 100 38 38 10 0 10 5• 0 90 • 2010 30 30 100 43 47 3 0 7 0Andorra 1995 –2000 0 –2005 0 –2008 0 0 –2009 2 2 100 0 100 0 0 0 0• 0 0 • 2010 0 0 –Armenia 1995 38 6 16 50 0 0 17 33 02000 76 54 71 52 15 7 7 19 02005 327 327 100 13 28 7 12 37 42008 618 534 86 15 36 8 15 21 52009 542 542 100 9 54 8 4 15 10• 50 67 • 2010 451 451 100 5 62 6 10 13 4Austria 1995 –2000 30 10 33 0 80 0 0 0 202005 26 27 104 11 56 11 0 11 112008 11 – 9 27 9 36 182009 25 37 148 3 38 5 0 30 24• 0 59 • 2010 29 29 100 14 45 0 0 0 41Azerbaijan 1995 47 –2000 74 74 100 59 7 5 11 14 42005 3 200 1 314 41 28 9 6 6 13 382008 3 733 3 084 83 18 32 4 6 23 172009 2 384 1 687 71 39 14 6 9 19 13• 0 63 • 2010 1 997 4 194 210 14 49 3 4 15 15Belarus 1995 343 –2000 825 –2005 1 049 –2008 849 815 96 29 30 9 8 3 202009 878 616 70 38 4 13 7 1 37• 0 48 • 2010 1 114 792 71 20 28 10 36 1 5Belgium 1995 80 –2000 89 55 62 16 45 13 0 15 112005 68 47 69 17 21 19 0 0 432008 67 42 63 7 48 10 14 19 22009 76 – 11 57 9 0 12 12• 0 0 • 2010 87 –Bosnia and 1995 130 –Herzegovina 2000 193 122 63 79 15 3 1 2 02005 156 106 68 85 8 4 1 2 12008 67 77 115 70 5 22 1 1 02009 113 116 103 52 32 5 3 3 5• 0 0 • 2010 101 –Bulgaria 1995 –2000 383 –2005 201 198 99 57 10 7 11 14 22008 313 500 160 16 7 4 3 5 652009 372 384 103 32 38 12 5 8 5• 0 64 • 2010 348 348 100 32 31 13 6 12 5Croatia 1995 42 –2000 –2005 94 92 98 20 13 9 1 1 572008 36 –2009 62 22 35 27 23 36 5 5 5• 0 76 • 2010 43 37 86 59 16 14 3 8Cyprus 1995 0 –2000 0 –2005 3 2 67 0 100 0 0 0 02008 3 5 167 40 20 402009 3 6 200 17 0 0 0 0 83• 0 0 • 2010 0 –Czech Republic 1995 21 –2000 25 38 152 53 11 8 3 0 262005 34 31 91 16 39 3 0 3 392008 61 56 92 46 16 21 5 5 52009 62 – 34 34 18 0 2 13• 0 0 • 2010 51 –Denmark 1995 6 –2000 28 15 54 27 60 7 0 0 72005 29 22 76 27 64 5 0 5 02008 37 32 86 16 44 3 382009 10 42 420 12 40 2 2 0 43• 0 0 • 2010 46 –Estonia 1995 71 –2000 116 59 51 54 2 3 0 3 372005 94 89 95 21 20 3 4 26 252008 90 88 98 36 10 9 23 20 12009 80 82 102 34 17 15 6 9 20• 0 40 • 2010 79 81 103 28 11 11 2 15 32Finland 1995 –2000 29 –2005 22 –2008 19 14 74 36 21 21 212009 14 – 29 7 0 0 0 64• 0 46 • 2010 15 13 87 38 8 0 0 0 54France 1995 –2000 0 –2005 371 –2008 379 –2009 –• 0 0 • 2010 315 –Georgia 1995 196 298 152 8 24 12 9 45 22000 681 470 69 23 31 10 8 29 02005 2 152 2 037 95 19 35 7 10 23 62008 1 677 1 542 92 20 29 6 23 14 72009 566 1 521 269 26 34 5 17 15 3• 32 62 • 2010 1 409 1 421 101 26 35 5 17 11 4Germany 1995 –2000 63 – 51 21 16 3 5 52005 493 432 88 30 36 9 0 7 182008 441 190 43 30 29 8 9 5 182009 252 344 137 21 44 12 0 5 17• 0 72 • 2010 367 364 99 25 47 12 1 6 10a TREATMENT SUCCESS = percent cured + percent completed then rounded to the nearest digit.228 Data can be downloaded from www.who.int/tb/data GLOBAL TUBERCULOSIS REPORT 2012
% OF COHORTTREATMENT SUCCESS (%) a1995–2010YEARNUMBERNOTIFIEDSIZE OFCOHORTCOHORT AS% NOTIFIEDCURED COMPLETED DIED FAILED DEFAULTEDNOTEVALUATEDGreece 1995 –2000 48 –2005 74 –2008 84 –2009 3 –• 0 0 • 2010 44 –Greenland 1995 –2000 –2005 –2008 –2009 6 –• 0 0 • 2010 12 –Hungary 1995 –2000 371 122 33 16 20 15 9 11 302005 347 333 96 12 37 13 8 11 182008 285 126 44 29 14 10 28 9 102009 211 208 99 35 26 13 12 6 8• 0 0 • 2010 254 –Iceland 1995 0 –2000 1 1 100 0 100 0 0 0 02005 1 –2008 0 1 – 100 02009 1 1 100 0 100 0 0 0 0• 0 0 • 2010 0 0 –Ireland 1995 –2000 22 10 45 40 0 10 10 40 02005 40 14 35 7 57 7 0 0 292008 41 51 124 6 45 6 2 412009 16 52 325 4 58 8 0 0 31• 0 38 • 2010 31 34 110 0 38 15 0 3 44Israel 1995 –2000 8 8 100 12 25 62 0 0 02005 7 7 100 71 14 14 0 0 02008 4 4 100 0 75 0 0 25 02009 9 9 100 56 11 11 0 0 22• 0 80 • 2010 4 5 125 80 0 20 0 0 0Italy 1995 31 – 42 6 26 10 13 32000 625 26 4 31 15 4 12 8 312005 293 –2008 292 –2009 –• 48 0 • 2010 74 –Kazakhstan 1995 1 320 –2000 5 093 2 901 57 62 4 10 14 5 52005 15 009 4 085 27 46 1 13 14 6 192008 9 229 8 662 94 24 18 10 32 7 82009 9 371 9 392 100 22 27 9 34 6 3• 0 47 • 2010 9 213 8 734 95 23 24 9 4 5 35Kyrgyzstan 1995 127 –2000 555 278 50 59 15 8 8 6 42005 847 845 100 40 31 8 9 11 12008 756 897 119 36 34 6 10 9 42009 758 924 122 28 43 7 6 7 9• 0 0 • 2010 987 –Latvia 1995 118 –2000 375 205 55 39 2 19 3 8 292005 205 205 100 50 1 10 1 9 292008 152 293 193 28 0 7 13 2 502009 147 148 101 43 1 14 0 14 28• 0 62 • 2010 109 110 101 60 2 6 0 12 20Lithuania 1995 128 –2000 509 282 55 45 0 21 8 22 52005 460 455 99 27 2 25 4 22 192008 357 354 99 40 22 18 19 12009 404 404 100 30 0 24 5 22 20• 0 32 • 2010 364 364 100 31 1 18 4 22 25Luxembourg 1995 –2000 4 –2005 0 –2008 0 –2009 –• 0 0 • 2010 0 0 –Malta 1995 0 –2000 0 1 – 0 100 0 0 0 02005 1 1 100 0 100 0 0 0 02008 7 4 57 50 502009 2 2 100 0 50 0 0 0 50• 0 33 • 2010 3 3 100 0 33 0 0 0 67Monaco 1995 –2000 0 –2005 –2008 –2009 –• 0 0 • 2010 –Montenegro 2005 27 10 37 20 20 602008 10 10 100 70 10 10 0 10 02009 11 11 100 45 27 9 0 0 1886 • 2010 12 14 117 50 36 0 0 0 14Netherlands 1995 –2000 70 18 26 28 22 6 0 6 392005 44 28 64 11 68 4 0 7 112008 49 47 96 6 32 6 2 532009 46 49 107 4 67 2 0 4 22• 0 66 • 2010 43 44 102 5 61 9 0 7 18Norway 1995 28 –2000 12 3 25 33 0 67 0 0 02005 14 9 64 44 33 22 0 0 02008 27 28 104 29 43 7 14 72009 30 – 33 47 13 0 0 7• 0 0 • 2010 42 –Poland 1995 1 071 –2000 882 56 6 64 12 14 0 4 52005 1 077 985 91 22 31 6 0 32 92008 1 020 720 71 43 21 7 1 16 122009 688 942 137 30 32 5 0 14 18• 0 61 • 2010 899 899 100 28 33 8 0 10 21EUROPEAN REGIONa TREATMENT SUCCESS = percent cured + percent completed then rounded to the nearest digit.GLOBAL TUBERCULOSIS REPORT 2012 Data can be downloaded from www.who.int/tb/data 229
TREATMENT SUCCESS (%) a1995–2010YEARNUMBERNOTIFIEDSIZE OFCOHORTCOHORT AS% NOTIFIED% OF COHORTCURED COMPLETED DIED FAILED DEFAULTEDNOTEVALUATEDPortugal 1995 268 133 50 38 17 6 6 9 242000 481 209 43 10 66 4 0 7 142005 350 293 84 8 66 10 1 9 62008 292 178 61 7 69 5 7 122009 271 265 98 7 62 7 0 8 16• 55 0 • 2010 228 –Republic of 1995 148 –Moldova 2000 374 1 0 0 0 0 100 0 02005 1 777 1 713 96 22 19 13 16 17 132008 1 865 1 865 100 16 18 18 12 20 162009 1 663 1 663 100 15 20 15 26 20 4• 0 32 • 2010 1 689 1 702 101 15 17 14 5 17 32Romania 1995 1 077 –2000 3 770 2 605 69 24 20 9 20 17 112005 6 938 6 737 97 39 13 10 10 14 142008 6 012 4 656 77 40 10 10 14 17 82009 5 401 5 391 100 38 19 10 12 16 4• 0 55 • 2010 5 115 5 118 100 37 18 11 12 17 5Russian 1995 12 – 42 17 25 8 8 0Federation 2000 18 147 1 694 9 25 24 10 21 9 112005 35 153 10 855 31 33 4 16 26 16 52008 94 070 18 070 19 33 3 13 29 14 72009 32 569 16 726 51 31 3 13 32 12 9• 58 34 • 2010 45 980 14 609 32 31 4 12 33 12 9San Marino 1995 –2000 0 –2005 –2008 –2009 –• 0 0 • 2010 –Serbia 2005 300 284 95 46 26 10 2 12 32008 280 309 110 49 27 10 1 7 62009 203 244 120 61 13 9 0 12 575 • 2010 200 172 86 56 19 10 1 10 4Serbia & 1995 198 –Montenegro 2000 203 21 10 67 10 10 0 14 0Slovakia 1995 20 –2000 120 46 38 78 0 11 2 4 42005 108 101 94 50 38 7 0 3 32008 98 170 173 28 20 5 1 1 462009 79 79 100 34 48 14 1 0 3• 0 84 • 2010 55 55 100 44 40 15 0 0 2Slovenia 1995 30 –2000 47 24 51 29 46 4 0 12 82005 29 27 93 44 41 4 0 4 72008 16 22 138 5 32 9 14 412009 8 8 100 12 75 0 0 0 12• 0 64 • 2010 11 11 100 18 45 36 0 0 0Spain 1995 –2000 0 –2005 1 078 –2008 461 –2009 –• 0 56 • 2010 324 351 108 25 31 9 0 2 33Sweden 1995 11 –2000 40 9 22 0 78 0 0 11 112005 30 16 53 0 75 0 0 0 252008 37 28 76 75 4 7 142009 45 – 0 69 13 0 7 11• 0 75 • 2010 52 52 100 21 54 2 0 0 23Switzerland 1995 5 –2000 63 –2005 49 –2008 53 –2009 51 –• 0 0 • 2010 40 –Tajikistan 1995 370 –2000 –2005 2 189 1 762 80 29 47 9 8 6 12008 1 846 1 881 102 32 43 9 8 6 22009 533 1 618 304 29 43 11 10 6 1• 0 72 • 2010 985 1 732 176 33 38 11 11 4 1The Former 1995 25 –Yugoslav Republic 2000 16 –of Macedonia 2005 103 97 94 24 33 7 2 32 22008 56 56 100 34 38 11 2 12 42009 56 56 100 39 39 7 2 11 2• 0 65 • 2010 52 52 100 29 37 17 4 12 2Turkey 1995 –2000 808 –2005 2 550 1 593 62 24 46 5 2 12 112008 1 689 1 692 100 30 44 4 2 9 102009 1 445 1 459 101 29 44 3 2 9 13• 0 69 • 2010 1 368 1 368 100 25 43 5 2 7 17Turkmenistan 1995 67 –2000 1 965 495 25 66 9 7 11 6 12005 142 142 100 42 26 13 10 9 02008 281 737 262 63 18 7 7 5 02009 –• 0 0 • 2010 82 –Ukraine 1995 1 889 –2000 3 210 –2005 –2008 2 093 7 152 342 31 10 16 21 13 82009 5 477 10 424 190 18 29 14 22 12 5• 0 0 • 2010 5 114 –United Kingdom of 1995 –Great Britain and 2000 0 –Northern Ireland 2005 460 147 32 0 57 4 0 3 362008 413 –2009 791 – 0 79 7 0 5 9• 0 74 • 2010 576 576 100 0 74 7 0 7 12Uzbekistan 1995 –2000 347 764 220 20 55 8 8 9 02005 9 015 3 999 44 28 41 9 7 14 12008 5 087 5 046 99 24 48 10 7 9 32009 2 451 2 451 100 30 39 11 7 9 5• 0 73 • 2010 4 596 4 527 98 25 48 10 5 9 4a TREATMENT SUCCESS = percent cured + percent completed then rounded to the nearest digit.230 Data can be downloaded from www.who.int/tb/data GLOBAL TUBERCULOSIS REPORT 2012
–% OF TB PATIENTS WITHKNOWN HIV STATUS2005–2011YEAR% OF TBPATIENTS WITHKNOWN HIVSTATUSNUMBER OF TBPATIENTS WITHKNOWN HIVSTATUSPATIENTSNOTIFIED(NEW ANDRETREAT)NUMBER OFHIV-POSITIVETB PATIENTS% OF TESTEDTB PATIENTSHIV-POSITIVE% OF HIV-POSITIVE TBPATIENTS ONCPT% OF HIV-POSITIVE TBPATIENTS ONARTNUMBER OFHIV-POSITIVEPEOPLEPROVIDED IPTAlbania 2005 15 81 540 1 12009 47 211 447 6 3 67 100 32010 42 186 445 0 0 5• 15 39 • 2011 39 170 431 2 1 100 100Andorra 2005 102009 0 0 9 0 02010 0 0 7 0– 0 • 2011 0 0 4 0Armenia 2005 12 270 2 322 6 2 83 332009 26 521 2 006 17 3 53 35 02010 70 1 242 1 780 17 1 47 41• 12 95 • 2011 95 1 499 1 582 49 3 80Austria 2005 9542009 7072010 688– – 2011 687Azerbaijan 2005 7 9202009 10 4172010 8 394 62– – 2011 9 817 41Belarus 2005 6 357 1392009 95 5 227 5 511 190 42010 93 5 153 5 554 190 4 257– 93 • 2011 93 4 747 5 118 217 5 32Belgium 2005 82 937 1 144 52 62009 91 930 1 020 43 52010 87 969 1 115 66 7• 82 – 2011 845 44 5Bosnia and 2005 2 160Herzegovina 2009 0 0 1 772 0 02010 0 0 1 390 0– 0 • 2011 0 0 1 385 0 0Bulgaria 2005 1 23 3 3022009 40 1 155 2 911 1 0 0 0 92010 67 1 773 2 649 2 0 0 100• 1 71 • 2011 71 1 698 2 407 5 0 0 100Croatia 2005 1 1442009 8552010 695 1 1– – 2011 619 4 3Cyprus 2005 0 0 37 02009 552010 61• 0 – 2011 1Czech Republic 2005 19 189 1 007 2 12009 23 161 702 6 42010 26 177 678 5 3• 19 – 2011Denmark 2005 424 82009 61 207 339 9 42010 0 0 359 0– – 2011Estonia 2005 94 490 519 33 7 02009 92 380 411 40 11 0 57 02010 91 298 329 34 11 47• 94 92 • 2011 92 313 341 47 15 55Finland 2005 1 3 361 3 1002009 533 62010 1 3 327 3 100• 1 1 • 2011 1 3 325 3 100France 2005 5 3742009 2 8902010 24 1 233 5 116 121 10– – 2011Georgia 2005 10 674 6 448 13 2 54 1002009 22 1 289 5 978 33 3 55 552010 32 1 841 5 796 35 2 63 77• 10 46 • 2011 46 2 550 5 533 50 2 56 76 61Germany 2005 6 0452009 4 4322010 4 330– – 2011 4 264Greece 2005 7672009 5882010 489– – 2011Greenland 20052009 100 63 63 0 02010 116– – 2011Hungary 2005 2 0242009 0 0 1 448 22010 0 1 1 741 1 100 100– – 2011 1 1 100 100Iceland 2005 91 10 11 1 10 100 1002009 58 7 12 0 0 02010 95 21 22 1 5 0 0• 91 100 • 2011 100 9 9 0 0Ireland 2005 6 28 461 11 392009 26 125 488 11 92010 23 98 427 15 15• 6 22 • 2011 22 94 430 19 20Israel 2005 85 316 372 17 52009 83 288 347 22 8 362010 90 308 343 13 4• 85 92 • 2011 92 384 418 24 6Italy 2005 4 1372009 3 8772010 3 249– – 2011 2 894Kazakhstan 2005 77 31 187 40 429 183 1 41 82009 97 29 597 30 578 325 1 11 7 1 0272010 84 23 854 28 550 333 1 26 8 1 063• 77 97 • 2011 97 22 480 23 076 352 2 20 9 1 329EUROPEAN REGIONGLOBAL TUBERCULOSIS REPORT 2012 Data can be downloaded from www.who.int/tb/data 231
–% OF TB PATIENTS WITHKNOWN HIV STATUS2005–2011YEAR% OF TBPATIENTS WITHKNOWN HIVSTATUSNUMBER OF TBPATIENTS WITHKNOWN HIVSTATUSPATIENTSNOTIFIED(NEW ANDRETREAT)NUMBER OFHIV-POSITIVETB PATIENTS% OF TESTEDTB PATIENTSHIV-POSITIVE% OF HIV-POSITIVE TBPATIENTS ONCPT% OF HIV-POSITIVE TBPATIENTS ONARTNUMBER OFHIV-POSITIVEPEOPLEPROVIDED IPTKyrgyzstan 2005 6 7652009 100 6 358 6 358 88 1 100 22 582010 3 183 6 295 183 100 68 37– 2 • 2011 2 153 6 254 4Latvia 2005 85 1 226 1 443 53 4 552009 85 830 977 73 9 60 02010 80 748 934 71 9 76• 85 – 2011 885 71 41 66Lithuania 2005 2 574 72009 2 081 142010 1 938 19– – 2011 1 904Luxembourg 2005 372009 272010 29– – 2011 26Malta 2005 4 1 23 0 02009 86 38 44 4 112010 81 26 32 3 12 0• 4 91 • 2011 91 30 33 5 17 4Monaco 200520092010 1– – 2011Montenegro 2005 5 8 170 0 02009 76 91 120 0 0 02010 74 84 114 1 1 0 100• 5 82 • 2011 82 92 112 0 0Netherlands 2005 22 252 1 157 61 242009 33 380 1 160 42 11 542010 38 413 1 073 48 12 21• 22 46 • 2011 46 460 1 007 31 7Norway 2005 0 0 2902009 3632010 339• 0 – 2011Poland 2005 9 2802009 0 27 8 236 27 1002010 0 22 7 509 22 100– 0 • 2011 0 26 8 478 26 100Portugal 2005 70 2 485 3 536 571 232009 86 2 455 2 871 392 16 100 1002010 65 1 720 2 626 303 18 100 100• 70 – 2011Republic of 2005 103 6 469 6 278 9 0Moldova 2009 91 5 107 5 591 260 52010 95 5 192 5 447 308 6 10 31 0• 103 94 • 2011 94 5 017 5 341 285 6Romania 2005 37 10 860 29 347 160 12009 28 6 443 23 267 214 3 38 82 1882010 37 7 833 21 078 241 3 41 89 133• 37 46 • 2011 46 8 870 19 218 240 3 33 88 145Russian 2005 55 85 537 154 379 3 533 4Federation 2009 100 156 222 156 222 7 064 5 77 10 4512010 84 669 162 553 3 633 199• 55 – 2011 79 494 159 479 4 104San Marino 200520092010– – 2011Serbia 2005 0 3 3 468 3 100 433 4002009 0 5 2 595 5 100 1002010 1 16 2 385 12 75 0 100 4• 0 3 • 2011 3 67 2 216 6 9 0 100Slovakia 2005 95 720 760 1 0 0 1002009 99 500 506 1 0 0 100 02010 100 439 439 1 0 100 100 0• 95 100 • 2011 100 399 399 0 0Slovenia 2005 38 107 278 0 02009 71 134 188 0 02010 76 130 172 1 1• 38 77 • 2011 77 147 192 0 0Spain 2005 8 3592009 47 3 599 7 592 425 122010 69 4 909 7 089 456 9– 67 • 2011 67 4 542 6 762 415 9Sweden 2005 0 0 5692009 6272010 675• 0 – 2011 586Switzerland 2005 5632009 5542010 548– – 2011 578Tajikistan 2005 9 670 7 526 1 0 0 02009 50 3 714 7 482 49 1 0 45 02010 53 4 049 7 641 100 2 73 54 0• 9 82 • 2011 82 6 241 7 609 115 2 70 57 315The Former 2005 0 2 658 2 100 0 100Yugoslav Republic 2009 9 43 473 0 0 0of Macedonia 2010 9 39 420 0 0 0• 0 12 • 2011 12 45 362 0 0 0Turkey 2005 0 0 21 303 02009 0 1 17 402 1 1002010 4 581 16 551 14 2 36 64• 0 46 • 2011 46 7 241 15 679 29 0 48 93Turkmenistan 2005 3 2912009 3 1572010 100 3 230 3 230 0 0– – 2011Ukraine 2005 39 608 1 526 02009 86 33 424 38 901 3 771 11 57 32 4 9802010 95 34 621 36 409 5 752 17 39 5 029– 74 • 2011 74 31 776 42 676 5 893 19 44United Kingdom of 2005 8 633Great Britain and 2009 9 040Northern Ireland 2010 8 483 378– – 2011 8 963Uzbekistan 2005 124 35 801 28 891 147 0 0 02009 100 21 453 21 453 357 2 25 10 1 0562010 100 20 330 20 330 427 2 92 37• 124 100 • 2011 100 15 913 15 913 546 3 96 32 2 630232 Data can be downloaded from www.who.int/tb/data GLOBAL TUBERCULOSIS REPORT 2012
YEARTOTALCONFIRMEDCASES OFMDR-TB aESTIMATED CASESOF MDR-TB AMONGNOTIFIEDESTIMATED CASESOF MDR-TB AMONGNOTIFIEDNEW PULMONARY CASESNUMBER OFBACT+VE bTESTED FORMDR-TB% OFBACT+VE bTESTED FORMDR-TBESTIMATED CASESOF MDR-TB AMONGNOTIFIEDPREVIOUSLY TREATED CASESNUMBER OF% OF NOTIFIEDNOTIFIEDTESTED FORTESTED FORMDR-TBMDR-TBAlbania 2005 1 161 75 12 282009 0 119 58 9 432010 2 186 76 19 632011 5 7.8 (1.6–14) 2.9 (0.36–10) 194 87 4.9 (1.1–11) 11 61Andorra 2005 0 9 150 –2009 0 2 67 1 502010 0 4 100 0 –2011 0 0 (0–0) 0 (0–1.8) 1 100 0 (0–0.98) 1 100Armenia 2005 162 576 99 182 562009 156 480 110 200 372010 177 361 87 99 222011 79 250 (220–280) 86 (65–110) 439 96 170 (140–190) 90 24Austria 2005 13 570 110 16 622009 22 265 110 23 922010 15 203 99 15 522011 19 12 (3.9–19) 7.7 (2.5–18) 257 95 4.0 (0.87–9.6) 11 55Azerbaijan 2005 800 453 29 366 112009 – –2010 552 801 19 960 482011 722 3 400 (3 200–3 700) 930 (790–1 100) – 2 500 (2 300–2 700) –Belarus 2005 – –2009 1342 2071 96 1754 2002010 1576 1972 90 1697 1502011 1594 2 000 (1 900–2 100) 1 200 (1 100–1 300) 2084 94 810 (780–850) 948 88Belgium 2005 11 588 89 41 602009 10 621 120 56 –2010 19 466 97 52 602011 15 – – – – –Bosnia and 2005 11 1035 100 106 68Herzegovina 2009 2 854 100 66 582010 2 600 100 47 472011 7 3.3 (0–7.9) 1.9 (
YEARTOTALCONFIRMEDCASES OFMDR-TB aESTIMATED CASESOF MDR-TB AMONGNOTIFIEDESTIMATED CASESOF MDR-TB AMONGNOTIFIEDNEW PULMONARY CASESNUMBER OFBACT+VE bTESTED FORMDR-TB% OFBACT+VE bTESTED FORMDR-TBESTIMATED CASESOF MDR-TB AMONGNOTIFIEDPREVIOUSLY TREATED CASESNUMBER OF% OF NOTIFIEDNOTIFIEDTESTED FORTESTED FORMDR-TBMDR-TBLatvia 2005 160 873 100 182 892009 131 618 100 134 912010 87 613 100 102 942011 105 120 (96–140) 89 (70–110) 562 96 28 (19–39) 82 85Lithuania 2005 338 1293 100 440 962009 322 1074 100 404 1002010 310 959 100 360 992011 296 360 (320–390) 170 (140–200) 1031 100 190 (170–210) 369 100Luxembourg 2005 0 36 110 –2009 0 – –2010 0 17 120 0 –2011 2 0.14 (
MALEFEMALEYEAR 0–14 15–24 25–34 35–44 45–54 55–64 65+0–14 15–24 25–34 35–44 45–54 55–64 65+UN-KNOWNUN-KNOWNMALE:FEMALERATIOAlbania 1995 0 0 0 0 19 40 30 0 1 0 0 13 20 16 1.82000 2 19 21 14 24 19 16 3 11 10 8 8 5 11 2.12005 0 26 21 16 31 20 37 0 0 3 9 5 5 5 18 0 3.42010 0 28 17 14 16 16 15 0 2 11 7 6 3 2 8 0 2.72011 0 29 26 18 30 9 22 0 1 14 10 6 2 1 12 0 2.9Andorra 1995 –2000 0 0 1 0 0 0 0 –2005 0 0 1 1 0 0 0 0 0 1 1 1 0 0 0 0 0.672010 0 0 0 0 0 0 0 0 0 0 0 0 0 0 0 0 –2011 0 0 0 0 1 0 0 0 0 0 0 0 0 0 0 0 –Armenia 1995 1 18 16 11 10 8 1 1 1 7 2 1 1 5.02000 2 152 130 131 63 26 21 1 24 27 24 8 8 4 5.52005 3 170 104 83 84 30 24 0 3 27 21 10 11 4 7 0 6.02010 0 36 75 49 68 27 15 0 1 24 17 4 7 8 8 0 3.92011 0 28 65 52 71 42 8 0 0 19 16 9 7 7 5 0 4.2Austria 1995 4 37 95 82 89 71 73 6 22 52 32 21 18 59 2.12000 1 17 30 59 42 23 41 1 11 22 12 11 6 22 2.52005 1 32 23 22 41 24 30 0 0 13 11 8 3 5 10 0 3.52010 0 4 4 12 13 8 10 0 1 5 4 2 2 5 6 0 2.02011 0 8 11 9 13 11 13 0 0 11 6 4 1 3 4 0 2.2Azerbaijan 1995 0 13 29 14 6 4 1 0 5 18 0 0 0 0 2.92000 0 9 24 33 42 30 0 0 3 3 6 3 0 0 9.22005 77 109 297 215 209 187 88 0 90 64 98 47 32 24 24 0 3.12010 0 328 371 267 280 30 27 3 141 100 57 73 9 18 3.22011 –Belarus 1995 –2000 –2005 71 180 273 287 118 62 25 53 50 43 11 62 4.12010 0 65 173 224 293 163 58 0 1 28 52 56 37 28 91 0 3.32011 1 53 156 228 290 138 48 3 37 67 47 39 27 83 3.0Belgium 1995 3 23 49 63 52 54 102 3 12 24 32 17 10 34 2.62000 3 20 57 39 55 32 56 6 15 15 19 4 13 27 2.62005 1 26 50 32 27 15 47 0 2 27 31 15 12 4 23 0 1.72010 4 20 39 30 29 21 19 0 6 13 18 19 11 5 10 0 2.02011 –Bosnia and 1995 0 15 61 90 140 139 100 0 40 67 64 49 77 23 1.7Herzegovina 2000 4 56 82 99 66 58 77 4 30 46 29 29 48 124 1.42005 1 22 58 61 78 44 80 1 2 35 39 33 28 28 130 0 1.22010 1 27 37 34 61 46 51 0 0 27 19 16 10 18 94 0 1.42011 2 33 32 52 75 61 62 0 3 17 27 17 13 25 128 0 1.4Bulgaria 1995 –2000 0 13 16 20 3 9 10 0 11 14 7 3 4 6 1.62005 9 98 150 195 195 150 136 0 9 90 111 59 29 37 70 0 2.32010 1 40 115 143 133 90 65 0 3 42 59 43 23 15 34 0 2.72011 2 38 100 110 122 92 61 0 2 41 40 36 28 14 30 0 2.7Croatia 1995 6 38 97 210 132 178 141 10 50 57 57 38 60 130 2.02000 –2005 1 24 27 48 72 47 34 0 1 12 18 15 11 6 56 0 2.12010 0 10 19 18 38 25 24 1 3 8 4 2 1 30 2.72011 0 12 5 20 31 31 21 0 0 12 14 14 8 7 26 0 1.5Cyprus 1995 0 1 1 0 1 1 2 0 1 1 1 2 0 1 1.02000 –2005 0 3 1 1 1 0 1 0 0 1 0 0 0 0 0 0 7.02010 0 2 1 0 0 0 0 0 0 0 3 1 0 0 0 1 0.602011 –Czech Republic 1995 2 10 22 83 88 53 90 0 9 11 20 13 19 88 2.22000 0 7 31 52 89 61 59 0 15 13 9 10 7 57 2.72005 0 8 24 57 55 45 46 0 0 3 14 16 7 5 28 0 3.22010 0 12 19 36 29 29 19 0 0 6 10 11 7 2 20 0 2.62011 –Denmark 1995 0 7 16 28 18 9 11 2 7 13 8 4 3 2 2.32000 5 10 20 24 16 11 14 5 16 15 14 6 7 8 1.42005 0 12 12 18 23 9 7 0 2 11 5 13 9 3 5 0 1.72010 0 8 22 10 13 16 2 0 0 4 5 15 8 8 4 0 1.62011 –Estonia 1995 –2000 0 6 31 53 56 35 15 0 9 11 14 11 4 10 3.32005 0 9 25 19 40 12 7 0 0 6 11 8 11 6 8 0 2.22010 0 3 7 21 25 12 8 0 0 3 5 3 3 6 3 0 3.32011 0 4 22 16 14 18 13 0 0 4 8 12 3 3 6 0 2.4Finland 1995 1 1 10 25 28 24 61 1 1 6 7 4 10 65 1.62000 0 3 8 22 19 28 53 0 1 5 3 4 6 49 2.02005 1 5 4 3 14 11 25 0 0 3 4 1 0 6 20 0 1.92010 0 10 6 8 9 8 18 0 0 3 2 4 1 2 11 0 2.62011 0 1 4 4 7 11 27 0 1 2 3 5 3 1 13 0 1.9France 1995 30 156 431 502 414 297 496 36 138 226 176 90 92 365 2.12000 10 136 248 247 211 125 244 18 108 127 89 46 43 155 2.12005 12 127 212 222 196 134 205 0 16 104 134 82 56 38 180 0 1.82010 10 60 139 114 99 76 110 0 10 47 76 49 45 25 97 0 1.72011 –Georgia 1995 2 20 30 25 40 18 12 2 8 17 17 18 7 5 2.02000 4 76 111 113 63 45 28 1 49 37 33 17 10 5 2.92005 0 226 272 268 207 76 60 4 109 105 58 46 17 47 2.92010 5 340 529 341 264 143 77 0 5 135 118 62 52 28 41 0 3.92011 5 271 478 333 251 139 93 0 8 136 132 59 32 35 54 0 3.4Germany 1995 14 179 453 539 460 442 625 17 115 251 167 89 104 397 2.42000 –2005 6 59 113 171 167 92 167 0 4 51 104 73 43 37 103 0 1.92010 1 43 92 97 141 87 136 0 3 44 63 61 38 26 76 0 1.92011 1 43 95 106 141 68 127 0 2 44 90 59 54 26 85 0 1.6Greece 1995 –2000 1 10 22 32 24 19 46 0 2 9 10 5 6 25 2.72005 1 14 25 22 14 12 23 5 0 13 18 8 7 2 17 0 1.82010 1 19 27 20 18 19 22 3 3 2 13 4 4 4 15 1 2.82011 –Greenland 1995 –2000 –2005 –2010 0 5 7 5 5 2 2 0 1 5 0 0 4 2 0 0 2.22011 –Hungary 1995 –2000 0 8 24 85 104 58 27 1 7 17 19 22 10 30 2.92005 0 6 24 67 117 67 39 0 1 5 13 11 22 15 33 0 3.22010 1 9 15 36 51 52 23 0 0 9 16 14 9 15 20 0 2.32011 –EUROPEAN REGIONGLOBAL TUBERCULOSIS REPORT 2012 Data can be downloaded from www.who.int/tb/data 235
MALEFEMALEYEAR 0–14 15–24 25–34 35–44 45–54 55–64 65+0–14 15–24 25–34 35–44 45–54 55–64 65+UN-KNOWNUN-KNOWNMALE:FEMALERATIOIceland 1995 0 0 0 0 0 0 1 0 0 0 0 0 0 1 1.02000 0 1 –2005 0 0 0 1 0 0 1 0 0 0 0 0 0 0 0 0 –2010 0 0 1 0 3 0 0 0 0 0 1 1 0 0 0 0 2.02011 0 0 0 0 0 0 0 0 0 0 0 0 0 0 1 0 –Ireland 1995 –2000 0 10 7 7 6 4 12 0 13 8 13 6 7 15 0.742005 1 6 10 21 10 7 6 0 0 9 10 3 3 0 8 0 1.82010 0 8 18 4 11 5 11 0 0 7 8 2 3 2 5 0 2.12011 0 7 9 10 11 7 8 0 0 8 7 7 8 2 1 0 1.6Israel 1995 –2000 0 20 26 23 23 13 38 0 3 10 16 6 3 3 32 0 2.02005 1 4 15 18 15 5 26 0 0 6 14 7 7 5 19 0 1.42010 1 13 28 12 8 4 6 0 0 1 8 10 2 0 10 0 2.32011 0 29 30 11 5 9 9 0 0 10 10 7 4 4 7 0 2.2Italy 1995 9 59 202 157 94 124 289 7 52 93 57 40 51 168 2.02000 12 63 96 75 58 54 112 6 38 58 33 13 19 39 2.32005 8 93 191 137 101 61 115 24 3 80 145 56 25 19 70 9 1.82010 14 40 75 66 32 31 58 2 25 41 57 41 22 22 54 6 1.22011 13 32 47 50 36 23 58 1 10 31 51 40 17 14 52 1 1.2Kazakhstan 1995 –2000 36 1 057 1 409 1 379 923 439 218 84 999 1 079 599 275 202 204 1.62005 31 917 1 142 983 795 274 175 0 46 751 767 436 286 121 187 0 1.72010 15 675 754 595 511 251 127 0 33 566 520 263 205 122 132 0 1.62011 6 602 716 516 515 235 91 0 15 439 495 260 190 109 117 0 1.6Kyrgyzstan 1995 3 109 171 165 65 38 30 1 70 94 34 18 15 19 2.32000 4 128 227 205 115 52 46 6 128 146 100 41 30 29 1.62005 1 247 303 269 194 66 84 0 15 215 236 141 70 33 98 0 1.42010 5 261 260 188 141 64 48 0 5 223 199 98 71 40 42 0 1.42011 6 225 204 179 168 77 41 0 13 200 191 84 60 50 39 0 1.4Latvia 1995 0 20 44 71 70 40 30 0 22 49 55 47 27 29 1.22000 0 53 106 124 111 64 34 2 25 41 27 28 7 15 3.42005 1 22 71 104 117 55 34 0 0 17 31 31 23 18 12 0 3.12010 0 20 44 65 71 39 15 0 0 6 19 25 12 10 13 0 3.02011 0 11 42 58 50 33 18 0 0 7 16 19 14 12 13 0 2.6Lithuania 1995 4 46 132 225 176 90 77 5 6 53 45 32 16 42 3.82000 1 38 97 145 155 74 68 0 20 37 39 32 22 48 2.92005 0 42 118 186 187 108 67 0 1 25 41 57 49 23 54 0 2.82010 1 34 75 128 157 89 54 0 1 20 36 31 43 18 32 0 3.02011 1 25 52 126 158 77 55 0 0 20 31 37 38 16 45 0 2.6Luxembourg 1995 –2000 –2005 0 0 2 2 1 1 2 0 0 0 2 1 1 1 0 0 1.62010 0 0 0 0 0 0 0 0 0 0 0 0 0 0 0 0 –2011 0 1 0 0 1 1 0 0 0 1 0 0 0 0 0 0 3.0Malta 1995 0 0 0 1 0 0 0 0 0 1 0 0 1 2 0.252000 0 1 0 1 1 0 1 –2005 0 1 1 1 1 1 0 0 0 0 0 0 0 0 0 0 –2010 0 0 3 0 0 0 0 0 0 0 1 0 0 0 0 0 3.02011 0 2 4 0 0 0 0 0 0 1 0 0 0 0 0 0 6.0Monaco 1995 –2000 –2005 –2010 –2011 –Montenegro 2005 0 3 5 7 15 4 8 0 0 0 7 3 4 0 8 0 1.92010 0 1 1 4 4 7 1 0 1 3 3 2 3 1 8 0 0.862011 0 1 2 8 11 7 3 0 1 4 2 4 3 1 1 0 2.0Netherlands 1995 22 79 119 75 28 9 10 24 56 50 13 10 8 7 2.02000 0 34 63 41 25 10 21 4 29 22 16 9 5 10 2.02005 0 23 42 23 26 14 19 0 3 14 19 11 9 1 4 0 2.42010 0 22 29 22 20 9 17 0 1 9 14 13 5 4 11 0 2.12011 2 22 35 19 23 14 13 0 2 13 13 7 7 4 3 0 2.6Norway 1995 0 4 8 6 3 5 12 0 4 7 2 0 3 8 1.62000 0 1 9 3 6 2 4 1 3 1 2 5 2.12005 0 9 4 6 4 4 3 0 0 4 7 2 1 0 3 0 1.82010 0 9 9 7 1 4 2 0 0 5 7 3 2 0 0 0 1.92011 –Poland 1995 3 122 295 795 565 369 377 4 129 163 225 111 107 414 2.22000 1 99 303 812 782 361 434 1 99 158 211 170 82 421 2.42005 3 109 199 389 639 292 310 0 3 95 142 112 151 63 316 0 2.22010 3 70 205 310 574 393 237 0 2 59 118 82 104 82 245 0 2.62011 5 69 187 314 560 439 275 0 1 67 96 90 130 99 255 0 2.5Portugal 1995 11 215 363 328 200 173 164 7 139 172 87 33 42 85 2.62000 8 147 375 349 208 140 140 5 114 154 87 41 25 64 2.82005 5 85 227 284 181 90 93 5 7 67 109 66 29 11 42 1 2.92010 3 55 110 199 152 70 76 0 3 54 62 54 36 10 28 0 2.72011 –Republic of 1995 0 55 115 166 95 65 15 2 42 38 31 19 10 12 3.3Moldova 2000 2 52 31 36 13 13 6 1 16 32 45 23 14 6 1.12005 2 211 337 345 313 106 31 0 3 97 92 57 61 23 18 0 3.82010 0 119 243 244 248 113 21 0 6 47 90 46 47 23 20 0 3.52011 2 94 257 250 267 107 21 0 3 66 79 51 41 20 14 0 3.6Romania 1995 387 1 662 2 322 3 608 2 587 1 751 784 355 1 352 1 240 871 479 396 417 2.62000 46 832 1 508 1 799 1 684 916 533 53 701 766 484 341 207 321 2.52005 36 752 1 511 1 786 1 999 952 638 4 55 758 780 493 374 219 442 2 2.52010 21 669 865 1 336 1 293 895 567 0 40 503 477 400 275 172 438 0 2.42011 19 623 807 1 189 1 099 833 540 0 27 473 513 403 212 198 426 0 2.3Russian 1995 –Federation 2000 1 295 526 596 402 151 54 1 43 73 74 38 31 44 6.72005 –2010 8 2 228 6 276 5 571 5 361 2 787 920 0 28 1 247 2 554 1 719 1 182 745 790 0 2.82011 15 1 826 5 726 5 338 4 928 2 664 845 36 1 139 2 394 1 643 1 166 719 752 2.7San Marino 1995 –2000 1 –2005 –2010 –2011 –Serbia 2005 3 62 96 118 156 112 132 0 6 69 76 55 49 22 149 0 1.62010 2 76 70 93 116 83 109 0 5 66 74 46 39 34 164 0 1.32011 2 60 73 74 122 112 101 0 5 46 59 43 30 20 129 0 1.6Serbia & 1995 10 108 204 317 296 350 386 11 127 167 133 83 158 275 1.8Montenegro 2000 –Slovakia 1995 4 18 44 123 108 63 152 5 16 17 22 24 33 159 1.92000 2 6 15 31 50 16 32 0 5 9 7 5 4 54 1.82005 0 3 13 16 25 25 20 0 0 1 8 9 5 6 27 0 1.82010 1 7 7 18 17 17 15 0 0 1 6 7 2 3 11 0 2.72011 0 6 8 6 20 16 13 0 0 2 3 4 6 1 11 0 2.6236 Data can be downloaded from www.who.int/tb/data GLOBAL TUBERCULOSIS REPORT 2012
MALEFEMALEYEAR 0–14 15–24 25–34 35–44 45–54 55–64 65+0–14 15–24 25–34 35–44 45–54 55–64 65+UN-KNOWNUN-KNOWNMALE:FEMALERATIOSlovenia 1995 1 13 39 63 36 26 27 0 7 24 11 9 5 42 2.12000 0 3 11 36 22 14 17 0 3 9 3 4 3 20 2.52005 0 4 10 16 15 11 14 0 0 4 4 6 5 4 16 0 1.82010 0 4 7 10 9 6 12 0 0 1 5 2 4 1 3 0 3.02011 0 3 9 16 12 8 5 0 0 0 5 4 2 1 17 0 1.8Spain 1995 22 132 337 242 150 112 228 23 90 129 64 39 34 98 2.62000 –2005 13 166 394 367 230 140 230 2 10 142 252 151 63 24 108 2 2.12010 6 139 306 291 286 146 184 1 14 130 251 151 54 23 76 0 1.92011 15 135 325 292 277 162 197 2 15 142 249 161 75 30 100 0 1.8Sweden 1995 1 5 12 8 5 4 27 0 10 13 5 5 4 14 1.22000 0 9 10 12 11 4 25 1 9 8 10 2 2 15 1.52005 0 7 21 16 10 5 16 0 1 10 15 12 5 3 13 0 1.32010 1 10 28 8 5 5 13 0 2 9 16 11 4 2 3 0 1.52011 1 14 15 12 8 3 8 0 0 12 9 10 2 2 3 0 1.6Switzerland 1995 0 12 23 26 23 13 27 1 13 20 9 1 2 15 2.02000 0 5 17 10 7 6 6 0 1 8 11 7 2 1 5 0 1.52005 2 8 10 11 11 2 7 0 0 6 11 8 3 1 4 0 1.52010 0 6 12 9 6 5 8 0 0 7 15 6 4 1 3 0 1.32011 2 8 16 10 13 7 3 0 2 6 13 2 4 2 2 0 1.9Tajikistan 1995 –2000 –2005 8 308 279 164 104 54 48 0 26 225 185 151 89 43 53 0 1.22010 12 398 366 214 129 93 74 0 23 320 272 111 109 87 82 0 1.32011 8 343 365 181 128 75 77 0 31 314 229 104 100 105 114 0 1.2The Former 1995 2 15 42 45 33 29 24 2 32 30 20 11 17 17 1.5Yugoslav Republic 2000 5 8 14 20 19 20 14 1 15 14 17 5 5 10 1.5of Macedonia 2005 2 14 20 23 20 18 13 1 2 17 13 10 7 5 13 0 1.72010 0 6 19 24 24 12 11 0 0 9 12 7 7 4 6 0 2.12011 3 17 11 19 21 10 6 0 1 14 9 6 3 1 11 0 1.9Turkey 1995 –2000 –2005 33 1 148 1 295 1 028 963 534 429 0 50 699 474 243 175 166 213 0 2.72010 23 631 779 703 778 514 407 0 33 485 384 193 141 101 203 0 2.52011 22 550 693 608 696 482 412 0 25 409 385 195 117 121 212 0 2.4Turkmenistan 1995 1 11 188 0 79 30 0 2 15 146 0 47 25 0 1.32000 16 103 185 144 127 31 21 19 73 140 76 31 34 17 1.62005 2 148 181 146 97 51 13 0 3 100 101 72 46 27 8 0 1.82010 1 130 212 183 141 51 26 2 112 112 74 46 38 25 1.82011 –Ukraine 1995 10 385 1 076 2 064 1 515 1 087 437 21 314 380 327 182 185 280 3.92000 21 693 1 552 2 385 2 007 1 062 532 41 487 590 447 298 218 405 3.32005 –2010 7 417 2 559 2.92011 8 539 1 991 2 209 1 796 881 377 0 11 348 741 603 388 230 380 0 2.9United Kingdom of 1995 –Great Britain and 2000 8 86 130 96 87 75 138 9 95 114 60 31 31 67 1.5Northern Ireland 2005 9 135 200 166 95 95 124 0 14 115 163 80 39 28 83 1 1.62010 7 132 169 135 108 60 108 0 15 110 131 81 42 40 58 0 1.52011 3 137 193 137 97 69 100 0 19 120 129 75 45 26 49 0 1.6Uzbekistan 1995 –2000 6 351 749 510 346 213 107 11 261 547 288 213 112 111 1.52005 25 596 831 723 522 263 313 40 538 597 375 288 217 367 1.42010 8 487 574 529 479 293 297 0 22 365 512 308 248 239 350 0 1.32011 8 378 493 453 440 306 253 0 11 335 418 233 245 293 332 0 1.2EUROPEAN REGIONGLOBAL TUBERCULOSIS REPORT 2012 Data can be downloaded from www.who.int/tb/data 237
SMEAR LABS % OF SMEARPER 100K LABS USINGPOPULATION LED aCULTURELABS PER 5MPOPULATIONLABORATORIESDST b LABSPER 5MPOPULATIONLPA c LABSPER 5MPOPULATIONNUMBER OFLABS USINGXPERT MTB/RIFSECOND-LINE DSTAVAILABLENRL dFREE THROUGH NTPTB DIAGNOSISFIRST-LINEDRUGSTB NOTIF.RIFAMPICINRATE PERUSED100 000THROUGHOUTHEALTH-CARETREATMENTWORKERSAlbania 0.5 0 1.6 1.6 1.6 0 No yesYes (if TB isconfirmed)yes YesAndorra 9.3 – 464.2 464.2In and outof countryyes Yes (all suspects) yes YesArmenia 1.0 0 1.6 1.6 1.6 0 In country yes Yes (all suspects) yes YesAustria –Azerbaijan 0.7 – 3.2 1.1 1.1 1 yes Yes (all suspects) yes YesBelarus 2.1 2 21.4 10.5 0.5 0 In country yes Yes (all suspects) yes Yes 49Belgium 1.1 – 53.0 7 3.7 6 yes Yes (all suspects) yes YesBosnia and Herzegovina 0.4 13 17.3 5.3 4 0Out ofcountryyes Yes (all suspects) yes YesBulgaria 0.5 – 22.2 8.7 2 0 In country yes Yes (all suspects) yes YesCroatia 0.3 0 15.9 6.8 1.1 1 yes Yes (all suspects) yes YesCyprus –Czech Republic 0.5 – 22.8 8.1 8.1 In country yes Yes (all suspects) yes YesDenmark –Estonia 0.4 40 7.5 7.5 7.5 2 In country yes Yes (all suspects) yes Yes 12Finland 0.4 – 10.2 0.9 4.6 3 yes Yes (all suspects) yes YesFrance – In country yes Yes (all suspects) yes YesGeorgia 0.7 – 2.3 1.2 1.2 1 In country yes Yes (all suspects) yes YesGermany 0.3 – 11.5 5.1 yes Yes (all suspects) yes YesGreece –Greenland –Hungary 0.1 0 6.5 3.5 1 2 In country yes Yes (all suspects) yes YesIceland 0.3 100 15.4 15.4 15.4 0Out ofYes (if TB isyescountryconfirmed)yes YesIreland 0.3 8 14.4 3.3 3.3 2Out ofcountryyes Yes (all suspects) No YesIsrael 0.3 – 12.6 1.3 0.7 1 In country yes Yes (all suspects) yes YesItaly –Kazakhstan 2.9 0 30.9 6.8 3.1 0 No yes Yes (all suspects) yes YesKyrgyzstan 2.3 0 3.7 2.8 yes Yes (all suspects) yes YesLatvia 0.7 0 8.9 2.2 2.2 1 In country yes Yes (all suspects) yes YesLithuania 0.4 0 9.1 9.1 3 5In and outof countryyes Yes (all suspects) yes Yes 32Luxembourg 0.2 100 9.7 9.7 9.7 1Out ofcountryyes Yes (all suspects) yes YesMalta 0.2 – 12.0 0 0Out ofcountryNo Yes (all suspects) yes YesMonaco –Montenegro 0.2 0 7.9 7.9 0 0Out ofYes (if TB isNocountryconfirmed)yes YesNetherlands 0.3 – 11.1 3 0.3 2 In country yes Yes (all suspects) No YesNorway 0.4 0 10.2 3 4.1 0In and outof countryyes Yes (all suspects) yes YesPoland 0.2 0 11.1 6.1 1.4 3 In country yes Yes (all suspects) yes YesPortugal –Republic of Moldova 1.7 – 5.6 5.6 4.2 yes Yes (all suspects) yes YesRomania 0.5 0 16.3 10 0 0 In country yes Yes (all suspects) yes Yes 57Russian Federation 2.6 – 4.1 In country No Yes (all suspects) yes Yes 185San Marino –Serbia 0.3 0 14.7 2 0.5 0Out ofYes (if TB isyescountryconfirmed)yes Yes 11Slovakia
SOUTH-EAST ASIA REGIONTable A4.1 Estimates of the burden of disease caused by TB, 1990–2011 241Table A4.2 Incidence, notification and case detection rates, all forms, 1990–2011 242Table A4.3 Case notifi cations, 1990–2011 243Table A4.4 Treatment outcomes, new smear-positive cases, 1995–2010 244Table A4.5 Treatment outcomes, retreatment cases, 1995–2010 245Table A4.6 HIV testing and provision of CPT, ART and IPT, 2005–2011 246Table A4.7 Testing for MDR-TB and number of confi rmed cases of MDR-TB, 2005–2011 247Table A4.8 New smear-positive case notifi cation by age and sex, 1995–2011 248Table A4.9 Laboratories, NTP services, drug management and infection control, 2011 249
Estimates of mortality, prevalence and incidenceEstimated values are shown as best estimates followed by lower and upper bounds. The lower and upper bounds aredefined as the 2.5th and 97.5th centiles of outcome distributions produced in simulations. See Annex 1 for furtherdetails.Estimated numbers are shown rounded to two significant figures. Estimated rates are shown rounded to three significantfigures unless the value is under 100, in which case rates are shown rounded to two significant figures. Blank cellsindicate that estimates are not available.Estimates for all years are recalculated as new information becomes available and techniques are refined, so they maydiffer from those published in previous reports in this series. Estimates published in previous global TB control reportsshould no longer be used.Data sourceData shown in this annex are taken from the WHO global TB database on 25 September 2012. Data shown in the mainpart of the report were taken from the database in July 2012. As a result, data in this annex may differ slightly fromthose in the main part of the report.Data can be downloaded from www.who.int/tb/data.Country notesIndiaEstimates for India have not yet been officially approved by the Ministry of Health and Family Welfare, Government ofIndia and should therefore be considered provisional.240 Data can be downloaded from www.who.int/tb/data GLOBAL TUBERCULOSIS REPORT 2012
MORTALITY (EXCLUDING HIV) PREVALENCE (INCLUDING HIV) INCIDENCE (INCLUDING HIV)YEARPOPULATION(MILLIONS)NUMBER(THOUSANDS)RATE aNUMBER(THOUSANDS)RATE aNUMBER(THOUSANDS)Bangladesh 1990 105 64 (21–130) 61 (20–124) 530 (190–1 000) 501 (183–974) 240 (150–350) 225 (139–331)1995 117 70 (27–130) 60 (23–114) 580 (270–1 000) 496 (227–868) 260 (220–320) 225 (184–270)2000 130 74 (29–140) 57 (22–108) 620 (290–1 100) 481 (222–838) 290 (240–350) 225 (184–270)2005 141 71 (29–130) 51 (21–94) 620 (300–1 100) 444 (211–762) 320 (260–380) 225 (184–270)2009 147 68 (28–120) 46 (19–84) 610 (300–1 000) 416 (202–707) 330 (270–400) 225 (184–269)2010 149 68 (29–120) 45 (19–83) 610 (300–1 000) 413 (199–704) 330 (270–400) 225 (185–268)2011 150 68 (29–120) 45 (19–82) 620 (300–1 100) 411 (199–698) 340 (280–400) 225 (185–268)Bhutan 1990 < 1 1.2 (0.470–2.3) 219 (84–416) 10 (4.5–17) 1 780 (813–3 120) 4.4 (3.8–5.0) 784 (673–903)1995 < 1 0.68 (0.280–1.3) 131 (54–241) 5.9 (2.8–9.9) 1 130 (547–1 920) 2.9 (2.5–3.4) 561 (482–646)2000 < 1 0.44 (0.190–0.790) 78 (34–139) 4.1 (2.0–6.9) 718 (358–1 200) 2.3 (2.0–2.6) 402 (345–463)2005 < 1 0.36 (0.160–0.640) 55 (24–97) 3.3 (1.7–5.6) 505 (251–846) 1.9 (1.6–2.2) 287 (247–331)2009 < 1 0.22 (0.100–0.390) 31 (14–54) 2.3 (1.1–4.0) 326 (154–561) 1.6 (1.3–1.8) 220 (189–253)2010 < 1 0.18 (0.079–0.310) 24 (11–43) 2 (0.880–3.6) 279 (121–502) 1.5 (1.3–1.7) 206 (177–237)2011 < 1 0.13 (0.047–0.250) 17 (6.3–34) 1.7 (0.600–3.4) 230 (81–454) 1.4 (1.2–1.6) 192 (165–222)Democratic 1990 20 4.7 (4.4–5.1) 23 (22–25) 150 (56–300) 768 (278–1 500) 69 (43–100) 344 (212–508)People's Republic 1995 22 4.4 (4.1–4.8) 20 (19–22) 160 (74–280) 738 (341–1 280) 75 (61–90) 344 (282–414)of Korea 2000 23 3.9 (3.6–4.2) 17 (16–18) 150 (73–260) 669 (318–1 150) 79 (64–95) 344 (282–414)2005 24 3.3 (3.0–3.5) 14 (13–15) 140 (66–240) 582 (277–999) 82 (67–98) 344 (282–414)2009 24 2.2 (2.1–2.3) 9 (8.5–9.6) 100 (38–200) 431 (156–842) 84 (72–96) 345 (296–398)2010 24 1.9 (1.7–2.0) 7.7 (7.1–8.3) 92 (27–200) 377 (111–804) 84 (72–97) 345 (296–397)2011 24 1.6 (1.4–1.7) 6.4 (5.9–6.9) 100 (31–220) 422 (126–892) 84 (72–97) 345 (296–397)India 1990 874 340 (220–480) 38 (25–55) 4 100 (3 600–4 500) 465 (415–518) 1 900 (1 600–2 200) 216 (182–254)1995 964 370 (240–530) 38 (25–55) 4 500 (4 000–5 000) 465 (414–519) 2 100 (1 800–2 400) 216 (189–245)2000 1 054 410 (260–590) 39 (25–56) 4 600 (4 000–5 300) 438 (382–498) 2 300 (2 100–2 500) 216 (195–239)2005 1 140 410 (290–540) 36 (26–48) 4 200 (3 400–5 100) 365 (295–443) 2 400 (2 100–2 600) 209 (188–231)2009 1 208 350 (220–500) 29 (18–41) 3 500 (2 500–4 700) 289 (204–388) 2 300 (2 100–2 500) 190 (171–210)2010 1 225 320 (210–470) 27 (17–38) 3 300 (2 200–4 600) 269 (181–374) 2 300 (2 100–2 500) 185 (167–204)2011 1 241 300 (190–430) 24 (15–35) 3 100 (2 100–4 300) 249 (168–346) 2 200 (2 000–2 500) 181 (163–199)Indonesia 1990 184 98 (36–190) 53 (19–104) 820 (350–1 500) 445 (188–810) 380 (270–500) 206 (149–271)1995 199 120 (44–240) 61 (22–119) 970 (410–1 800) 485 (205–882) 410 (320–510) 205 (159–256)2000 213 120 (45–230) 56 (21–107) 970 (440–1 700) 457 (204–809) 440 (350–530) 204 (164–249)2005 227 85 (36–150) 37 (16–68) 790 (380–1 400) 349 (165–599) 450 (360–550) 199 (160–242)2009 237 68 (30–120) 29 (13–51) 700 (320–1 200) 293 (136–509) 450 (370–540) 191 (158–227)2010 240 66 (29–120) 28 (12–49) 680 (320–1 200) 285 (132–496) 450 (380–540) 189 (156–224)2011 242 65 (29–120) 27 (12–48) 680 (310–1 200) 281 (130–489) 450 (370–540) 187 (155–222)Maldives 1990 < 1 0.049 (0.042–0.058) 23 (19–26) 0.66 (0.240–1.3) 299 (107–586) 0.33 (0.200–0.480) 150 (92–221)1995 < 1 0.027 (0.023–0.031) 11 (9.1–13) 0.38 (0.170–0.670) 152 (68–269) 0.26 (0.220–0.300) 105 (90–122)2000 < 1 0.018 (0.013–0.024) 6.6 (4.7–8.8) 0.3 (0.130–0.540) 110 (49–196) 0.2 (0.160–0.240) 74 (60–89)2005 < 1
YEARPOPULATION(MILLIONS)INCIDENCE (INCLUDING HIV) INCIDENCE HIV-POSITIVE NOTIFIED NEW AND RELAPSE CASE DETECTIONNUMBER(THOUSANDS)RATE aNUMBER(THOUSANDS)RATE a NUMBER RATE a PERCENTBangladesh 1990 105 240 (150–350) 225 (139–331) 0.067 (0.041–0.099)
NEW AND RELAPSENOTIFICATION RATE a1990–2011YEARNEW ANDRELAPSENEW CASESSMEAR- SMEAR-NEGATIVE/POSITIVE UNKNOWNEXTRA-RE-TREAT EXCL.OTHER RELAPSEPULMONARY RELAPSETOTALRETREATHISTORYUNKNOWN% SMEAR-POS AMONGNEW PULMBangladesh 1990 48 673 –1995 56 437 20 524 19 297 2 060 729 729 522000 75 557 38 484 29 396 5 914 1 763 1 763 572005 123 118 84 848 23 076 11 318 3 876 3 876 792009 160 875 109 402 25 375 21 999 4 099 4 099 812010 153 892 105 772 21 625 23 506 0 2 989 4 806 7 795 0 83• 46 100 • 2011 150 899 98 948 21 921 27 329 0 2 701 4 665 7 366 3 459 82Bhutan 1990 1 154 –1995 1 299 367 657 265 10 10 362000 1 140 347 430 363 36 36 452005 1 007 308 272 387 40 11 51 532009 1 125 434 285 355 0 51 25 76 0 602010 1 311 457 275 518 0 61 21 82 0 62• 207 167 • 2011 1 235 382 225 573 0 55 15 70 0 63Democratic 1990 –People's Republic 1995 –of Korea 2000 34 131 16 440 13 801 3 787 103 103 542005 42 722 17 796 18 123 5 381 58 1 364 7 752 9 116 502009 76 336 29 366 32 491 12 232 0 2 247 12 329 14 576 472010 84 648 31 240 36 285 13 715 3 408 11 650 15 058 46• 0 374 • 2011 91 433 31 279 37 457 16 828 5 869 7 638 13 507 46India 1990 1 519 182 –1995 1 218 183 264 515 880 589 68 979 690 690 232000 1 115 718 349 374 650 345 98 006 17 993 80 072 98 065 352005 1 156 248 508 890 399 066 171 838 1 381 75 073 148 580 223 653 0 562009 1 351 913 624 617 384 113 233 026 1 796 108 361 181 395 289 756 622010 1 339 866 630 165 366 381 231 121 1 508 110 691 182 281 292 972 63• 174 107 • 2011 1 323 949 642 321 340 203 226 965 1 952 112 508 191 923 304 431 65Indonesia 1990 74 470 –1995 35 529 31 768 34 0 106 106 1002000 84 591 52 338 15 035 833 1 448 1 448 782005 254 601 158 640 85 373 6 142 4 446 4 446 652009 292 754 169 213 108 616 11 215 3 710 1 978 5 688 612010 300 659 183 366 101 247 11 659 0 4 387 2 202 6 589 0 64• 40 132 • 2011 318 949 197 797 101 750 14 054 5 348 2 359 7 707 66Maldives 1990 152 –1995 231 114 89 18 10 10 562000 132 65 31 32 4 0 4 682005 122 66 23 29 0 4 1 5 0 742009 100 45 13 41 0 1 4 5 0 782010 95 41 20 33 0 1 2 3 0 67• 69 27 • 2011 87 47 12 28 0 0 1 1 0 80Myanmar 1990 12 416 –1995 18 229 8 681 7 058 653 1 837 1 837 552000 30 840 17 254 8 659 2 304 2 623 2 623 672005 107 009 36 541 35 601 30 252 4 615 982 5 597 512009 128 343 41 357 50 919 31 509 4 558 5 159 9 717 452010 131 590 42 318 56 840 27 976 4 456 5 813 10 269 43• 32 283 • 2011 136 737 42 324 62 038 27 769 4 606 6 403 11 009 41Nepal 1990 10 142 –1995 19 804 8 591 7 938 2 489 786 786 522000 29 519 13 683 9 074 4 955 1 807 1 807 602005 33 448 14 617 9 474 7 013 0 2 344 629 2 973 612009 34 888 15 442 9 794 7 054 2 598 519 3 117 612010 35 114 15 569 9 718 7 210 0 2 617 495 3 112 0 62• 53 116 • 2011 35 434 15 000 9 662 7 484 926 2 362 520 2 882 0 61Sri Lanka 1990 6 666 2 769 3 241 656 461995 5 956 3 049 1 677 982 248 248 652000 8 413 4 314 2 261 1 561 277 372 649 662005 9 249 4 868 2 198 1 917 0 266 244 510 202 692009 9 314 4 764 1 996 2 358 196 213 409 261 702010 9 547 4 635 2 145 2 548 0 219 161 380 387 68• 38 46 • 2011 9 755 4 490 2 405 2 612 0 248 147 395 426 65Thailand 1990 46 510 –1995 45 428 20 273 22 606 1 419 1 130 1 130 472000 34 187 17 754 12 439 2 953 1 041 1 041 592005 57 895 29 762 18 837 7 501 1 795 1 795 612009 63 975 32 810 20 058 9 143 1 964 1 965 3 929 622010 66 397 33 450 20 927 10 135 0 1 885 1 111 2 996 731 62• 81 95 • 2011 65 824 33 169 20 726 10 014 0 1 915 1 852 3 767 0 62Timor-Leste 2005 3 767 1 035 2 142 554 36 16 52 332009 4 748 1 206 3 095 406 0 41 11 52 0 282010 –380 • 2011 4 386 1 610 2 401 337 0 38 31 69 0 40SOUTH-EAST ASIA REGIONaRates are per 100 000 population.GLOBAL TUBERCULOSIS REPORT 2012 Data can be downloaded from www.who.int/tb/data 243
TREATMENT SUCCESS (%) a1995–2010YEARNUMBERNOTIFIEDSIZE OFCOHORTCOHORT AS% NOTIFIED% OF COHORTCURED COMPLETED DIED FAILED DEFAULTEDNOTEVALUATEDBangladesh 1995 20 524 10 867 53 66 5 5 2 10 122000 38 484 38 484 100 77 4 4 1 9 52005 84 848 84 848 100 91 1 4 1 2 22008 106 373 106 089 100 90 2 4 1 2 22009 109 402 109 075 100 91 1 4 1 2 2• 71 92 • 2010 105 772 105 659 100 90 1 4 1 2 2Bhutan 1995 367 433 118 78 20 0 0 1 12000 347 347 100 75 15 4 3 3 02005 308 340 110 84 7 5 3 1 02008 351 354 101 89 2 3 3 0 32009 434 434 100 86 6 3 3 2 0• 97 90 • 2010 457 454 99 87 3 3 3 1 2Democratic 1995 –People's Republic 2000 16 440 14 571 89 73 9 3 7 5 3of Korea 2005 17 796 17 796 100 84 5 2 4 2 22008 28 026 28 026 100 83 6 2 4 2 22009 29 366 29 366 100 85 5 2 4 2 2• 0 90 • 2010 31 240 31 240 100 86 4 3 4 2 1India 1995 264 515 264 722 100 1 25 0 0 0 752000 349 374 349 328 100 31 4 1 1 7 572005 508 890 507 204 100 83 2 5 2 7 12008 615 977 615 977 100 85 2 4 2 6 12009 624 617 624 617 100 85 2 4 2 6 1• 25 88 • 2010 630 165 630 165 100 85 3 4 2 6 1Indonesia 1995 31 768 3 018 10 73 18 2 0 6 12000 52 338 52 338 100 70 17 2 1 4 52005 158 640 158 640 100 83 8 2 1 4 22008 166 376 166 376 100 83 8 2 1 4 22009 169 213 169 213 100 84 7 2 1 4 2• 91 90 • 2010 183 366 183 366 100 84 7 2 1 4 3Maldives 1995 114 114 100 96 2 3 0 0 02000 65 59 91 97 0 2 0 0 22005 66 70 106 86 0 6 0 3 62008 53 53 100 45 4 11 402009 45 45 100 47 0 2 2 4 44• 97 82 • 2010 41 44 107 82 0 9 2 0 7Myanmar 1995 8 681 7 872 91 53 14 4 4 18 72000 17 254 16 792 97 73 9 5 2 9 22005 36 541 36 652 100 77 7 6 3 5 22008 41 248 41 247 100 78 8 6 3 5 22009 41 357 41 811 101 77 8 6 3 5 2• 67 86 • 2010 42 318 42 200 100 77 8 5 3 4 2Nepal 1995 8 591 8 053 94 56 17 3 2 18 62000 13 683 12 992 95 79 5 5 1 7 22005 14 617 14 617 100 87 1 5 1 3 22008 14 640 14 640 100 86 3 4 1 3 32009 15 442 15 468 100 87 3 4 1 3 2• 73 90 • 2010 15 569 15 569 100 88 2 3 1 3 3Sri Lanka 1995 3 049 3 058 100 75 4 3 0 13 42000 4 314 4 314 100 75 4 4 1 15 22005 4 868 4 841 99 83 3 5 1 6 12008 4 683 4 646 99 81 4 6 2 7 12009 4 764 4 754 100 83 3 6 2 4 3• 79 86 • 2010 4 635 4 635 100 83 4 7 1 4 1Thailand 1995 20 273 20 273 100 36 28 2 0 9 242000 17 754 23 061 130 65 3 8 2 7 152005 29 762 29 919 101 70 5 8 2 7 92008 28 788 33 078 115 76 7 7 2 4 42009 32 810 27 597 84 81 5 7 1 3 2• 64 85 • 2010 33 450 30 317 91 79 6 7 2 3 2Timor-Leste 2005 1 035 1 035 100 61 21 5 1 11 22008 867 867 100 73 12 5 0 7 32009 1 206 –88 • 2010 1 530 – 80 8 4 1 4 4a TREATMENT SUCCESS = percent cured + percent completed then rounded to the nearest digit.244 Data can be downloaded from www.who.int/tb/data GLOBAL TUBERCULOSIS REPORT 2012
% OF COHORTTREATMENT SUCCESS (%) a1995–2010YEARNUMBERNOTIFIEDSIZE OFCOHORTCOHORT AS% NOTIFIEDCURED COMPLETED DIED FAILED DEFAULTEDNOTEVALUATEDBangladesh 1995 729 1 179 162 71 3 5 8 11 22000 1 763 1 815 103 70 2 4 2 7 142005 3 876 3 876 100 73 6 4 2 5 92008 6 991 –2009 4 099 6 637 162 66 16 6 2 5 6• 75 80 • 2010 7 795 7 814 100 47 33 5 2 5 8Bhutan 1995 10 22 220 50 9 0 23 14 52000 36 –2005 51 52 102 65 10 6 8 2 102008 70 70 100 76 3 3 16 1 12009 76 76 100 70 12 8 7 3 1• 59 84 • 2010 82 81 99 78 6 1 7 5 2Democratic 1995 –People's Republic 2000 103 1 285 1 248 75 11 2 4 2 5of Korea 2005 9 116 9 116 100 70 6 3 12 5 42008 14 170 14 170 100 75 8 3 10 3 22009 14 576 14 576 100 74 9 2 11 2 2• 0 84 • 2010 15 058 15 058 100 76 8 4 8 3 2India 1995 690 551 80 64 6 4 3 13 92000 98 065 48 133 49 55 15 7 5 16 22005 223 653 224 143 100 47 24 7 4 16 12008 289 285 289 285 100 45 29 7 4 13 22009 289 756 289 756 100 45 29 7 4 13 1• 70 74 • 2010 292 972 292 972 100 45 30 7 4 13 2Indonesia 1995 106 76 72 22 9 0 0 1 672000 1 448 2 530 175 50 22 3 3 7 152005 4 446 4 812 108 63 15 3 4 8 72008 5 430 5 430 100 50 21 4 3 14 72009 5 688 5 687 100 53 20 4 3 12 8• 32 73 • 2010 6 589 6 589 100 53 20 5 3 11 8Maldives 1995 10 –2000 4 5 125 100 02005 5 5 100 80 20 0 0 0 02008 2 0 02009 5 1 20 0 0 0 0 0 100• 0 0 • 2010 3 0 0Myanmar 1995 1 837 1 443 79 55 8 4 4 19 92000 2 623 3 001 114 65 9 7 4 12 32005 5 597 6 556 117 58 14 10 6 7 52008 9 009 8 631 96 46 27 12 5 7 32009 9 717 9 540 98 44 28 11 5 7 4• 64 73 • 2010 10 269 10 106 98 41 32 11 5 7 3Nepal 1995 786 –2000 1 807 2 047 113 73 3 4 8 7 42005 2 973 2 973 100 81 2 4 6 4 32008 2 954 1 954 66 71 4 10 5 5 52009 3 117 3 063 98 82 3 6 3 4 3• 0 85 • 2010 3 112 3 112 100 82 3 5 3 4 4Sri Lanka 1995 248 –2000 649 521 80 44 20 6 1 26 32005 510 504 99 67 5 5 2 18 32008 394 393 100 64 7 8 2 15 52009 409 408 100 66 7 8 1 13 5• 0 77 • 2010 380 380 100 71 6 7 2 9 4Thailand 1995 1 130 –2000 1 041 –2005 1 795 2 285 127 52 6 12 5 7 182008 3 956 3 468 88 54 12 9 4 7 142009 3 929 2 542 65 58 10 11 5 7 9• 0 66 • 2010 2 996 2 580 86 55 11 12 5 7 10Timor-Leste 2005 52 56 108 96 0 2 0 2 02008 35 35 100 57 14 11 6 11 02009 52 –86 • 2010 56 – 77 9 2 4 7 2SOUTH-EAST ASIA REGIONa TREATMENT SUCCESS = percent cured + percent completed then rounded to the nearest digit.GLOBAL TUBERCULOSIS REPORT 2012 Data can be downloaded from www.who.int/tb/data 245
–% OF TB PATIENTS WITHKNOWN HIV STATUS2005–2011YEAR% OF TBPATIENTS WITHKNOWN HIVSTATUSNUMBER OF TBPATIENTS WITHKNOWN HIVSTATUSPATIENTSNOTIFIED(NEW ANDRETREAT)NUMBER OFHIV-POSITIVETB PATIENTS% OF TESTEDTB PATIENTSHIV-POSITIVE% OF HIV-POSITIVE TBPATIENTS ONCPT% OF HIV-POSITIVE TBPATIENTS ONARTNUMBER OFHIV-POSITIVEPEOPLEPROVIDED IPTBangladesh 2005 0 0 123 1182009 1 1 446 160 875 1 0 100 1002010 1 1 778 158 698 4 0 100 100 64• 0 1 • 2011 1 1 900 159 023 81 4 100 100 0Bhutan 2005 0 0 1 018 1 0 02009 12 136 1 150 2 1 0 1002010 1 332• 0 – 2011 1 250Democratic 2005 50 474People's Republic 2009 0 0 88 665 0 0of Korea 2010 0 0 96 298 0– 0 • 2011 0 0 99 071 0India 2005 2 29 488 1 304 828 6 411 222009 17 258 037 1 533 308 36 483 14 89 502010 32 480 752 1 522 147 41 476 9 90 57• 2 45 • 2011 45 688 530 1 515 872 44 702 6 91 59Indonesia 2005 254 6012009 1 2 782 294 732 479 17 42 02010 1 2 751 302 861 1 106 40 63 29– 1 • 2011 1 3 511 321 308 1 280 36 92 42Maldives 2005 1232009 0 0 104 0 02010 0 0 97 0 0– 0 • 2011 0 0 88 0Myanmar 2005 2 2 109 107 991 611 29 50 31 02009 3 4 174 133 502 1 015 24 97 67 3332010 3 4 362 137 403 961 22 100 94 514• 2 3 • 2011 3 4 496 143 140 900 20 100 80 361Nepal 2005 0 0 34 0772009 35 4072010 0 0 35 609 0• 0 0 • 2011 0 0 35 954 0Sri Lanka 2005 9 695 2 0 02009 19 1 897 9 788 0 0 52010 10 1 015 10 095 13 1 100 54 3– 18 • 2011 18 1 832 10 328 21 1 71 100 7Thailand 2005 57 8952009 75 49 657 65 940 8 109 16 72 50 1272010 82 55 692 68 239 8 959 16 71 54– 74 • 2011 74 49 770 67 676 7 326 15 75 59Timor-Leste 2005 0 0 3 7832009 2 108 4 759 0 0 22010• 0 6 • 2011 6 276 4 417 4 1246 Data can be downloaded from www.who.int/tb/data GLOBAL TUBERCULOSIS REPORT 2012
YEARTOTALCONFIRMEDCASES OFMDR-TB aESTIMATED CASESOF MDR-TB AMONGNOTIFIEDESTIMATED CASESOF MDR-TB AMONGNOTIFIEDNEW PULMONARY CASESNUMBER OFBACT+VE bTESTED FORMDR-TB% OFBACT+VE bTESTED FORMDR-TBESTIMATED CASESOF MDR-TB AMONGNOTIFIEDPREVIOUSLY TREATED CASESNUMBER OFNOTIFIEDTESTED FORMDR-TB% OF NOTIFIEDTESTED FORMDR-TBBangladesh 2005 – –2009 – –2010 339 – 339 4.32011 509 3 800 (2 900–4 800) 1 700 (850–3 000) 71
MALEFEMALEYEAR 0–14 15–24 25–34 35–44 45–54 55–64 65+0–14 15–24 25–34 35–44 45–54 55–64 65+UN-KNOWNUN-KNOWNMALE:FEMALERATIOBangladesh 1995 29 505 983 1 001 748 648 424 64 309 546 360 236 132 38 2.62000 256 3 640 5 643 5 750 4 718 3 667 2 837 495 3 029 3 238 2 247 1 315 778 370 2.32005 524 8 170 10 443 11 423 11 038 8 476 7 453 751 6 776 6 785 5 538 3 960 2 281 1 230 2.12010 365 10 460 12 535 11 409 12 758 11 176 11 536 0 653 9 221 8 279 6 185 5 458 3 484 2 250 0 2.02011 309 9 606 11 616 10 152 11 728 10 746 11 301 0 623 8 849 7 679 5 683 4 946 3 457 2 253 0 2.0Bhutan 1995 2 42 65 36 35 24 11 12 43 44 25 12 9 8 1.42000 6 65 41 30 24 12 2 7 57 34 31 23 3 2 1.12005 1 47 58 26 23 14 12 9 45 38 13 11 9 2 1.42010 108 50 25 12 26 13 0 17 104 45 18 18 10 9 0 1.12011 2 88 39 26 14 20 19 2 92 40 19 12 4 5 1.2Democratic 1995 –People's Republic 2000 293 928 1 508 2 927 2 519 1 167 651 167 683 1 121 2 004 1 524 591 357 1.6of Korea 2005 167 1 409 2 422 2 688 2 040 1 185 485 166 1 127 1 756 1 890 1 381 764 336 1.42010 447 2 524 4 046 4 849 4 061 2 629 1 153 407 1 493 2 461 2 910 2 276 1 347 637 1.72011 314 2 218 4 066 5 493 4 542 2 474 1 024 227 1 390 2 264 3 093 2 409 1 271 494 1.8India 1995 16 334 391 287 216 123 68 32 179 169 80 49 30 11 2.62000 1 588 20 963 31 090 30 829 24 230 15 308 8 534 2 250 14 495 17 287 11 768 7 516 4 594 2 697 2.22005 3 185 62 620 74 678 76 870 64 843 43 038 24 726 6 292 45 136 45 629 28 577 17 042 10 513 5 408 2.22010 4 871 78 278 82 757 90 440 81 210 60 766 38 442 8 544 53 415 49 425 34 035 22 719 15 527 9 735 2.32011 4 649 78 096 82 762 89 706 82 921 63 625 42 443 8 336 53 958 49 227 34 698 23 977 17 182 10 731 2.2Indonesia 1995 6 203 297 306 302 228 109 16 160 244 282 192 90 33 1.42000 –2005 846 15 215 20 906 18 401 17 847 13 509 6 390 946 13 916 16 393 13 022 10 927 7 539 2 783 1.42010 714 16 501 24 645 21 090 20 977 17 329 7 910 0 816 14 800 17 838 14 629 13 142 9 524 3 451 0 1.52011 787 17 406 25 429 22 353 22 885 19 404 9 089 927 15 840 18 703 15 900 14 533 10 556 3 985 1.5Maldives 1995 1 28 11 10 8 10 6 1 13 8 4 6 6 2 1.82000 0 9 10 2 5 5 3 0 11 4 5 4 5 2 1.12005 0 9 8 5 6 6 5 1 10 7 1 2 2 4 1.42010 0 8 6 0 4 5 6 0 1 2 3 4 1 0 1 0 2.42011 0 12 7 3 8 1 3 0 0 4 3 1 2 1 2 0 2.6Myanmar 1995 42 713 1 423 1 401 977 677 298 58 535 729 729 450 343 154 1.82000 88 1 459 2 636 2 781 2 161 1 235 836 72 1 040 1 592 1 397 987 592 378 1.82005 132 3 401 5 877 5 888 4 585 2 557 1 764 147 2 376 3 047 2 563 2 101 1 218 885 2.02010 106 3 043 6 578 6 688 5 607 3 632 2 308 196 2 452 3 454 2 752 2 525 1 838 1 139 1.92011 120 2 923 6 182 6 319 5 680 3 954 2 500 187 2 401 3 317 2 760 2 554 2 010 1 407 1.9Nepal 1995 –2000 170 1 904 1 763 1 713 1 491 1 294 772 176 1 267 1 078 833 575 419 228 2.02005 148 1 946 1 685 1 722 1 806 1 759 820 195 1 208 1 111 797 658 532 230 2.12010 165 2 110 1 832 1 724 1 856 1 857 1 126 0 192 1 177 1 036 819 681 642 352 0 2.22011 245 1 914 1 755 1 723 1 732 1 710 1 180 0 247 1 182 978 752 624 604 354 0 2.2Sri Lanka 1995 10 163 361 519 521 365 261 15 207 206 142 122 81 56 2.72000 25 266 459 695 793 484 360 23 312 264 176 202 144 113 2.52005 9 341 520 724 918 657 424 19 295 261 189 200 154 130 2.92010 14 268 539 602 884 683 448 15 255 233 171 183 186 154 2.92011 12 246 459 585 828 653 479 0 13 270 217 191 192 191 154 0 2.7Thailand 1995 59 1 191 2 936 2 948 2 434 2 607 2 346 52 741 888 782 936 1 175 1 178 2.52000 27 859 2 570 2 380 2 117 1 908 2 213 32 624 1 035 780 873 1 016 1 321 2.12005 44 1 344 3 814 4 393 4 003 2 831 3 407 57 907 1 662 1 334 1 367 1 259 1 938 2.32010 55 1 506 3 695 5 253 5 042 3 625 4 189 82 1 087 1 930 1 749 1 467 1 494 2 276 2.32011 38 1 546 3 650 5 139 5 140 3 734 4 080 76 1 214 1 773 1 658 1 586 1 402 2 133 2.4Timor-Leste 2005 8 136 149 116 119 52 47 8 127 90 76 60 18 29 1.52010 –2011 14 199 177 137 114 99 146 0 16 176 182 113 85 77 75 0 1.2248 Data can be downloaded from www.who.int/tb/data GLOBAL TUBERCULOSIS REPORT 2012
SMEAR LABS % OF SMEARPER 100K LABS USINGPOPULATION LED aCULTURELABS PER 5MPOPULATIONLABORATORIESDST b LABSPER 5MPOPULATIONLPA c LABSPER 5MPOPULATIONNUMBER OFLABS USINGXPERT MTB/RIFSECOND-LINE DSTAVAILABLENRL dFREE THROUGH NTPTB DIAGNOSISFIRST-LINEDRUGSTB NOTIF.RIFAMPICINRATE PERUSED100 000THROUGHOUTHEALTH-CARETREATMENTWORKERSBangladesh 0.7 1
WESTERN PACIFIC REGIONTable A4.1 Estimates of the burden of disease caused by TB, 1990–2011 253Table A4.2 Incidence, notification and case detection rates, all forms, 1990–2011 256Table A4.3 Case notifi cations, 1990–2011 259Table A4.4 Treatment outcomes, new smear-positive cases, 1995–2010 262Table A4.5 Treatment outcomes, retreatment cases, 1995–2010 264Table A4.6 HIV testing and provision of CPT, ART and IPT, 2005–2011 266Table A4.7 Testing for MDR-TB and number of confi rmed cases of MDR-TB, 2005–2011 268Table A4.8 New smear-positive case notifi cation by age and sex, 1995–2011 270Table A4.9 Laboratories, NTP services, drug management and infection control, 2011 272
Estimates of mortality, prevalence and incidenceEstimated values are shown as best estimates followed by lower and upper bounds. The lower and upper bounds aredefined as the 2.5th and 97.5th centiles of outcome distributions produced in simulations. See Annex 1 for furtherdetails.Estimated numbers are shown rounded to two significant figures. Estimated rates are shown rounded to three significantfigures unless the value is under 100, in which case rates are shown rounded to two significant figures. Blank cellsindicate that estimates are not available.Estimates for all years are recalculated as new information becomes available and techniques are refined, so they maydiffer from those published in previous reports in this series. Estimates published in previous global TB control reportsshould no longer be used.Data sourceData shown in this annex are taken from the WHO global TB database on 25 September 2012. Data shown in the mainpart of the report were taken from the database in July 2012. As a result, data in this annex may differ slightly fromthose in the main part of the report.Data can be downloaded from www.who.int/tb/data.252 Data can be downloaded from www.who.int/tb/data GLOBAL TUBERCULOSIS REPORT 2012
MORTALITY (EXCLUDING HIV) PREVALENCE (INCLUDING HIV) INCIDENCE (INCLUDING HIV)YEARPOPULATION(MILLIONS)NUMBER(THOUSANDS)RATE aNUMBER(THOUSANDS)RATE aNUMBER(THOUSANDS)American Samoa 1990 < 1
YEARPOPULATION(MILLIONS)MORTALITY (EXCLUDING HIV) PREVALENCE (INCLUDING HIV) INCIDENCE (INCLUDING HIV)NUMBER(THOUSANDS)RATE aNUMBER(THOUSANDS)RATE aNUMBER(THOUSANDS)Micronesia 1990 < 1 0.013 (0–0.150) 14 (0–155) 0.44 (
YEARPOPULATION(MILLIONS)MORTALITY (EXCLUDING HIV) PREVALENCE (INCLUDING HIV) INCIDENCE (INCLUDING HIV)NUMBER(THOUSANDS)RATE aNUMBER(THOUSANDS)RATE aNUMBER(THOUSANDS)Tuvalu 1990 < 1
YEARPOPULATION(MILLIONS)INCIDENCE (INCLUDING HIV) INCIDENCE HIV-POSITIVE NOTIFIED NEW AND RELAPSE CASE DETECTIONNUMBER(THOUSANDS)RATE aNUMBER(THOUSANDS)RATE a NUMBER RATE a PERCENTAmerican Samoa 1990 < 1 0.012 (
INCIDENCE (INCLUDING HIV) INCIDENCE HIV-POSITIVE NOTIFIED NEW AND RELAPSE CASE DETECTIONYEARPOPULATION(MILLIONS)NUMBER(THOUSANDS)RATE aNUMBER(THOUSANDS)RATE a NUMBER RATE a PERCENTMicronesia 1990 < 1 0.36 (0.100–0.800) 379 (104–827) 367 381 100 (46–370)(Federated 1995 < 1 0.35 (0.200–0.540) 325 (185–505) 172 160 49 (32–87)States of) 2000 < 1 0.3 (0.210–0.400) 279 (200–371) 91 85 30 (23–43)2005 < 1 0.26 (0.170–0.370) 240 (158–338) 98 90 37 (26–57)2009 < 1 0.23 (0.110–0.400) 212 (101–365) 148 134 63 (37–130)2010 < 1 0.23 (0.098–0.410) 206 (89–371) 160 144 70 (39–160)2011 < 1 0.22 (0.096–0.400) 200 (86–360) 148 133 66 (37–150)Mongolia 1990 2 8.9 (7.6–10) 405 (345–470) 0 (0–
YEARPOPULATION(MILLIONS)INCIDENCE (INCLUDING HIV) INCIDENCE HIV-POSITIVE NOTIFIED NEW AND RELAPSE CASE DETECTIONNUMBER(THOUSANDS)RATE aNUMBER(THOUSANDS)RATE a NUMBER RATE a PERCENTTuvalu 1990 < 1 0.048 (0.031–0.069) 536 (347–766) 23 255 48 (33–74)1995 < 1 0.04 (0.017–0.074) 437 (181–805) 36 390 89 (48–220)2000 < 1 0.034 (0.022–0.048) 357 (231–510) 16 170 48 (33–74)2005 < 1 0.028 (0.019–0.039) 291 (198–402) 12 124 43 (31–63)2009 < 1 0.024 (0.012–0.041) 247 (121–418) 18 184 74 (44–150)2010 < 1 0.023 (0.013–0.036) 237 (135–368) 14 142 60 (39–110)2011 < 1 0.022 (0.013–0.035) 228 (130–353) 12 122 53 (35–94)Vanuatu 1990 < 1 0.19 (0.150–0.230) 127 (103–154) 140 95 75 (62–93)1995 < 1 0.11 (0.085–0.130) 63 (51–76) 79 47 75 (62–93)2000 < 1 0.2 (0.160–0.250) 110 (89–132) 152 82 75 (62–93)2005 < 1 0.17 (0.140–0.210) 83 (68–99) 76 36 44 (36–53)2009 < 1 0.17 (0.140–0.200) 72 (59–86) 0.05 (0.036–0.067) 22 (15–29) 134 57 80 (67–97)2010 < 1 0.17 (0.140–0.200) 69 (57–83) 116 48 70 (58–85)2011 < 1 0.16 (0.140–0.200) 67 (55–80) 110 45 67 (56–81)Viet Nam 1990 67 140 (100–170) 204 (155–261)
NEW AND RELAPSENOTIFICATION RATE a1990–2011YEARNEW ANDRELAPSENEW CASESSMEAR- SMEAR-NEGATIVE/POSITIVE UNKNOWNEXTRA-RE-TREAT EXCL.OTHER RELAPSEPULMONARY RELAPSETOTALRETREATHISTORYUNKNOWN% SMEAR-POS AMONGNEW PULMAmerican Samoa 1990 9 –1995 –2000 3 2 0 1 0 0 1002005 6 3 2 0 0 1 0 1 0 602009 4 0 2 2 0 0 0 0 0 02010 4 0 3 1 0 0 0 0 0 0• 19 4 • 2011 3 0 3 0 0 0 0 0 0 0Australia 1990 1 016 –1995 1 073 –2000 1 043 251 362 369 17 17 412005 1 046 241 339 450 16 27 43 422009 1 217 267 391 511 7 41 20 61 77 412010 1 187 274 410 457 5 41 24 65 70 40• 6 5 • 2011 1 222 301 436 463 2 20 29 49 17 41Brunei 1990 143 –Darussalam 1995 –2000 307 84 166 42 15 15 342005 163 101 30 27 5 0 5 0 772009 213 140 18 49 6 0 0 0 0 892010 237 146 30 43 13 5 0 5 0 83• 57 57 • 2011 230 109 52 48 13 8 0 8 0 68Cambodia 1990 6 501 –1995 14 603 11 101 1 465 1 428 605 605 882000 18 891 14 822 1 108 2 147 814 814 932005 35 535 21 001 7 057 6 759 718 588 1 306 752009 39 202 17 863 8 378 12 529 0 432 997 1 429 0 682010 40 460 17 454 8 301 14 239 0 466 1 168 1 634 0 68• 68 270 • 2011 38 555 15 812 7 686 14 690 0 367 1 115 1 482 0 67China 1990 375 481 –1995 515 764 134 488 203 088 1 560 18 693 18 693 402000 454 372 204 765 229 943 19 664 53 480 73 144 472005 894 428 472 719 329 157 42 845 49 707 90 780 140 487 5 301 592009 965 257 449 152 439 399 34 169 0 42 537 17 046 59 583 0 512010 908 399 429 899 432 868 6 325 0 39 307 14 909 54 216 0 50• 33 67 • 2011 899 669 377 005 481 514 6 540 0 34 610 12 215 46 825 0 44China, Hong Kong 1990 6 510 –SAR 1995 6 212 –2000 6 015 1 940 3 115 772 188 594 782 382005 5 660 1 561 3 179 701 0 219 500 719 0 332009 5 160 1 444 2 673 722 0 321 188 509 0 352010 4 935 1 475 2 352 792 0 316 197 513 0 39• 112 67 • 2011 4 739 1 380 2 244 815 0 300 187 487 0 38China, Macao 1990 343 –SAR 1995 402 141 94 70 49 49 602000 449 160 180 50 12 12 472005 355 136 162 43 0 14 17 31 43 462009 308 116 130 45 0 17 28 45 35 472010 368 123 175 49 0 21 39 60 26 41• 95 61 • 2011 341 148 126 46 0 21 2 23 39 54Cook Islands 1990 0 0 0 0 0 0 0 0 01995 2 2 0 0 0 0 0 0 0 1002000 1 0 1 0 0 0 0 0 0 02005 1 1 0 0 0 0 0 0 0 1002009 2 1 1 0 0 0 0 0 0 502010 0 0 0 0 0 0 0 0 0• 0 5 • 2011 1 1 0 0 0 0 0 0 0 100Fiji 1990 226 84 105 37 441995 203 68 99 34 2 0 2 412000 144 62 42 40 0 0 0 602005 132 63 29 40 682009 144 83 21 38 0 2 0 2 0 802010 189 89 45 45 0 10 2 12 0 66• 31 24 • 2011 208 106 58 41 0 3 5 8 0 65French Polynesia 1990 59 –1995 –2000 62 29 19 10 1 1 602005 63 21 25 14 3 0 3 0 462009 53 17 17 14 0 5 0 5 0 502010 41 13 18 6 0 4 0 4 0 42• 30 23 • 2011 64 22 27 13 0 2 0 2 0 45Guam 1990 –1995 –2000 54 43 5 6 1 1 902005 63 27 26 9 0 1 1 2 0 512009 102 31 60 10 0 1 0 1 0 342010 101 39 51 9 0 2 0 2 0 43• 0 44 • 2011 81 28 39 11 0 3 0 3 1 42Japan 1990 51 821 –1995 43 078 14 367 25 172 2 803 736 736 362000 39 384 11 853 19 118 7 046 1 367 1 367 382005 27 194 10 931 10 056 5 340 867 1 125 1 992 522009 23 631 8 853 8 591 4 975 1 212 539 1 751 512010 22 693 8 237 8 630 4 632 0 1 194 568 1 762 49• 42 17 • 2011 22 119 7 937 8 231 4 826 0 1 125 562 1 687 0 49Kiribati 1990 68 –1995 –2000 252 54 47 106 3 3 532005 332 124 79 126 3 7 10 612009 278 145 70 59 0 4 0 4 0 672010 286 118 91 71 0 6 8 14 0 56• 95 339 • 2011 343 140 109 87 0 7 11 18 0 56Lao People's 1990 1 826 –Democratic 1995 830 478 404 95 2 2 54Republic 2000 2 227 1 526 457 180 64 64 772005 3 699 2 801 484 275 139 41 180 67 852009 3 848 3 034 368 292 0 154 30 184 52 892010 3 999 3 119 394 323 163 22 185 62 89• 44 68 • 2011 4 306 3 271 516 349 170 27 197 54 86Malaysia 1990 11 702 –1995 11 778 6 688 4 021 1 069 210 210 622000 15 057 8 156 5 517 1 384 0 0 602005 15 342 8 446 4 862 1 702 0 332 651 983 73 632009 17 341 9 981 4 596 2 344 0 420 761 1 181 0 682010 18 517 11 135 4 338 2 545 0 499 820 1 319 0 72• 64 69 • 2011 19 808 11 862 4 501 2 888 0 557 858 1 415 0 72WESTERN PACIFIC REGIONaRates are per 100 000 population.GLOBAL TUBERCULOSIS REPORT 2012 Data can be downloaded from www.who.int/tb/data 259
NEW AND RELAPSENOTIFICATION RATE a1990–2011YEARNEW ANDRELAPSENEW CASESSMEAR- SMEAR-NEGATIVE/POSITIVE UNKNOWNEXTRA-RE-TREAT EXCL.OTHER RELAPSEPULMONARY RELAPSETOTALRETREATHISTORYUNKNOWN% SMEAR-POS AMONGNEW PULMMarshall Islands 1990 –1995 –2000 34 11 25 9 0 0 312005 111 48 31 28 4 1 5 0 612009 135 52 71 12 0 0 2 2 6 422010 190 59 64 65 0 2 8 10 3 48• 0 254 • 2011 139 44 30 57 0 8 12 20 0 59Micronesia 1990 367 –(Federated 1995 172 9 79 18 2 2 10States of) 2000 91 15 69 4 3 3 182005 98 32 35 19 5 7 14 21 482009 148 61 47 38 0 2 7 9 0 562010 160 53 79 25 0 3 10 13 4 40• 381 133 • 2011 148 45 73 28 0 2 2 4 0 38Mongolia 1990 1 659 –1995 2 780 455 1 330 976 82 82 252000 3 109 1 389 732 862 126 126 652005 4 601 1 868 897 1 620 0 216 125 341 0 682009 4 481 1 809 726 1 683 0 263 306 569 0 712010 4 458 1 837 701 1 675 0 245 343 588 0 72• 76 151 • 2011 4 217 1 723 684 1 578 0 232 316 548 0 72Nauru 1990 7 –1995 –2000 4 4 0 0 0 0 1002005 11 0 11 02009 4 1 1 2 0 0 0 0 0 502010 3 1 1 1 0 0 0 0 0 50• 76 49 • 2011 5 3 1 1 0 0 0 0 0 75New Caledonia 1990 143 –1995 87 21 81 9 4 4 212000 94 20 15 29 4 4 572005 47 16 15 15 1 6 7 0 522009 54 15 26 13 0 0 9 9 0 372010 49 20 16 13 0 8 8 0 56• 84 20 • 2011 52 13 18 19 0 2 0 2 0 42New Zealand 1990 348 –1995 391 78 222 34 4 4 262000 344 74 133 130 7 0 7 362005 332 83 114 95 29 11 8 19 422009 298 90 90 102 11 5 4 9 502010 301 86 68 134 6 7 4 11 56• 10 7 • 2011 305 88 81 121 13 2 4 6 52Niue 1990 0 –1995 0 0 1 0 0 02000 0 0 02005 0 02009 0 0 0 02010 0 0 0 0 0 0 0 0 0• 0 70 • 2011 1 0 0 0 1 0 0 0 0Northern Mariana 1990 28 –Islands 1995 48 14 26 8 0 0 352000 75 27 37 11 0 0 422005 57 15 35 7 0 0 0 0 0 302009 38 16 16 6 0 0 0 0 0 502010 32 17 13 2 0 0 0 0 0 57• 64 54 • 2011 33 15 16 2 0 0 0 0 0 48Palau 1990 –1995 19 9 6 4 0 0 602000 –2005 10 3 6 1 0 0 0 332009 19 6 9 4 0 0 0 0 0 402010 19 9 10 0 0 0 0 0 0 47• 0 58 • 2011 12 4 6 1 0 1 0 1 0 40Papua New 1990 2 497 –Guinea 1995 8 041 1 652 3 767 2 349 273 273 302000 10 520 1 933 4 405 3 227 955 955 302005 12 564 1 805 5 105 4 198 1 456 1 456 262009 12 306 2 238 4 768 4 826 474 914 1 388 322010 14 531 2 584 5 907 5 798 242 1 582 1 824 30• 60 212 • 2011 14 893 1 882 6 494 6 373 0 144 1 431 1 575 0 22Philippines 1990 317 008 –1995 119 186 94 768 140 712 8 8 8 402000 119 914 67 056 52 858 562005 137 100 81 647 50 347 1 149 0 3 957 3 957 622009 146 565 88 806 52 041 2 745 0 2 973 6 602 9 575 0 632010 166 323 89 198 72 440 1 610 0 3 075 8 066 11 141 0 55• 514 206 • 2011 195 560 93 580 96 529 2 234 0 3 217 10 528 13 745 0 49Republic of Korea 1990 63 904 –1995 42 117 11 754 19 360 2 082 2 082 382000 21 782 8 216 11 304 2 262 2 262 422005 38 290 11 638 18 460 5 171 0 3 021 4 077 7 098 4 602 392009 38 741 11 285 17 634 6 923 0 2 899 3 981 6 880 4 577 392010 41 889 11 596 18 660 8 795 0 2 838 4 038 6 876 2 174 38• 149 88 • 2011 42 589 11 714 18 386 9 457 0 3 032 4 238 7 270 3 664 39Samoa 1990 44 –1995 45 15 30 6 0 0 332000 43 13 18 12 0 0 422005 24 11 8 5 0 0 0 0 0 582009 16 8 5 3 0 0 0 0 0 622010 14 6 5 3 0 0 0 0 0 55• 27 11 • 2011 20 6 12 2 0 0 0 0 33Singapore 1990 1 591 –1995 1 889 455 1 187 127 120 120 282000 1 728 248 869 165 55 55 222005 1 356 552 570 174 0 60 93 153 20 492009 1 525 552 655 235 0 83 49 132 0 462010 1 560 530 735 213 0 82 48 130 0 42• 53 32 • 2011 1 641 592 717 224 0 108 54 162 0 45Solomon Islands 1990 382 –1995 352 109 133 97 13 13 452000 302 109 128 65 0 0 462005 397 169 161 62 0 5 0 5 0 512009 366 138 86 140 0 2 0 2 0 622010 338 133 98 105 0 2 3 5 0 58• 123 72 • 2011 398 159 108 127 0 4 7 11 0 60aRates are per 100 000 population.260 Data can be downloaded from www.who.int/tb/data GLOBAL TUBERCULOSIS REPORT 2012
NEW AND RELAPSENOTIFICATION RATE a1990–2011YEARNEW ANDRELAPSENEW CASESSMEAR- SMEAR-NEGATIVE/POSITIVE UNKNOWNEXTRA-RE-TREAT EXCL.OTHER RELAPSEPULMONARY RELAPSETOTALRETREATHISTORYUNKNOWN% SMEAR-POS AMONGNEW PULMTokelau 1990 1 –1995 2 1 1 0 0 0 502000 0 0 0 0 0 02005 0 0 0 0 0 0 0 0 02009 0 0 0 0 0 0 0 0 02010 0 0 0 0 0 0 0 0 0• 62 0 • 2011 0 0 0 0 0 0 0 0 0Tonga 1990 23 –1995 20 9 2 9 0 0 822000 24 15 5 3 1 1 752005 18 11 3 4 792009 8 6 1 1 0 0 0 0 0 862010 11 6 3 2 0 0 0 0 0 67• 24 9 • 2011 9 6 3 0 0 0 0 0 0 67Tuvalu 1990 23 –1995 36 6 13 16 1 1 322000 16 0 7 7 02005 12 5 3 4 3 3 622009 18 8 0 10 0 0 0 0 0 1002010 14 5 2 7 0 0 0 0 0 71• 255 122 • 2011 12 4 4 4 0 0 1 1 0 50Vanuatu 1990 140 –1995 79 30 27 21 1 1 532000 152 63 56 28 5 5 532005 76 35 21 17 0 3 5 8 0 622009 134 47 24 62 0 1 2 3 0 662010 116 44 33 35 3 1 0 1 0 57• 95 45 • 2011 110 49 14 46 0 1 2 3 0 78Viet Nam 1990 50 203 –1995 55 739 37 550 8 379 6 194 3 616 3 616 822000 89 792 53 169 17 993 13 137 5 493 5 493 752005 94 916 55 492 16 429 16 670 0 6 325 976 7 301 0 772009 95 036 51 291 18 612 18 333 0 6 800 1 331 8 131 1 825 732010 94 867 52 145 18 237 17 651 0 6 834 1 574 8 408 2 581 74• 0 15 • 2011 98 804 50 751 20 373 18 077 2 678 6 925 1 714 8 639 71Wallis and Futuna 1990 –Islands 1995 6 3 2 0 1 1 602000 –2005 7 1 6 142009 9 2 7 0 0 0 0 0 0 222010 –• 0 0 • 2011 2 2 0 0 0 0 0 0 0 100WESTERN PACIFIC REGIONaRates are per 100 000 population.GLOBAL TUBERCULOSIS REPORT 2012 Data can be downloaded from www.who.int/tb/data 261
TREATMENT SUCCESS (%) a1995–2010YEARNUMBERNOTIFIEDSIZE OFCOHORTCOHORT AS% NOTIFIED% OF COHORTCURED COMPLETED DIED FAILED DEFAULTEDNOTEVALUATEDAmerican Samoa 1995 4 – 100 0 0 0 0 02000 2 2 100 0 100 0 0 0 02005 3 4 133 75 252008 0 0 –2009 0 3 – 0 100 0 0 0 0• 100 0 • 2010 0 0 –Australia 1995 –2000 251 238 95 27 45 9 0 3 162005 241 241 100 12 68 10 2 82008 299 587 196 7 73 6 1 1 122009 267 606 227 6 73 3 0 1 16• 0 80 • 2010 274 629 230 8 72 3 0 2 15Brunei 1995 –Darussalam 2000 84 84 100 42 21 17 0 4 172005 101 101 100 66 5 7 0 2 202008 132 164 124 64 23 8 0 1 42009 140 164 117 63 8 9 0 0 20• 0 81 • 2010 146 176 121 61 20 7 0 0 12Cambodia 1995 11 101 4 363 39 83 8 2 1 4 22000 14 822 14 775 100 88 4 4 0 4 12005 21 001 21 001 100 89 4 3 0 2 22008 19 860 19 811 100 92 3 2 0 1 22009 17 863 17 863 100 92 3 2 0 1 1• 91 94 • 2010 17 454 17 454 100 91 3 2 0 1 2China 1995 134 488 131 413 98 72 22 2 1 1 32000 204 765 213 766 104 93 1 2 1 32005 472 719 472 719 100 92 2 2 1 1 32008 462 596 464 151 100 92 2 1 1 1 32009 449 152 449 039 100 93 2 1 1 1 2• 93 96 • 2010 429 899 429 790 100 94 2 1 1 0 2China, Hong Kong 1995 –SAR 2000 1 940 1 940 100 55 5 5 6 4 242005 1 561 1 561 100 60 3 5 9 3 202008 1 459 1 448 99 58 10 17 0 4 112009 1 444 1 441 100 59 11 15 0 3 12• 0 68 • 2010 1 475 1 487 101 57 11 15 0 4 13China, Macao 1995 141 –SAR 2000 160 160 100 81 8 6 0 4 12005 136 136 100 93 0 4 0 1 32008 139 246 177 89 0 5 0 1 42009 116 115 99 86 2 3 0 2 7• 0 93 • 2010 123 219 178 93 0 3 0 1 3Cook Islands 1995 2 2 100 100 0 0 0 0 02000 0 –2005 1 1 100 100 0 0 0 0 02008 2 2 100 50 0 0 0 50 02009 1 0 0• 100 0 • 2010 0 0 –Fiji 1995 68 73 107 78 8 7 0 3 42000 62 62 100 81 5 5 0 8 22005 63 68 108 71 0 10 0 10 92008 78 82 105 82 9 6 0 1 22009 83 79 95 89 5 4 0 1 1• 86 67 • 2010 89 89 100 65 2 6 0 24 3French Polynesia 1995 33 – 67 0 3 0 21 92000 29 62 214 0 97 2 2 0 02005 21 18 86 89 11 0 0 02008 20 28 140 96 4 0 0 02009 17 18 106 89 6 0 6 0• 67 92 • 2010 13 13 100 92 0 8 0 0 0Guam 1995 –2000 43 43 100 93 0 7 0 0 02005 27 27 100 85 0 11 0 0 42008 31 31 100 90 0 6 0 0 32009 31 47 152 96 0 2 0 0 2• 0 84 • 2010 39 51 131 84 0 16 0 0 0Japan 1995 14 367 –2000 11 853 10 348 87 30 15 5 4 1 442005 10 931 10 931 100 38 22 11 3 1 262008 8 995 8 999 100 18 30 19 1 4 282009 8 853 8 772 99 21 31 19 1 4 24• 0 52 • 2010 8 237 8 242 100 20 32 21 1 3 24Kiribati 1995 31 – 45 42 13 02000 54 54 100 83 7 7 2 0 02005 124 123 99 62 31 7 0 1 02008 147 146 99 93 3 4 0 0 02009 145 144 99 84 13 3 0 0 0• 87 93 • 2010 118 117 99 88 5 5 2 0 0Lao People's 1995 478 343 72 62 8 6 2 19 4Democratic 2000 1 526 1 588 104 68 9 7 0 9 7Republic 2005 2 801 2 802 100 85 5 5 1 3 12008 3 075 3 075 100 92 1 5 0 1 02009 3 034 3 034 100 91 2 4 1 2 1• 70 91 • 2010 3 119 3 119 100 89 3 6 0 2 0Malaysia 1995 6 688 13 398 200 69 0 6 2 8 142000 8 156 7 915 97 0 78 8 0 10 42005 8 446 8 446 100 69 1 9 0 5 162008 10 441 9 757 93 78 1 8 0 4 112009 9 981 9 981 100 78 1 9 0 4 9• 69 80 • 2010 11 135 11 135 100 79 1 9 0 4 7Marshall Islands 1995 163 – 3 21 7 0 67 12000 11 11 100 64 27 0 0 9 02005 48 47 98 85 2 2 2 92008 28 35 125 91 6 0 0 3 02009 52 58 112 71 14 9 0 3 3• 25 80 • 2010 59 71 120 63 17 8 0 1 10Micronesia 1995 9 10 111 80 0 10 0 10 0(Federated 2000 15 14 93 93 0 7 0 0 0States of) 2005 32 20 62 75 5 10 5 0 52008 38 59 155 39 8 2 0 2 492009 61 60 98 65 23 3 2 0 7• 80 97 • 2010 53 59 111 97 0 3 0 0 0Mongolia 1995 455 455 100 66 7 8 6 10 22000 1 389 1 389 100 83 4 3 3 4 32005 1 868 1 868 100 82 6 3 5 3 22008 1 838 1 838 100 84 3 3 7 2 12009 1 809 1 809 100 84 4 2 7 2 0• 74 86 • 2010 1 837 1 837 100 83 3 2 8 3 0a TREATMENT SUCCESS = percent cured + percent completed then rounded to the nearest digit.262 Data can be downloaded from www.who.int/tb/data GLOBAL TUBERCULOSIS REPORT 2012
% OF COHORTTREATMENT SUCCESS (%) a1995–2010YEARNUMBERNOTIFIEDSIZE OFCOHORTCOHORT AS% NOTIFIEDCURED COMPLETED DIED FAILED DEFAULTEDNOTEVALUATEDNauru 1995 –2000 4 4 100 25 752005 0 3 – 0 67 33 0 0 02008 2 3 150 33 67 0 0 0 02009 1 0 0• 0 67 • 2010 1 3 300 0 67 0 0 0 33New Caledonia 1995 21 32 152 75 12 3 92000 20 45 225 33 56 9 2 02005 16 16 100 88 6 6 0 0 02008 9 11 122 9 73 9 9 0 02009 15 15 100 0 93 0 0 7 0• 75 76 • 2010 20 21 105 0 76 19 0 5 0New Zealand 1995 78 –2000 74 73 99 5 25 23 472005 83 84 101 0 60 6 0 1 332008 101 98 97 0 73 8 0 3 152009 90 92 102 76 7 1 16• 0 74 • 2010 86 86 100 74 17 8Niue 1995 0 –2000 0 –2005 0 0 –2008 0 0 –2009 0 –• 0 0 • 2010 0 0 –Northern Mariana 1995 14 –Islands 2000 27 27 100 81 0 0 0 0 192005 15 15 100 73 0 0 0 0 272008 13 13 100 77 8 0 0 152009 16 16 100 0 81 0 0 0 19• 0 82 • 2010 17 17 100 0 82 0 0 0 18Palau 1995 9 9 100 56 11 0 0 11 222000 –2005 3 3 100 100 0 0 0 0 02008 0 –2009 6 8 133 62 12 25 0 0 0• 67 88 • 2010 9 16 178 75 12 12 0 0 0Papua New 1995 1 652 4 904 297 56 4 0 15 25Guinea 2000 1 933 422 22 39 24 2 0 26 92005 1 805 1 292 72 57 14 4 1 19 52008 2 323 2 259 97 58 7 4 2 16 132009 2 238 2 584 115 58 13 4 2 16 6• 56 58 • 2010 2 584 2 530 98 48 10 3 2 14 23Philippines 1995 94 768 90 297 95 54 6 1 1 5 342000 67 056 50 196 75 73 15 2 1 6 32005 81 647 81 125 99 82 7 2 1 4 32008 85 025 85 025 100 80 8 2 1 4 52009 88 806 88 806 100 82 7 2 1 4 4• 60 91 • 2010 89 198 89 198 100 85 7 2 1 4 2Republic of Korea 1995 11 754 11 675 99 74 2 2 3 5 142000 8 216 3 231 39 81 2 2 1 3 122005 11 638 3 752 32 81 2 1 1 4 112008 11 048 4 056 37 82 2 1 0 3 122009 11 285 3 813 34 81 2 1 1 3 12• 76 89 • 2010 11 596 2 828 24 85 4 1 0 3 6Samoa 1995 15 15 100 13 67 20 0 0 02000 13 13 100 85 8 8 0 0 02005 11 11 100 91 0 9 0 0 02008 6 7 117 71 0 29 0 0 02009 8 10 125 90 0 10 0 0 0• 80 100 • 2010 6 6 100 100 0 0 0 0 0Singapore 1995 455 122 27 71 15 2 0 11 02000 248 242 98 71 14 0 14 02005 552 548 99 83 14 0 2 12008 525 951 181 62 19 16 0 0 22009 552 937 170 65 17 15 0 1 2• 86 80 • 2010 530 948 179 62 17 17 0 1 3Solomon Islands 1995 109 368 338 65 6 0 4 262000 109 109 100 73 7 5 0 4 112005 169 169 100 56 30 8 0 4 22008 140 140 100 82 11 2 0 1 32009 138 138 100 67 22 4 1 3 3• 65 87 • 2010 133 133 100 57 30 1 3 5 4Tokelau 1995 1 –2000 0 –2005 0 –2008 0 –2009 0 0 –• 0 0 • 2010 0 –Tonga 1995 9 20 222 75 0 10 5 0 102000 15 15 100 93 0 0 7 0 02005 11 11 100 73 0 18 0 0 92008 11 11 100 100 0 0 0 0 02009 6 6 100 83 0 17 0 0 0• 75 83 • 2010 6 6 100 83 0 17 0 0 0Tuvalu 1995 6 –2000 0 7 – 86 14 02005 5 6 120 100 0 0 0 0 02008 9 9 100 67 11 11 0 11 02009 8 8 100 88 0 0 0 0 12• 0 100 • 2010 5 5 100 100 0Vanuatu 1995 30 13 43 38 46 15 0 0 02000 63 26 41 77 12 8 0 4 02005 35 42 120 64 17 10 7 2 02008 45 43 96 63 28 5 2 2 02009 47 47 100 81 15 4 0 0 0• 85 80 • 2010 44 44 100 66 14 16 0 2 2Viet Nam 1995 37 550 38 189 102 84 5 3 2 4 22000 53 169 53 169 100 90 2 3 1 2 22005 55 492 55 492 100 90 2 3 1 1 22008 53 484 53 482 100 90 2 3 1 2 22009 51 291 51 387 100 90 2 3 1 2 2• 89 92 • 2010 52 145 52 147 100 91 2 3 1 2 2Wallis and Futuna 1995 3 –Islands 2000 –2005 1 –2008 3 – 100 0 0 0 0 02009 2 –• 0 100 • 2010 2 – 0 100 0 0 0 0a TREATMENT SUCCESS = percent cured + percent completed then rounded to the nearest digit.WESTERN PACIFIC REGIONGLOBAL TUBERCULOSIS REPORT 2012 Data can be downloaded from www.who.int/tb/data 263
TREATMENT SUCCESS (%) a1995–2010YEARNUMBERNOTIFIEDSIZE OFCOHORTCOHORT AS% NOTIFIED% OF COHORTCURED COMPLETED DIED FAILED DEFAULTEDNOTEVALUATEDAmerican Samoa 1995 –2000 0 –2005 1 1 100 100 02008 0 0 –2009 0 0 –• 0 0 • 2010 0 0 –Australia 1995 –2000 17 11 65 9 73 9 0 0 92005 43 43 100 16 56 5 5 192008 43 50 116 4 62 12 0 2 202009 61 65 107 6 60 3 2 8 22• 0 69 • 2010 65 58 89 5 64 5 0 3 22Brunei 1995 –Darussalam 2000 15 –2005 5 5 100 40 40 20 0 0 02008 12 12 100 50 33 8 0 0 82009 0 0 –• 0 100 • 2010 5 5 100 100 0 0 0 0 0Cambodia 1995 605 436 72 59 26 5 3 3 42000 814 827 102 85 5 6 1 4 02005 1 306 1 306 100 49 27 9 2 3 112008 1 435 597 42 74 5 7 5 3 62009 1 429 1 429 100 34 45 3 1 1 15• 85 75 • 2010 1 634 1 524 93 30 44 4 1 1 20China 1995 18 693 54 052 289 90 2 2 3 1 12000 73 144 43 252 59 86 2 1 1 1 82005 140 487 89 239 64 85 5 3 3 1 42008 102 079 64 023 63 85 4 2 2 1 52009 59 583 59 853 100 86 4 2 2 1 4• 92 90 • 2010 54 216 54 469 100 86 4 2 2 1 5China, Hong Kong 1995 –SAR 2000 782 218 28 27 26 4 17 18 82005 719 716 100 40 18 4 9 7 222008 561 526 94 21 45 13 0 5 162009 509 481 94 26 38 15 0 6 14• 0 68 • 2010 513 512 100 34 34 12 0 4 16China, Macao 1995 49 –SAR 2000 12 37 308 68 16 11 0 5 02005 31 37 119 51 24 11 0 0 142008 38 38 100 55 26 3 0 3 132009 45 46 102 43 35 11 0 7 4• 0 66 • 2010 60 35 58 51 14 14 0 11 9Cook Islands 1995 0 –2000 0 –2005 0 0 –2008 0 0 –2009 0 0 –• 0 0 • 2010 0 0 –Fiji 1995 2 –2000 0 –2005 0 –2008 4 0 02009 2 5 250 40 40 20 0 0 0• 0 67 • 2010 12 12 100 50 17 17 0 17 0French Polynesia 1995 2 – 50 0 50 0 0 02000 1 –2005 3 4 133 75 25 02008 2 4 200 75 0 0 25 02009 5 5 100 0 100 0 0 0 0• 50 75 • 2010 4 4 100 0 75 25 0 0 0Guam 1995 –2000 1 –2005 2 2 100 50 0 0 0 50 02008 1 0 02009 1 1 100 100 0 0 0 0 0• 0 100 • 2010 2 2 100 100 0 0 0 0 0Japan 1995 736 –2000 1 367 1 169 86 31 15 5 6 1 412005 1 992 1 992 100 29 16 8 2 2 432008 1 836 1 547 84 14 30 16 1 8 312009 1 751 1 452 83 15 32 15 1 6 31• 0 47 • 2010 1 762 1 466 83 14 32 17 1 5 31Kiribati 1995 –2000 3 9 300 89 0 11 0 0 02005 10 3 30 100 02008 17 17 100 53 24 12 0 12 02009 4 6 150 83 17 0 0 0 0• 0 70 • 2010 14 20 143 25 45 30 0 0 0Lao People's 1995 2 1 50 100 0 0 0 0 0Democratic 2000 64 64 100 41 8 11 8 11 22Republic 2005 180 181 101 75 12 6 2 5 12008 179 153 85 86 3 9 1 0 12009 184 184 100 85 3 8 2 1 0• 100 82 • 2010 185 184 99 76 7 12 3 3 0Malaysia 1995 210 –2000 0 –2005 983 1 056 107 46 9 8 1 9 272008 1 054 1 171 111 36 26 11 1 5 222009 1 181 1 181 100 33 27 9 1 6 23• 0 59 • 2010 1 319 1 319 100 35 24 12 1 12 17Marshall Islands 1995 –2000 0 –2005 5 20 400 60 10 302008 7 2 29 0 50 50 0 0 02009 2 8 400 12 75 0 0 12 0• 0 50 • 2010 10 4 40 25 25 50 0 0 0Micronesia 1995 2 9 450 100 0 0 0 0 0(Federated 2000 3 20 667 25 60 5 10 0 0States of) 2005 21 9 43 11 89 02008 5 5 100 40 20 20 0 0 202009 9 16 178 0 19 75 0 0 6• 100 30 • 2010 13 10 77 20 10 10 0 20 40Mongolia 1995 82 23 28 61 0 9 13 13 42000 126 126 100 57 14 8 8 7 62005 341 443 130 39 34 9 11 4 32008 544 385 71 51 22 6 16 4 12009 569 380 67 60 13 4 17 4 2• 61 80 • 2010 588 234 40 19 61 9 6 2 4a TREATMENT SUCCESS = percent cured + percent completed then rounded to the nearest digit.264 Data can be downloaded from www.who.int/tb/data GLOBAL TUBERCULOSIS REPORT 2012
% OF COHORTTREATMENT SUCCESS (%) a1995–2010YEARNUMBERNOTIFIEDSIZE OFCOHORTCOHORT AS% NOTIFIEDCURED COMPLETED DIED FAILED DEFAULTEDNOTEVALUATEDNauru 1995 –2000 0 –2005 0 –2008 3 0 02009 0 1 – 100 0• 0 0 • 2010 0 0 –New Caledonia 1995 4 4 100 100 02000 4 –2005 7 7 100 86 0 14 0 0 02008 4 5 125 0 40 40 20 0 02009 9 9 100 0 89 0 0 0 11• 100 88 • 2010 8 8 100 0 88 12 0 0 0New Zealand 1995 4 –2000 7 23 329 0 30 4 652005 19 18 95 0 67 0 0 0 332008 11 11 100 0 91 0 0 0 92009 9 9 100 67 11 22• 0 73 • 2010 11 11 100 73 18 9Niue 1995 0 –2000 –2005 0 –2008 0 0 –2009 –• 0 0 • 2010 0 0 –Northern Mariana 1995 0 –Islands 2000 0 –2005 0 0 –2008 2 0 02009 0 0 –• 0 0 • 2010 0 0 –Palau 1995 0 –2000 –2005 0 0 –2008 0 –2009 0 0 –• 0 0 • 2010 0 0 –Papua New 1995 273 –Guinea 2000 955 68 7 29 35 4 1 21 92005 1 456 65 4 42 14 15 6 20 32008 1 799 –2009 1 388 530 38 36 22 5 5 29 3• 0 46 • 2010 1 824 444 24 35 11 5 5 18 27Philippines 1995 8 –2000 –2005 3 957 –2008 8 866 3 819 43 56 15 4 4 7 142009 9 575 4 362 46 48 13 4 4 5 26• 0 69 • 2010 11 141 4 554 41 53 15 5 5 6 16Republic of Korea 1995 2 082 2 004 96 39 1 1 2 3 532000 2 262 131 6 59 2 3 3 12 212005 7 098 3 331 47 72 3 2 0 6 182008 6 310 2 476 39 74 2 1 1 6 162009 6 880 2 420 35 69 3 2 1 5 21• 40 79 • 2010 6 876 1 813 26 76 4 2 0 6 12Samoa 1995 0 –2000 0 –2005 0 0 –2008 0 0 –2009 0 0 –• 0 0 • 2010 0 0 –Singapore 1995 120 –2000 55 –2005 153 149 97 79 15 0 5 12008 151 149 99 40 30 22 0 3 52009 132 130 98 37 39 20 0 1 3• 0 78 • 2010 130 127 98 47 31 17 0 2 3Solomon Islands 1995 13 –2000 0 –2005 5 5 100 20 40 20 20 0 02008 14 14 100 79 21 0 0 0 02009 2 2 100 50 50 0 0 0 0• 0 80 • 2010 5 5 100 80 0 20 0 0 0Tokelau 1995 0 –2000 0 –2005 0 –2008 0 –2009 0 0 –• 0 0 • 2010 0 –Tonga 1995 0 9 – 100 0 0 0 0 02000 1 1 100 100 02005 0 –2008 0 0 –2009 0 0 –• 100 0 • 2010 0 0 –Tuvalu 1995 1 –2000 –2005 3 0 02008 2 0 02009 0 0 –• 0 0 • 2010 0 0 –Vanuatu 1995 1 –2000 5 5 100 100 0 0 0 0 02005 8 0 02008 1 1 100 0 0 100 0 0 02009 3 3 100 100 0 0 0 0 0• 0 100 • 2010 1 1 100 100 0 0 0 0 0Viet Nam 1995 3 616 2 384 66 80 2 5 8 2 42000 5 493 8 806 160 74 5 6 5 3 72005 7 301 7 374 101 79 4 5 6 3 32008 7 534 7 534 100 80 3 5 5 3 32009 8 131 357 4 67 6 8 2 10 7• 81 69 • 2010 8 408 398 5 61 8 8 4 12 6Wallis and Futuna 1995 1 –Islands 2000 –2005 –2008 0 –2009 0 –• 0 0 • 2010 0 –a TREATMENT SUCCESS = percent cured + percent completed then rounded to the nearest digit.WESTERN PACIFIC REGIONGLOBAL TUBERCULOSIS REPORT 2012 Data can be downloaded from www.who.int/tb/data 265
–% OF TB PATIENTS WITHKNOWN HIV STATUS2005–2011YEAR% OF TBPATIENTS WITHKNOWN HIVSTATUSNUMBER OF TBPATIENTS WITHKNOWN HIVSTATUSPATIENTSNOTIFIED(NEW ANDRETREAT)NUMBER OFHIV-POSITIVETB PATIENTS% OF TESTEDTB PATIENTSHIV-POSITIVE% OF HIV-POSITIVE TBPATIENTS ONCPT% OF HIV-POSITIVE TBPATIENTS ONARTNUMBER OFHIV-POSITIVEPEOPLEPROVIDED IPTAmerican Samoa 2005 0 0 62009 100 4 4 0 0 02010 75 3 4 0 0• 0 100 • 2011 100 3 3 0 0Australia 2005 42 448 1 073 22 5 9 02009 49 648 1 314 23 42010 54 686 1 281 24 3• 42 56 • 2011 56 709 1 268 17 2Brunei 2005 100 163 163 2 1 0 0Darussalam 2009 100 213 213 2 1 100 1002010 100 237 237 1 0 100 100 2• 100 100 • 2011 100 230 230 3 1 100 100 0Cambodia 2005 3 1 044 36 123 86 82009 70 28 264 40 199 3 597 13 30 15 662010 77 32 236 41 628 2 112 7 65 45 491• 3 82 • 2011 82 32 544 39 670 1 650 5 88 79 1 305China 2005 990 5092009 6 63 227 982 303 2 511 4 87 432010 16 145 919 923 308 4 542 3 45– 23 • 2011 23 208 681 911 884 4 715 2 36China, Hong Kong 2005 68 4 209 6 160 35 1 49 54SAR 2009 74 3 953 5 348 38 1 29 26 782010 75 3 833 5 132 24 1 17 29• 68 74 • 2011 74 3 656 4 926 33 1China, Macao 2005 91 378 415 1 0 0 100SAR 2009 90 335 371 1 0 0 0 12010 92 399 433 3 1 33 33• 91 94 • 2011 94 358 382 2 1 50 50Cook Islands 2005 0 0 1 02009 0 0 2 0 02010 0 0 0• 0 100 • 2011 100 1 1 0 0Fiji 2005 100 132 132 1 1 0 02009 48 69 144 0 0 02010 82 157 191 3 2 100 100 0• 100 75 • 2011 75 160 213 3 2 100French Polynesia 2005 48 30 63 0 02009 23 12 53 0 0 02010 27 11 41 0 0• 48 27 • 2011 27 17 64 1 6 100 100Guam 2005 72 46 64 0 02009 63 64 102 0 0 02010 62 63 101 1 2 100 100• 72 55 • 2011 55 45 82 0 0Japan 2005 28 3192009 51 12 429 24 170 52 02010 52 12 098 23 261 53 0– 49 • 2011 49 11 221 22 681 75 1Kiribati 2005 13 44 339 2 5 0 02009 54 151 278 2 1 100 02010 54 159 294 0 0 2• 13 77 • 2011 77 274 354 0 0Lao People's 2005 3 807Democratic 2009 17 686 3 930 179 26 89Republic 2010 38 1 533 4 083 182 12 100– 47 • 2011 47 2 058 4 387 218 11 100Malaysia 2005 73 11 661 16 066 1 468 132009 84 15 192 18 102 1 644 11 10 10 02010 91 17 577 19 337 1 628 9 22 22• 73 89 • 2011 89 18 472 20 666 1 629 9 48 46Marshall Islands 2005 77 86 112 0 02009 69 98 143 2 2 0 100 02010 68 137 201 0 0• 77 58 • 2011 58 88 151 1 1 0 100Micronesia 2005 6 7 112 0 0(Federated 2009 46 72 155 0 0 0States of) 2010 49 85 174 0 0• 6 73 • 2011 73 110 150 0 0Mongolia 2005 0 1 4 726 1 100 100 1002009 83 3 993 4 787 0 0 02010 89 4 256 4 801 2 0 100 100 0• 0 80 • 2011 80 3 612 4 533 3 0 100 100 0Nauru 2005 0 0 11 02009 0 0 4 0 02010 0 0 3 0• 0 0 • 2011 0 0 5 0New Caledonia 2005 40 21 53 0 02009 0 0 63 02010 0 0 57 0• 40 0 • 2011 0 0 52New Zealand 2005 41 140 340 8 62009 46 140 302 3 22010 60 183 305 3 2• 41 56 • 2011 56 172 309 2 1Niue 2005 0 0 02009 0 0 0 02010 0 0 0– 100 • 2011 100 1 1 0 0Northern Mariana 2005 98 56 57 0 0Islands 2009 87 33 38 0 0 02010 100 32 32 0 0• 98 94 • 2011 94 31 33 0 0Palau 2005 90 9 10 0 02009 100 19 19 0 0 02010 95 18 19 0 0• 90 50 • 2011 50 6 12 1 17 0 0Papua New 2005 12 564Guinea 2009 7 888 13 220 91 102010 13 2 122 16 113 222 10 135– 29 • 2011 29 4 671 16 324 531 11 256Philippines 2005 137 1002009 1 1 136 153 167 1 0 0 0 12010 1 1 634 174 389 2 0 0 0 16– 2 • 2011 2 3 917 206 088 9 0 226266 Data can be downloaded from www.who.int/tb/data GLOBAL TUBERCULOSIS REPORT 2012
–% OF TB PATIENTS WITHKNOWN HIV STATUS2005–2011YEAR% OF TBPATIENTS WITHKNOWN HIVSTATUSNUMBER OF TBPATIENTS WITHKNOWN HIVSTATUSPATIENTSNOTIFIED(NEW ANDRETREAT)NUMBER OFHIV-POSITIVETB PATIENTS% OF TESTEDTB PATIENTSHIV-POSITIVE% OF HIV-POSITIVE TBPATIENTS ONCPT% OF HIV-POSITIVE TBPATIENTS ONARTNUMBER OFHIV-POSITIVEPEOPLEPROVIDED IPTRepublic of Korea 2005 46 9692009 47 299 962010 48 101 135– – 2011 50 491 129Samoa 2005 0 0 24 02009 12 2 16 0 02010 21 3 14 0 0 0• 0 5 • 2011 5 1 20 0 0Singapore 2005 1 4692009 71 1 121 1 574 52 52010 74 1 184 1 608 50 4– 79 • 2011 79 1 331 1 695 60 5Solomon Islands 2005 0 0 397 02009 0 0 366 0 02010 11 39 341 0 0 0• 0 17 • 2011 17 70 405 0 0Tokelau 2005 0 0 02009 0 0 02010 0 0 0– – 2011 0 0 0Tonga 2005 182009 100 8 8 0 0 02010 73 8 11 0 0– 100 • 2011 100 9 9 0 0Tuvalu 2005 0 0 15 02009 0 0 18 0 02010 0 0 14 0• 0 0 • 2011 0 0 13 0Vanuatu 2005 0 0 81 02009 0 0 136 0 02010 8 9 116 0 0• 0 50 • 2011 50 56 112 0 0Viet Nam 2005 15 14 128 95 892 595 42009 36 34 907 98 192 5 934 17 89 6 1 5002010 43 42 356 99 022 3 515 8 62 43 1 317• 15 59 • 2011 59 59 176 100 518 4 703 8 72 48Wallis and Futuna 2005 7 0Islands 2009 100 9 9 0 0 02010 10 0 0– 400 • 2011 400 8 2 0 0WESTERN PACIFIC REGIONGLOBAL TUBERCULOSIS REPORT 2012 Data can be downloaded from www.who.int/tb/data 267
YEARTOTALCONFIRMEDCASES OFMDR-TB aESTIMATED CASESOF MDR-TB AMONGNOTIFIEDESTIMATED CASESOF MDR-TB AMONGNOTIFIEDNEW PULMONARY CASESNUMBER OFBACT+VE bTESTED FORMDR-TB% OFBACT+VE bTESTED FORMDR-TBESTIMATED CASESOF MDR-TB AMONGNOTIFIEDPREVIOUSLY TREATED CASESNUMBER OFNOTIFIEDTESTED FORMDR-TB% OF NOTIFIEDTESTED FORMDR-TBAmerican Samoa 2005 – –2009 0 0 – 0 –2010 0 0 – 0 –2011 0 0.15 (0.11–0.18) 0.15 (0.11–0.18) 1 – 0 (0–0) 0 –Australia 2005 12 – –2009 31 – –2010 33 868 160 48 742011 28 29 (17–41) 16 (8.7–26) 652 99 13 (5.7–23) 26 53Brunei 2005 – –Darussalam 2009 0 164 100 13 –2010 0 181 100 5 1002011 0 0 (0–0) 0 (0–3.1) 205 130 0 (0–3.0) 8 100Cambodia 2005 – –2009 2 – –2010 31 5
YEARTOTALCONFIRMEDCASES OFMDR-TB aESTIMATED CASESOF MDR-TB AMONGNOTIFIEDESTIMATED CASESOF MDR-TB AMONGNOTIFIEDNEW PULMONARY CASESNUMBER OFBACT+VE bTESTED FORMDR-TB% OFBACT+VE bTESTED FORMDR-TBESTIMATED CASESOF MDR-TB AMONGNOTIFIEDPREVIOUSLY TREATED CASESNUMBER OFNOTIFIEDTESTED FORMDR-TB% OF NOTIFIEDTESTED FORMDR-TBRepublic of Korea 2005 – –2009 – –2010 450 – –2011 516 1 800 (1 500–2 200) 810 (630–1 000) 3431 17 1 000 (740–1 400) 968 13Samoa 2005 – –2009 – –2010 0 0 0 0 –2011 0 0.88 (0.67–1.1) 0.88 (0.67–1.1) – 0 (0–0) –Singapore 2005 3 895 96 105 692009 3 915 98 85 642010 3 923 97 79 612011 6 8.2 (1.7–15) 8.2 (3.0–18) 952 97 0 (0–5.6) 104 64Solomon Islands 2005 – –2009 0 5 3.6 15 7502010 0 1 0.75 1 202011 0 16 (12–19) 13 (9.9–16) 0 0 2.6 (2.2–2.9) 0 0Tokelau 2005 – –2009 – –2010 0 0 – 0 –2011 0 (0–0) 0 (0–0) – 0 (0–0) –Tonga 2005 – –2009 – –2010 0 0 0 0 –2011 0 0.44 (0.33–0.55) 0.44 (0.33–0.55) 0 0 0 (0–0) 0 –Tuvalu 2005 – –2009 0 0 0 0 –2010 0 0 0 0 –2011 0 0.62 (0.52–0.72) 0.39 (0.30–0.49) – 0.23 (0.20–0.27) –Vanuatu 2005 – –2009 0 0 0 0 02010 0 – –2011 0 0.70 (0.60–0.80) 0 (0–7.5) 0 0 0.70 (0.59–0.80) 0 0Viet Nam 2005 – –2009 217 – –2010 101 – –2011 601 3 700 (2 900–4 400) 2 000 (1 500–2 700) – 1 700 (1 200–2 200) –Wallis and Futuna 2005 – –Islands 2009 – –2010 – –2011 0 0.10 (
MALEFEMALEYEAR 0–14 15–24 25–34 35–44 45–54 55–64 65+0–14 15–24 25–34 35–44 45–54 55–64 65+UN-KNOWNUN-KNOWNMALE:FEMALERATIOAmerican Samoa 1995 –2000 1 1 1 2.02005 1 2 –2010 0 0 0 0 0 0 0 0 0 0 0 0 0 0 0 0 –2011 –Australia 1995 –2000 3 16 35 25 24 19 49 0 15 19 12 15 5 14 2.12005 0 32 27 23 11 12 30 2 18 26 11 10 6 14 1.62010 2 42 33 22 25 9 27 0 4 36 43 12 2 5 12 0 1.42011 2 38 44 26 19 12 37 0 3 26 40 23 7 7 17 0 1.4Brunei 1995 –Darussalam 2000 0 6 4 15 5 7 15 0 4 6 9 6 3 4 1.62005 0 9 19 19 12 9 0 0 9 11 8 3 2 0 2.12010 0 17 15 13 18 7 18 0 2 7 15 12 8 4 10 0 1.52011 0 11 11 11 10 11 13 0 2 5 9 6 7 3 10 0 1.6Cambodia 1995 161 453 1 244 1 147 1 253 1 257 707 123 388 1 133 1 435 1 426 1 180 578 0.992000 26 519 1 323 1 618 1 456 1 373 1 058 38 457 1 157 1 649 1 798 1 459 892 0.992005 49 894 1 600 2 349 2 043 1 964 1 811 45 790 1 413 2 089 2 323 2 058 1 573 1.02010 39 750 1 564 1 760 2 105 1 531 1 599 60 752 1 321 1 303 1 732 1 607 1 331 1.22011 34 791 1 469 1 557 1 972 1 439 1 339 39 690 1 211 1 092 1 528 1 473 1 242 1.2China 1995 1 102 12 791 18 306 15 487 13 105 13 489 10 130 1 169 10 890 13 250 8 376 5 679 4 579 2 841 1.82000 1 131 19 111 29 399 25 206 25 593 21 429 21 771 1 420 14 536 18 496 12 377 9 899 7 102 6 296 2.02005 1 416 43 005 49 558 55 400 54 872 53 822 69 779 1 864 31 180 27 759 24 728 19 889 18 203 21 244 2.32010 759 42 851 38 880 50 246 52 925 56 754 64 514 0 926 27 064 21 022 20 422 16 075 17 441 20 020 0 2.52011 645 37 514 34 597 43 087 47 949 51 315 55 881 0 733 22 859 18 347 17 119 14 103 15 218 17 638 0 2.6China, Hong Kong 1995 –SAR 2000 4 78 102 160 211 236 578 5 65 115 86 44 45 211 2.42005 3 76 84 108 200 168 453 3 67 81 92 57 34 135 2.32010 2 52 84 99 184 166 413 0 3 49 101 76 64 49 133 0 2.12011 2 72 52 63 172 189 384 0 3 56 89 69 60 53 116 0 2.1China, Macao 1995 0 7 19 20 13 12 16 0 9 18 12 4 5 6 1.6SAR 2000 0 10 8 25 22 9 17 0 10 4 6 6 3 13 2.22005 3 6 9 21 23 17 22 0 5 9 7 8 1 5 2.92010 0 17 5 7 22 20 11 0 0 7 6 10 5 7 6 0 2.02011 0 20 22 22 47 39 24 0 0 28 25 17 18 6 6 0 1.7Cook Islands 1995 0 0 0 0 0 1 0 0 0 0 0 1 0 0 1.02000 0 0 0 0 0 0 0 0 0 0 0 0 0 0 –2005 0 1 0 0 0 0 0 0 0 0 0 0 0 0 –2010 0 0 0 0 0 0 0 0 0 0 0 0 0 0 0 0 –2011 0 0 0 0 0 0 0 0 0 1 0 0 0 0 0 0 –Fiji 1995 0 8 10 9 4 2 3 1 10 9 2 3 4 3 1.12000 0 8 6 13 5 4 2 0 7 5 7 1 4 0 1.62005 7 9 18 18 14 16 6 7 7 9 6 4 6 5 2.02010 1 7 15 11 6 2 4 0 1 11 12 5 1 8 5 0 1.12011 0 12 16 8 9 9 4 0 1 13 17 7 5 2 3 0 1.2French Polynesia 1995 –2000 1 3 3 4 4 4 3 1 4 1 0 1 0 0 3.12005 0 2 2 2 0 4 2 0 2 3 0 1 1 3 1.22010 0 3 1 0 1 1 1 0 0 1 1 0 3 0 1 0 1.22011 0 3 1 1 5 1 3 0 0 3 3 0 1 0 1 0 1.8Guam 1995 –2000 2 1 6 6 9 6 9 0 3 1 2 5 2 2 2.62005 0 2 4 4 2 2 4 0 3 1 1 2 0 2 2.02010 0 2 3 5 5 7 3 0 1 0 4 3 3 0 3 0 1.82011 0 1 0 2 7 4 4 0 0 1 1 1 0 3 4 0 1.8Japan 1995 15 342 627 995 1 847 2 059 4 089 14 258 476 298 476 637 2 234 2.32000 2 246 572 676 1 494 1 509 3 816 5 222 464 213 292 384 1 958 2.42005 9 197 488 605 868 1 418 3 867 5 187 428 249 224 309 2 077 2.12010 1 128 252 382 469 911 3 326 6 89 232 194 155 183 1 909 2.02011 0 96 215 367 465 812 3 256 0 5 94 213 203 148 223 1 840 0 1.9Kiribati 1995 –2000 2 9 3 3 3 8 2 2 5 6 3 4 1 3 1.22005 3 15 15 12 17 4 1 5 22 12 7 7 3 1 1.22010 3 27 13 10 9 6 2 0 5 15 7 4 8 5 4 0 1.52011 4 17 9 3 10 9 3 0 6 26 12 9 16 12 4 0 0.65Lao People's 1995 6 56 71 68 78 90 55 3 49 49 69 54 52 26 1.4Democratic 2000 7 92 128 166 201 177 176 10 59 95 131 122 91 71 1.6Republic 2005 13 136 223 296 373 300 352 7 101 186 205 244 192 178 1.52010 8 157 254 287 416 385 380 13 133 152 215 269 225 225 1.52011 8 145 275 323 474 416 375 14 141 204 208 267 215 206 1.6Malaysia 1995 59 640 879 775 788 374 1 072 58 446 448 345 316 149 339 2.22000 32 694 1 138 1 177 908 814 891 41 464 564 424 367 356 286 2.32005 244 1 179 2 218 2 277 1 980 1 427 1 507 208 1 044 1 061 947 816 586 572 2.12010 129 884 1 438 1 599 1 453 967 981 0 152 704 881 592 542 425 388 0 2.02011 63 948 1 564 1 559 1 594 1 245 1 054 0 77 837 876 584 599 459 403 0 2.1Marshall Islands 1995 –2000 3 5 4 1 3 5 3 7 7 3 0 2 2 0 1.12005 2 4 4 5 6 1 1 1 9 2 4 3 4 2 0.922010 0 10 1 4 6 6 2 0 5 9 2 2 4 8 0 0 0.972011 1 7 2 3 3 3 1 0 1 5 8 2 5 2 1 0 0.83Micronesia 1995 0 1 0 3 1 0 0 0 0 1 0 0 0 1 2.5(Federated 2000 0 2 0 1 0 0 1 4 3 1 1 0 1 1 0.36States of) 2005 –2010 3 8 1 2 4 4 0 0 5 8 9 3 4 2 0 0 0.712011 4 8 5 6 2 0 1 0 5 5 2 3 1 2 1 0 1.4Mongolia 1995 37 99 111 68 19 13 15 30 70 78 33 15 9 25 1.42000 6 181 260 171 68 38 23 32 200 213 113 41 26 17 1.22005 7 271 253 232 147 52 36 15 320 270 145 63 32 25 1.12010 3 285 255 231 154 50 40 0 12 296 246 112 83 42 28 0 1.22011 2 246 289 205 170 71 41 0 10 250 192 121 61 40 25 0 1.5Nauru 1995 –2000 1 1 1 0.502005 –2010 0 0 0 0 0 0 0 0 0 0 0 1 0 0 0 0 –2011 0 0 0 1 1 0 0 0 0 0 0 0 0 0 1 0 2.0New Caledonia 1995 3 2 3 4 2 2 3 2 1 1 3 3 0 1 1.72000 1 1 3 4 2 3 4 1 8 1 1 3 2 4 0.902005 0 2 1 0 0 3 0 0 1 2 1 2 0 4 0.602010 0 1 2 3 1 4 3 0 0 1 0 1 0 1 3 0 2.32011 0 0 0 3 1 2 3 0 0 0 1 1 0 1 1 0 2.2New Zealand 1995 0 4 3 3 5 7 7 1 2 3 4 2 2 4 1.62000 0 6 5 6 8 10 7 1 6 6 5 0 4 10 1.32005 4 6 10 6 6 5 10 1 11 9 6 6 1 2 1.32010 0 6 13 4 6 5 11 0 2 12 7 6 5 3 6 0 1.12011 1 12 5 5 7 7 11 0 4 8 8 4 5 3 8 0 1.2270 Data can be downloaded from www.who.int/tb/data GLOBAL TUBERCULOSIS REPORT 2012
MALEFEMALEYEAR 0–14 15–24 25–34 35–44 45–54 55–64 65+0–14 15–24 25–34 35–44 45–54 55–64 65+UN-KNOWNUN-KNOWNMALE:FEMALERATIONiue 1995 –2000 –2005 0 0 0 0 0 0 0 0 0 0 0 0 0 0 –2010 –2011 –Northern Mariana 1995 1 1 3 5 10 3 3 0 0 2 6 4 1 1 1.9Islands 2000 1 4 8 9 9 3 2 0 10 17 7 3 1 1 0.922005 0 0 1 3 4 1 2 0 0 0 1 1 1 1 2.82010 0 2 0 0 3 3 0 0 0 2 0 1 3 2 1 0 0.892011 0 0 0 0 1 5 3 0 0 0 1 0 2 3 0 0 1.5Palau 1995 0 2 3 0 2 1 0 0 0 0 0 1 0 0 8.02000 –2005 2 1 –2010 0 1 2 1 1 1 1 0 1 0 1 1 0 0 0 0 2.32011 0 0 0 1 0 2 0 0 0 0 1 0 0 0 0 0 3.0Papua New 1995 –Guinea 2000 8 87 70 30 21 12 5 6 77 45 21 15 5 1 1.42005 28 183 205 108 94 48 12 38 200 204 124 65 35 2 1.02010 37 279 260 196 135 87 27 64 313 292 191 97 52 9 1.02011 50 278 265 152 122 71 18 53 302 272 146 97 55 15 1.0Philippines 1995 2 43 56 61 46 47 26 1 20 32 26 20 19 11 2.22000 –2005 482 7 358 11 275 13 253 12 531 7 646 4 279 374 3 710 5 268 5 565 4 603 3 274 2 029 2.32010 511 9 320 12 224 13 716 13 651 8 923 4 742 0 454 4 825 5 489 5 301 4 643 3 329 2 070 0 2.42011 573 9 725 12 804 14 474 14 002 9 568 4 845 448 5 155 5 848 5 521 4 880 3 501 2 236 2.4Republic of Korea 1995 27 1 131 1 613 1 425 1 207 1 307 1 225 46 908 863 431 296 408 867 2.12000 19 821 1 085 988 853 731 901 25 546 544 393 220 295 795 1.92005 22 687 1 171 1 326 1 336 1 005 1 669 27 590 842 491 370 373 1 729 1.62010 22 537 705 1 049 1 496 1 029 1 997 0 23 472 686 509 487 368 2 216 0 1.42011 13 491 712 1 019 1 414 1 145 2 132 0 37 446 688 520 432 421 2 244 0 1.4Samoa 1995 0 1 1 1 0 3 2 1 2 2 0 0 1 1 1.12000 0 3 1 1 1 2 1 0 2 1 1 0 0 0 2.22005 0 4 0 1 1 0 0 0 2 0 2 0 1 0 1.22010 1 1 1 3 2 1 3 1.02011 0 1 0 0 0 0 0 0 0 2 1 0 1 0 1 0 0.20Singapore 1995 0 9 40 60 62 70 94 1 8 18 21 22 19 31 2.82000 1 8 9 34 51 26 64 1 9 8 7 9 5 16 3.52005 0 8 25 61 94 96 118 0 5 20 33 29 20 43 2.72010 0 11 21 38 105 86 120 0 1 15 21 26 21 21 44 0 2.62011 0 21 21 44 108 119 126 0 0 11 25 23 23 20 51 0 2.9Solomon Islands 1995 2 14 6 5 7 9 3 3 17 11 7 12 13 0 0.732000 3 13 4 8 8 10 6 8 15 13 7 7 5 2 0.912005 4 14 18 9 15 12 11 9 23 21 12 11 9 1 0.972010 4 16 18 16 8 3 3 0 4 19 17 11 5 4 5 0 1.02011 3 15 22 12 7 8 6 0 3 13 27 15 10 16 2 0 0.85Tokelau 1995 –2000 –2005 –2010 0 0 0 0 0 0 0 0 0 0 0 0 0 0 0 0 –2011 –Tonga 1995 0 1 0 0 0 1 2 0 0 1 1 0 2 1 0.802000 2 1 1 1 5 1 1 1 1 1 2.02005 0 2 1 0 2 1 0 0 2 1 0 0 2 0 1.22010 0 0 0 1 0 1 3 0 0 0 0 0 1 0 0 0 5.02011 0 0 1 0 0 0 1 0 2 0 1 1 0 0 0 0 0.50Tuvalu 1995 1 0 1 0 0 1 0 0 1 1 0 0 1 0 1.02000 –2005 1 1 1 2 0.672010 0 1 0 0 1 2 0 0 0 1 0 0 0 0 4.02011 1 1 1 1 3.0Vanuatu 1995 0 6 2 5 3 4 0 0 5 0 2 3 0 0 2.02000 2 7 5 1 10 5 2 5 3 15 7 3 3 1 0.862005 1 4 5 5 0 4 1 0 5 1 2 4 1 2 1.32010 4 6 3 1 5 2 0 0 3 5 3 3 5 3 1 0 0.912011 2 3 4 6 5 4 2 0 0 5 7 5 4 2 0 0 1.1Viet Nam 1995 –2000 51 2 367 6 147 8 209 6 713 5 150 7 712 64 1 334 2 320 2 754 2 594 2 847 4 907 2.22005 54 3 408 7 105 8 738 8 606 4 958 7 573 47 1 747 2 293 2 116 2 298 2 023 4 604 2.72010 59 3 205 7 036 7 851 8 564 5 790 6 248 0 53 1 870 2 454 1 681 1 864 1 863 3 751 0 2.92011 61 3 099 6 677 7 763 8 474 6 107 5 821 0 64 1 863 2 325 1 681 1 814 1 878 3 124 0 3.0Wallis and Futuna 1995 –Islands 2000 –2005 –2010 –2011 2 –WESTERN PACIFIC REGIONGLOBAL TUBERCULOSIS REPORT 2012 Data can be downloaded from www.who.int/tb/data 271
SMEAR LABS % OF SMEARPER 100K LABS USINGPOPULATION LED aCULTURELABS PER 5MPOPULATIONLABORATORIESDST b LABSPER 5MPOPULATIONLPA c LABSPER 5MPOPULATIONNUMBER OFLABS USINGXPERT MTB/RIFSECOND-LINE DSTAVAILABLENRL dFREE THROUGH NTPTB DIAGNOSISFIRST-LINEDRUGSTB NOTIF.RIFAMPICINRATE PERUSED100 000THROUGHOUTHEALTH-CARETREATMENTWORKERSAmerican Samoa – No No Yes (all suspects) yes YesAustralia – In country yes Yes (all suspects) yes YesBrunei Darussalam 0.2 0 12.3 12.3 12.3 0 yes Yes (all suspects) yes Yes 56Cambodia 1.5 9 1.0 0.3 0 1Out ofcountryyes Yes (all suspects) yes YesChina 0.2 2 2.2 0.7
The World Health Organization monitors theglobal tuberculosis epidemic in support ofnational TB control programmes.For further information about tuberculosis contact:Information Resource Centre HTM/STBWorld Health Organization20 Avenue Appia, 1211–Geneva–27, SwitzerlandEmail: tbdocs@who.intWeb site: www.who.int/tbISBN 978 92 4 1564502