Global Tuberculosis Report -- 2012.pdf
Global Tuberculosis Report -- 2012.pdf
Global Tuberculosis Report -- 2012.pdf

You also want an ePaper? Increase the reach of your titles
YUMPU automatically turns print PDFs into web optimized ePapers that Google loves.
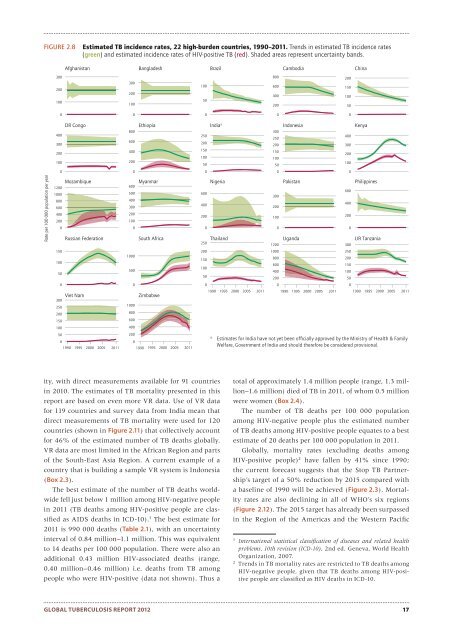
FIGURE 2.8Estimated TB incidence rates, 22 high-burden countries, 1990–2011. Trends in estimated TB incidence rates(green) and estimated incidence rates of HIV-positive TB (red). Shaded areas represent uncertainty bands.AfghanistanBangladeshBrazilCambodiaChina300200100300200100100508006004002002001501005000000DR Congo400300200100800600400200Ethiopia25020015010050India a30025020015010050Indonesia400300200100Kenya00000Rate per 100 000 population per yearMozambique120010008006004002000Russian Federation6005004003002001000MyanmarSouth Africa6004002000250NigeriaThailand30020010001200PakistanUganda6004002000300PhilippinesUR Tanzania1501005010005002001501005010008006004002002502001501005000000Viet Nam3002502001501001000800600400Zimbabwe1990 1995 2000 2005 2011 1990 1995 2000 2005 2011 1990 1995 2000 2005 20115001990 1995 2000 2005 201120001990 1995 2000 2005 2011aEstimates for India have not yet been offi cially approved by the Ministry of Health & FamilyWelfare, Government of India and should therefore be considered provisional.ity, with direct measurements available for 91 countriesin 2010. The estimates of TB mortality presented in thisreport are based on even more VR data. Use of VR datafor 119 countries and survey data from India mean thatdirect measurements of TB mortality were used for 120countries (shown in Figure 2.11) that collectively accountfor 46% of the estimated number of TB deaths globally.VR data are most limited in the African Region and partsof the South-East Asia Region. A current example of acountry that is building a sample VR system is Indonesia(Box 2.3).The best estimate of the number of TB deaths worldwidefell just below 1 million among HIV-negative peoplein 2011 (TB deaths among HIV-positive people are classifiedas AIDS deaths in ICD-10). 1 The best estimate for2011 is 990 000 deaths (Table 2.1), with an uncertaintyinterval of 0.84 million–1.1 million. This was equivalentto 14 deaths per 100 000 population. There were also anadditional 0.43 million HIV-associated deaths (range,0.40 million–0.46 million) i.e. deaths from TB amongpeople who were HIV-positive (data not shown). Thus atotal of approximately 1.4 million people (range, 1.3 million–1.6million) died of TB in 2011, of whom 0.5 millionwere women (Box 2.4).The number of TB deaths per 100 000 populationamong HIV-negative people plus the estimated numberof TB deaths among HIV-positive people equates to a bestestimate of 20 deaths per 100 000 population in 2011.<strong>Global</strong>ly, mortality rates (excluding deaths amongHIV-positive people) 2 have fallen by 41% since 1990;the current forecast suggests that the Stop TB Partnership’starget of a 50% reduction by 2015 compared witha baseline of 1990 will be achieved (Figure 2.3). Mortalityrates are also declining in all of WHO’s six regions(Figure 2.12). The 2015 target has already been surpassedin the Region of the Americas and the Western Pacific1International statistical classifi cation of diseases and related healthproblems, 10th revision (ICD-10), 2nd ed. Geneva, World HealthOrganization, 2007.2Trends in TB mortality rates are restricted to TB deaths amongHIV-negative people, given that TB deaths among HIV-positivepeople are classified as HIV deaths in ICD-10.GLOBAL TUBERCULOSIS REPORT 2012 17