- Page 2 and 3: GLOBALTUBERCULOSISREPORT2012
- Page 4 and 5: ContentsAbbreviationsivAcknowledgem
- Page 6 and 7: AcknowledgementsThis report on glob
- Page 8 and 9: WHO Western Pacific RegionShalala A
- Page 10 and 11: Executive SummaryThe World Health O
- Page 12 and 13: CHAPTER 1IntroductionBOX 1.1Basic f
- Page 14 and 15: TABLE 1.1 Targets for the scale-up
- Page 16 and 17: TABLE 1.2 Reporting of data in the
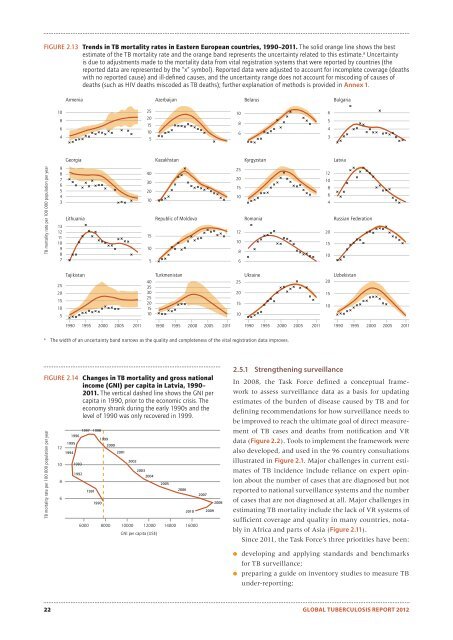
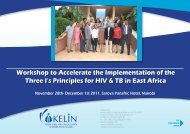
- Page 18 and 19: BOX 2.1Uncertainty in estimates of
- Page 20 and 21: TABLE 2.2 Estimated burden of disea
- Page 22 and 23: FIGURE 2.5 Estimated TB incidence r
- Page 24 and 25: FIGURE B2.2.1Reporting of notificat
- Page 26 and 27: FIGURE 2.8Estimated TB incidence ra
- Page 28 and 29: FIGURE 2.11 Countries (in blue) for
- Page 32 and 33: ● producing and widely disseminat
- Page 34 and 35: FIGURE 2.16 Progress in global cove
- Page 36 and 37: BOX 2.6Efforts by the Task Force to
- Page 38 and 39: CHAPTER 3TB case notificationsand t
- Page 40 and 41: BOX 3.1 1Definitions of TB casesDef
- Page 42 and 43: TABLE 3.3 Contribution of public-pr
- Page 44 and 45: BOX 3.4Integrating community-based
- Page 46 and 47: TABLE 3.4 Estimates of the case det
- Page 48 and 49: TABLE 3.5 Treatment success for new
- Page 50 and 51: CHAPTER 4Drug-resistant TBKEY FACTS
- Page 52 and 53: FIGURE 4.2 Percentage of new TB cas
- Page 54 and 55: BOX 4.1Frequencies of resistance to
- Page 56 and 57: FIGURE 4.6 Number of MDR-TB cases e
- Page 58 and 59: FIGURE 4.7Notified cases of MDR-TB
- Page 60 and 61: egimens globally, providing more su
- Page 62 and 63: 5.1 Funding for TB care and control
- Page 64 and 65: TABLE 5.2 NTP budgets, available fu
- Page 66 and 67: FIGURE 5.5Trends in domestic and do
- Page 68 and 69: FIGURE 5.6Domestic funding as a per
- Page 70 and 71: FIGURE 5.8Cost per TB patient succe
- Page 72 and 73: FIGURE 5.10 Total cost and unit cos
- Page 74 and 75: ● The 14 countries not included i
- Page 76 and 77: on public health by an external Exp
- Page 78 and 79: evised as a result of the introduct
- Page 80 and 81:
TABLE 6.2 Incorporation of WHO poli
- Page 82 and 83:
FIGURE 6.3The Supranational Referen
- Page 84 and 85:
of TB disease by 65%, irrespective
- Page 86 and 87:
FIGURE 7.3Percentage of TB patients
- Page 88 and 89:
BOX 7.1Accelerating progress in pro
- Page 90 and 91:
TABLE 7.2 Assumptions used to estim
- Page 92 and 93:
FIGURE 8.1 The development pipeline
- Page 94 and 95:
sputum specimens and TB isolates fr
- Page 96 and 97:
cal trial sites and building labora
- Page 98:
new TB vaccine candidate. A Phase I
- Page 102 and 103:
This annex explains the methods tha
- Page 104 and 105:
2011. On average, 15 data points we
- Page 106 and 107:
may suffer from biases. These biase
- Page 108 and 109:
TABLE A1.3Parameter estimates used
- Page 110 and 111:
5. Estimates of TB prevalence, 1990
- Page 112:
the Republic of Moldova, Romania, t
- Page 116 and 117:
AFGHANISTANPopulation 2011 32 milli
- Page 118 and 119:
BRAZILPopulation 2011 197 millionHI
- Page 120 and 121:
CHINAPopulation 2011 1 348 millionH
- Page 122 and 123:
ETHIOPIAPopulation 2011 85 millionH
- Page 124 and 125:
INDONESIAPopulation 2011 242 millio
- Page 126 and 127:
MOZAMBIQUEPopulation 2011 24 millio
- Page 128 and 129:
NIGERIAPopulation 2011 162 millionH
- Page 130 and 131:
PHILIPPINESPopulation 2011 95 milli
- Page 132 and 133:
SOUTH AFRICAPopulation 2011 50 mill
- Page 134 and 135:
UGANDAPopulation 2011 35 millionHIG
- Page 136 and 137:
VIET NAMPopulation 2011 89 millionH
- Page 138:
ANNEX 3Regional profiles
- Page 141 and 142:
WHO REGION OF THE AMERICASPopulatio
- Page 143 and 144:
WHO EUROPEAN REGIONPopulation 2011
- Page 145 and 146:
WHO WESTERN PACIFIC REGIONPopulatio
- Page 148 and 149:
SUMMARY BY WHO REGIONTable A4.1 Est
- Page 150 and 151:
MORTALITY (EXCLUDING HIV) PREVALENC
- Page 152 and 153:
NEW AND RELAPSENOTIFICATION RATE aY
- Page 154 and 155:
-% OF TB PATIENTS WITHKNOWN HIV STA
- Page 156 and 157:
AFRICAN REGIONTable A4.1 Estimates
- Page 158 and 159:
MORTALITY (EXCLUDING HIV) PREVALENC
- Page 160 and 161:
MORTALITY (EXCLUDING HIV) PREVALENC
- Page 162 and 163:
INCIDENCE (INCLUDING HIV) INCIDENCE
- Page 164 and 165:
NEW AND RELAPSENOTIFICATION RATE aY
- Page 166 and 167:
NEW AND RELAPSENOTIFICATION RATE a1
- Page 168 and 169:
TREATMENT SUCCESS (%) a1995-2010YEA
- Page 170 and 171:
TREATMENT SUCCESS (%) a1995-2010YEA
- Page 172 and 173:
TREATMENT SUCCESS (%) a1995-2010YEA
- Page 174 and 175:
-% OF TB PATIENTS WITHKNOWN HIV STA
- Page 176 and 177:
YEARTOTALCONFIRMEDCASES OFMDR-TB aE
- Page 178 and 179:
MALEYEAR 0-14 15-24 25-34 35-44 45-
- Page 180 and 181:
REGION OF THE AMERICASTable A4.1 Es
- Page 182 and 183:
MORTALITY (EXCLUDING HIV) PREVALENC
- Page 184 and 185:
MORTALITY (EXCLUDING HIV) PREVALENC
- Page 186 and 187:
INCIDENCE (INCLUDING HIV) INCIDENCE
- Page 188 and 189:
NEW AND RELAPSENOTIFICATION RATE a1
- Page 190 and 191:
NEW AND RELAPSENOTIFICATION RATE a1
- Page 192 and 193:
% OF COHORTTREATMENT SUCCESS (%) a1
- Page 194 and 195:
% OF COHORTTREATMENT SUCCESS (%) a1
- Page 196 and 197:
% OF COHORTTREATMENT SUCCESS (%) a1
- Page 198 and 199:
-% OF TB PATIENTS WITHKNOWN HIV STA
- Page 200 and 201:
YEARTOTALCONFIRMEDCASES OFMDR-TB aE
- Page 202 and 203:
MALEFEMALEYEAR 0-14 15-24 25-34 35-
- Page 204 and 205:
EASTERN MEDITERRANEAN REGIONTable A
- Page 206 and 207:
MORTALITY (EXCLUDING HIV) PREVALENC
- Page 208 and 209:
INCIDENCE (INCLUDING HIV) INCIDENCE
- Page 210 and 211:
NEW AND RELAPSENOTIFICATION RATE a1
- Page 212 and 213:
% OF COHORTTREATMENT SUCCESS (%) a1
- Page 214 and 215:
% OF COHORTTREATMENT SUCCESS (%) a1
- Page 216 and 217:
-% OF TB PATIENTS WITHKNOWN HIV STA
- Page 218 and 219:
MALEFEMALEYEAR 0-14 15-24 25-34 35-
- Page 220 and 221:
EUROPEAN REGIONTable A4.1 Estimates
- Page 222 and 223:
MORTALITY (EXCLUDING HIV) PREVALENC
- Page 224 and 225:
MORTALITY (EXCLUDING HIV) PREVALENC
- Page 226 and 227:
INCIDENCE (INCLUDING HIV) INCIDENCE
- Page 228 and 229:
INCIDENCE (INCLUDING HIV) INCIDENCE
- Page 230 and 231:
NEW AND RELAPSENOTIFICATION RATE a1
- Page 232 and 233:
NEW AND RELAPSENOTIFICATION RATE a1
- Page 234 and 235:
% OF COHORTTREATMENT SUCCESS (%) a1
- Page 236 and 237:
% OF COHORTTREATMENT SUCCESS (%) a1
- Page 238 and 239:
% OF COHORTTREATMENT SUCCESS (%) a1
- Page 240 and 241:
-% OF TB PATIENTS WITHKNOWN HIV STA
- Page 242 and 243:
YEARTOTALCONFIRMEDCASES OFMDR-TB aE
- Page 244 and 245:
MALEFEMALEYEAR 0-14 15-24 25-34 35-
- Page 246 and 247:
MALEFEMALEYEAR 0-14 15-24 25-34 35-
- Page 248 and 249:
SOUTH-EAST ASIA REGIONTable A4.1 Es
- Page 250 and 251:
MORTALITY (EXCLUDING HIV) PREVALENC
- Page 252 and 253:
NEW AND RELAPSENOTIFICATION RATE a1
- Page 254 and 255:
% OF COHORTTREATMENT SUCCESS (%) a1
- Page 256 and 257:
YEARTOTALCONFIRMEDCASES OFMDR-TB aE
- Page 258:
SMEAR LABS % OF SMEARPER 100K LABS
- Page 261 and 262:
Estimates of mortality, prevalence
- Page 263 and 264:
YEARPOPULATION(MILLIONS)MORTALITY (
- Page 265 and 266:
YEARPOPULATION(MILLIONS)INCIDENCE (
- Page 267 and 268:
YEARPOPULATION(MILLIONS)INCIDENCE (
- Page 269 and 270:
NEW AND RELAPSENOTIFICATION RATE a1
- Page 271 and 272:
TREATMENT SUCCESS (%) a1995-2010YEA
- Page 273 and 274:
TREATMENT SUCCESS (%) a1995-2010YEA
- Page 275 and 276:
-% OF TB PATIENTS WITHKNOWN HIV STA
- Page 277 and 278:
YEARTOTALCONFIRMEDCASES OFMDR-TB aE
- Page 279 and 280:
MALEFEMALEYEAR 0-14 15-24 25-34 35-
- Page 281 and 282:
SMEAR LABS % OF SMEARPER 100K LABS