Global Tuberculosis Report -- 2012.pdf
Global Tuberculosis Report -- 2012.pdf
Global Tuberculosis Report -- 2012.pdf

You also want an ePaper? Increase the reach of your titles
YUMPU automatically turns print PDFs into web optimized ePapers that Google loves.
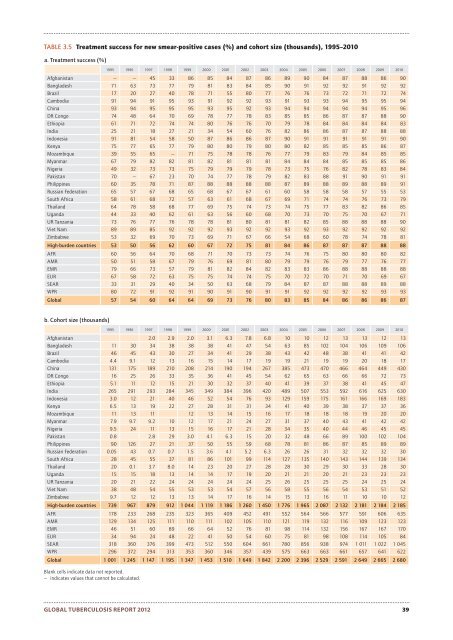
TABLE 3.5 Treatment success for new smear-positive cases (%) and cohort size (thousands), 1995–2010a. Treatment success (%)1995 1996 1997 1998 1999 2000 2001 2002 2003 2004 2005 2006 2007 2008 2009 2010Afghanistan — — 45 33 86 85 84 87 86 89 90 84 87 88 86 90Bangladesh 71 63 73 77 79 81 83 84 85 90 91 92 92 91 92 92Brazil 17 20 27 40 78 71 55 80 77 76 76 73 72 71 72 74Cambodia 91 94 91 95 93 91 92 92 93 91 93 93 94 95 95 94China 93 94 95 95 95 93 95 92 93 94 94 94 94 94 95 96DR Congo 74 48 64 70 69 78 77 78 83 85 85 86 87 87 88 90Ethiopia 61 71 72 74 74 80 76 76 70 79 78 84 84 84 84 83India 25 21 18 27 21 34 54 60 76 82 86 86 87 87 88 88Indonesia 91 81 54 58 50 87 86 86 87 90 91 91 91 91 91 90Kenya 75 77 65 77 79 80 80 79 80 80 82 85 85 85 86 87Mozambique 39 55 65 — 71 75 78 78 76 77 79 83 79 84 85 85Myanmar 67 79 82 82 81 82 81 81 81 84 84 84 85 85 85 86Nigeria 49 32 73 73 75 79 79 79 78 73 75 76 82 78 83 84Pakistan 70 — 67 23 70 74 77 78 79 82 83 88 91 90 91 91Philippines 60 35 78 71 87 88 88 88 88 87 89 88 89 88 89 91Russian Federation 65 57 67 68 65 68 67 67 61 60 58 58 58 57 55 53South Africa 58 61 68 72 57 63 61 68 67 69 71 74 74 76 73 79Thailand 64 78 58 68 77 69 75 74 73 74 75 77 83 82 86 85Uganda 44 33 40 62 61 63 56 60 68 70 73 70 75 70 67 71UR Tanzania 73 76 77 76 78 78 81 80 81 81 82 85 88 88 88 90Viet Nam 89 89 85 92 92 92 93 92 92 93 92 93 92 92 92 92Zimbabwe 53 32 69 70 73 69 71 67 66 54 68 60 78 74 78 81High-burden countries 53 50 56 62 60 67 72 75 81 84 86 87 87 87 88 88AFR 60 56 64 70 68 71 70 73 73 74 76 75 80 80 80 82AMR 50 51 58 67 79 76 69 81 80 79 79 76 79 77 76 77EMR 79 66 73 57 79 81 82 84 82 83 83 86 88 88 88 88EUR 67 58 72 63 75 75 74 74 75 70 72 70 71 70 69 67SEAR 33 31 29 40 34 50 63 68 79 84 87 87 88 88 89 88WPR 80 72 91 92 91 90 91 90 91 91 92 92 92 92 93 93<strong>Global</strong> 57 54 60 64 64 69 73 76 80 83 85 84 86 86 86 87b. Cohort size (thousands)1995 1996 1997 1998 1999 2000 2001 2002 2003 2004 2005 2006 2007 2008 2009 2010Afghanistan 2.0 2.9 2.0 3.1 6.3 7.8 6.8 10 10 12 13 13 12 13Bangladesh 11 30 34 38 38 38 41 47 54 63 85 102 104 106 109 106Brazil 46 45 43 30 27 34 41 29 38 43 42 48 38 41 41 42Cambodia 4.4 9.1 12 13 16 15 14 17 19 19 21 19 19 20 18 17China 131 175 189 210 208 214 190 194 267 385 473 470 466 464 449 430DR Congo 16 25 26 33 35 36 41 45 54 62 65 63 66 66 72 73Ethiopia 5.1 11 12 15 21 30 32 37 40 41 39 37 38 41 45 47India 265 291 293 284 345 349 384 396 420 489 507 553 592 616 625 630Indonesia 3.0 12 21 40 46 52 54 76 93 129 159 175 161 166 169 183Kenya 6.5 13 19 22 27 28 31 31 34 41 40 39 38 37 37 36Mozambique 11 13 11 12 13 14 15 16 17 18 18 18 19 20 20Myanmar 7.9 9.7 9.2 10 12 17 21 24 27 31 37 40 43 41 42 42Nigeria 9.5 24 11 13 15 16 17 21 28 34 35 40 44 46 45 45Pakistan 0.8 2.8 29 3.0 4.1 6.3 15 20 32 48 66 89 100 102 104Philippines 90 126 27 21 37 50 55 59 68 78 81 86 87 85 89 89Russian Federation 0.05 43 0.7 0.7 1.5 3.6 4.1 5.2 6.3 26 26 31 32 32 32 30South Africa 28 45 55 37 81 86 101 99 114 127 135 140 143 144 139 134Thailand 20 0.1 3.7 8.0 14 23 20 27 28 28 30 29 30 33 28 30Uganda 15 15 18 13 14 14 17 19 20 21 21 20 21 23 23 23UR Tanzania 20 21 22 24 24 24 24 24 25 26 25 25 25 24 25 24Viet Nam 38 48 54 55 53 53 54 57 56 58 55 56 54 53 51 52Zimbabwe 9.7 12 12 13 13 14 17 16 14 15 13 16 11 10 10 12High-burden countries 739 967 879 912 1 044 1 119 1 186 1 260 1 450 1 776 1 965 2 087 2 132 2 181 2 184 2 185AFR 178 233 268 235 323 365 409 452 491 552 564 566 577 591 606 635AMR 129 134 125 111 110 111 102 105 110 121 119 132 116 109 123 123EMR 46 51 60 89 66 64 52 76 81 98 114 132 156 167 167 170EUR 34 94 24 48 22 41 50 54 60 75 81 98 108 114 105 84SEAR 318 360 376 399 473 512 550 604 661 780 856 938 974 1 011 1 022 1 045WPR 296 372 294 313 353 360 346 357 439 575 663 663 661 657 641 622<strong>Global</strong> 1 001 1 245 1 147 1 195 1 347 1 453 1 510 1 649 1 842 2 200 2 396 2 529 2 591 2 649 2 665 2 680Blank cells indicate data not reported.— indicates values that cannot be calculated.GLOBAL TUBERCULOSIS REPORT 2012 39