Global Tuberculosis Report -- 2012.pdf
Global Tuberculosis Report -- 2012.pdf
Global Tuberculosis Report -- 2012.pdf

You also want an ePaper? Increase the reach of your titles
YUMPU automatically turns print PDFs into web optimized ePapers that Google loves.
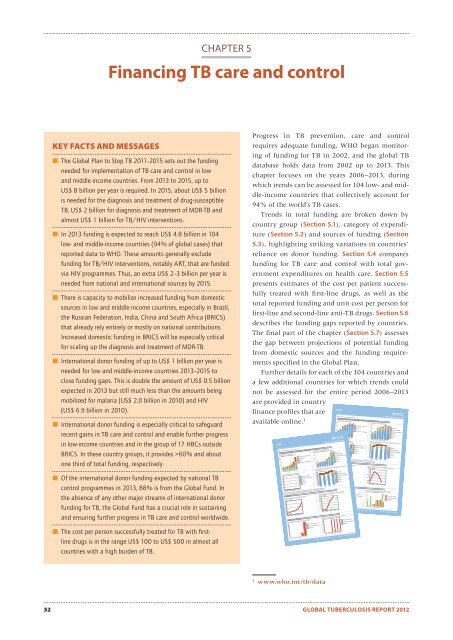
25020015010050010.80.60.40.208070605040108642025020015010050060504030206000500040003000200010005004003002001000806040200151050110010009008007006005003020100LoansTB/HIVMDR-TBDOTSMDR-TB6050403020706050403020100200001800016000140001200010000806040200UnknownTB/HIVMDR-TBDOTSUnknownTB/HIVMDR-TBDOTSMDR-TBCHAPTER 5Financing TB care and controlKEY FACTS AND MESSAGES The <strong>Global</strong> Plan to Stop TB 2011–2015 sets out the fundingneeded for implementation of TB care and control in lowand middle-income countries. From 2013 to 2015, up toUS$ 8 billion per year is required. In 2015, about US$ 5 billionis needed for the diagnosis and treatment of drug-susceptibleTB, US$ 2 billion for diagnosis and treatment of MDR-TB andalmost US$ 1 billion for TB/HIV interventions. In 2013 funding is expected to reach US$ 4.8 billion in 104low- and middle-income countries (94% of global cases) thatreported data to WHO. These amounts generally excludefunding for TB/HIV interventions, notably ART, that are fundedvia HIV programmes. Thus, an extra US$ 2–3 billion per year isneeded from national and international sources by 2015. There is capacity to mobilize increased funding from domesticsources in low and middle-income countries, especially in Brazil,the Russian Federation, India, China and South Africa (BRICS)that already rely entirely or mostly on national contributions.Increased domestic funding in BRICS will be especially criticalfor scaling up the diagnosis and treatment of MDR-TB. International donor funding of up to US$ 1 billion per year isneeded for low and middle-income countries 2013–2015 toclose funding gaps. This is double the amount of US$ 0.5 billionexpected in 2013 but still much less than the amounts beingmobilized for malaria (US$ 2.0 billion in 2010) and HIV(US$ 6.9 billion in 2010). International donor funding is especially critical to safeguardrecent gains in TB care and control and enable further progressin low-income countries and in the group of 17 HBCs outsideBRICS. In these country groups, it provides >60% and aboutone third of total funding, respectively. Of the international donor funding expected by national TBcontrol programmes in 2013, 88% is from the <strong>Global</strong> Fund. Inthe absence of any other major streams of international donorfunding for TB, the <strong>Global</strong> Fund has a crucial role in sustainingand ensuring further progress in TB care and control worldwide. The cost per person successfully treated for TB with fi rstlinedrugs is in the range US$ 100 to US$ 500 in almost allcountries with a high burden of TB.Progress in TB prevention, care and controlrequires adequate funding. WHO began monitoringof funding for TB in 2002, and the global TBdatabase holds data from 2002 up to 2013. Thischapter focuses on the years 2006–2013, duringwhich trends can be assessed for 104 low- and middle-incomecountries that collectively account for94% of the world’s TB cases.Trends in total funding are broken down bycountry group (Section 5.1), category of expenditure(Section 5.2) and sources of funding (Section5.3), highlighting striking variations in countries’reliance on donor funding. Section 5.4 comparesfunding for TB care and control with total governmentexpenditures on health care. Section 5.5presents estimates of the cost per patient successfullytreated with first-line drugs, as well as thetotal reported funding and unit cost per person forfirst-line and second-line anti-TB drugs. Section 5.6describes the funding gaps reported by countries.The final part of the chapter (Section 5.7) assessesthe gap between projections of potential fundingfrom domestic sources and the funding requirementsspecified in the <strong>Global</strong> Plan.Further details for each of the 104 countries anda few additional countries for which trends couldnot be assessed for the entire period 2006–2013are provided in countryfinance profiles that areavailable online. 1IndiaBrazil| High TB burden | High HIV burden | <strong>Tuberculosis</strong> finance profileWHO TB planning and budgeting tool used: NoTotal National TB Programme (NTP) budget, available funding and expenditureFunding by source (US$ mi lions)2006 2007 2008 2009 2010 2011 2012Funding gap by line item (US$ mi lions)| High TB burden | High HIV burden | High MDR-TB burden | <strong>Tuberculosis</strong> finance profileWHO TB planning and budgeting tool used: NoFunding by source (US$ mi lions)Funding by line item (US$ millions)Grants (exc <strong>Global</strong> Fund)Unknown<strong>Global</strong> FundOR/Surveys/OtherLoansPPM/PAL/ACSM/CBCGovernment, NTP budgetTB/HIVMDR-TBDOTS2006 2007 2008 2009 2010 2011 20122006 2007 2008 2009 2010 2011 2012Received funding (do ted line) and actual expenditure by line item (bar)Funding gap by line item (US$ mi lions)(US$ mi lions)8070OR/Surveys/OtherUnknownPPM/PAL/ACSM/CBCOR/Surveys/OtherTB/HIVPPM/PAL/ACSM/CBCMDR-TBTB/HIVDOTSMDR-TB10DOTS02006 2007 2008 2009 2010 2011 20122007 2008 2009 2010* ACSM: Advocacy, Communication and Social Mobilization; CBC: Community-based TB Care;PAL: Practical Approach to Lung Health; PPM: Public-Private Mix; OR: Operational ResearchDOTS budget required per TB patien to be treatedMDR-TB budget required per MDR-TB patien to be treated(US$ per patient)(US$ per patient)Total National TB Programme (NTP) budget, available funding and expenditurePer-patient budget2008 2009 2010 2011 2012Use of general health servicesAverage length of hospital stay during treatment (days)2006 2007 2008 2009 2010 2011New smear-positiveNew smear-neg/extrapMDR-TBGrants (exc <strong>Global</strong> Fund)<strong>Global</strong> FundGovernment, NTP budgetOR/Surveys/OtherPPM/PAL/ACSM/CBCFunding by line item (US$ mi lions)8070OR/Surveys/OtherPPM/PAL/ACSM/CBC1002006 2007 2008 2009 2010 2011 2012Received funding (dotted line) and actual expenditure by line item (bar)(US$ mi lions)2006 2007 2008 2009 2010 2011 20122007 2008 2009 2010* ACSM: Advocacy, Communication and Social Mobilization; CBC: Community-based TB Care;PAL: Practical Approach to Lung Health; PPM: Public-Private Mix; OR: Operational ResearchPer-patient budget02008 2009 2010 2011 2012DOTS budget required per TB patien to be treated(US$ per patient)2008 2009 2010 2011 2012Use of general health servicesAverage length of hospital stay during treatment (days)2006 2007 2008 2009 2010 2011Outpatient care during treatment (typical number of visits)2006 2007 2008 2009 2010 2011New smear-positiveNew smear-neg/extrapMDR-TBGenerated: September 23, 2012 Source: www.who.int/tb/dataNew smear-positiveNew smear-neg/extrapMDR-TB budget required per MDR-TB patien to be treated(US$ per patient)2008 2009 2010 2011 2012Outpatient care during treatment (typical number of visits)2006 2007 2008 2009 2010 2011OR/Surveys/OtherPPM/PAL/ACSM/CBCNew smear-positiveNew smear-neg/extrapGenerated: September 23, 2012 Source: www.who.int/tb/data1w ww.who.int/tb/data52 GLOBAL TUBERCULOSIS REPORT 2012