Global Tuberculosis Report -- 2012.pdf
Global Tuberculosis Report -- 2012.pdf
Global Tuberculosis Report -- 2012.pdf

You also want an ePaper? Increase the reach of your titles
YUMPU automatically turns print PDFs into web optimized ePapers that Google loves.
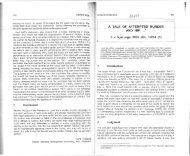
FIGURE 2.15 Trends in estimated TB mortality rates 1990–2011 and forecast TB mortality rates 2012–2015, 22 highburdencountries. Estimated TB mortality excludes TB deaths among HIV-positive people. Shaded areas representuncertainty bands. The horizontal dashed lines represent the Stop TB Partnership target of a 50% reduction in themortality rate by 2015 compared with 1990. The other dashed lines show projections up to 2015.Rate per 100 000 population per yearAfghanistanBangladesh120100100808060604040202000DR CongoEthiopia6010040502000MozambiqueMyanmar250200200150150100100505000Russian FederationSouth Africa20100801560104052000Viet NamZimbabwe1008080606040402020001990 1995 2000 2005 2010 2015 1990 1995 2000 2005 2010 20156420504030201001005006050403020100BrazilIndia aNigeriaThailand300250200150100500120100806040200150100500100806040200CambodiaIndonesiaPakistanUganda201510505040302010060402006040200ChinaKenyaPhilippinesUR Tanzania1990 1995 2000 2005 2010 2015 1990 1995 2000 2005 2010 2015 1990 1995 2000 2005 2010 2015aEstimates for India have not yet been offi cially approved by the Ministry of Health & FamilyWelfare, Government of India and should therefore be considered provisional.try’s TB surveillance system to be certified as providing adirect measurement of TB cases, all of the standards needto be met. For a country’s surveillance system to providea direct measure of TB deaths, both of the two benchmarks(which are related to geographical coverage anddata quality) must be met.The checklist also includes a supplementary list ofthree standards and associated benchmarks that can beused to assess whether TB surveillance data provide adirect measure of the number of cases of MDR-TB, thenumber of HIV-positive cases of TB and TB in childrenspecifically.The TB surveillance checklist was discussed at meetingsof the Technical Evaluation Reference Group (TERG)of the <strong>Global</strong> Fund and the WHO <strong>Global</strong> Task Force on TBImpact Measurement held in May 2012. There was consensusthat use of the checklist should be integrated withinthe grant processes of the <strong>Global</strong> Fund, with resultsfrom the systematic assessments of existing TB surveillanceusing the checklist then used to develop an “investmentplan” to strengthen surveillance. With more than100 low-income and middle-income countries receivinggrants for TB care and control from the <strong>Global</strong> Fund, thisapproach has great potential to make a real difference toTB surveillance worldwide. As of July 2012, the aim wasto apply the checklist in three countries before the endof 2012, and in approximately 15 countries by mid-2014.Inventory studies to measure TB under-reportingInventory studies with record-linkage are used to quantifythe number of TB cases that are diagnosed but notrecorded in surveillance (notification) data. They allowa much better estimation of TB incidence because theyprovide concrete evidence of the gap between notifiedcases and diagnosed cases (which may be especiallybig in countries with a large private sector). Oneof the standards in the TB surveillance checklist is thatunderreporting of diagnosed TB cases is minimal, with abenchmark that in a national investigation less than 10%of diagnosed cases are missed by TB surveillance. Inventorystudies are needed to provide evidence of the level ofunder-reporting; if reporting is below acceptable levels,24 GLOBAL TUBERCULOSIS REPORT 2012