Global Tuberculosis Report -- 2012.pdf
Global Tuberculosis Report -- 2012.pdf
Global Tuberculosis Report -- 2012.pdf

Create successful ePaper yourself
Turn your PDF publications into a flip-book with our unique Google optimized e-Paper software.
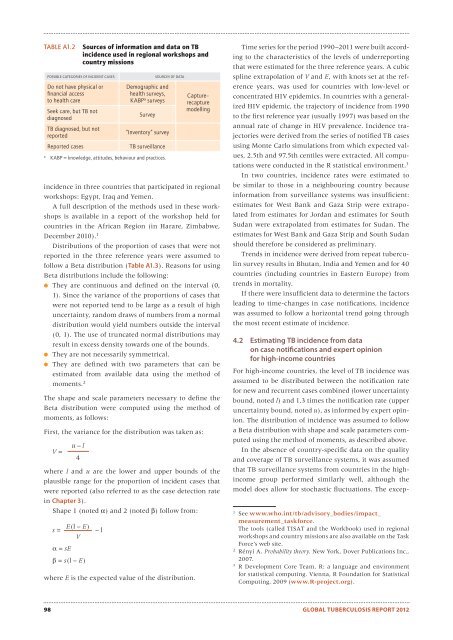
TABLE A1.2POSSIBLE CATEGORIES OF INCIDENT CASESDo not have physical orfi nancial accessto health careSeek care, but TB notdiagnosedTB diagnosed, but notreported<strong>Report</strong>ed casesincidence in three countries that participated in regionalworkshops: Egypt, Iraq and Yemen.A full description of the methods used in these workshopsis available in a report of the workshop held forcountries in the African Region (in Harare, Zimbabwe,December 2010). 1Distributions of the proportion of cases that were notreported in the three reference years were assumed tofollow a Beta distribution (Table A1.3). Reasons for usingBeta distributions include the following:● They are continuous and defined on the interval (0,1). Since the variance of the proportions of cases thatwere not reported tend to be large as a result of highuncertainty, random draws of numbers from a normaldistribution would yield numbers outside the interval(0, 1). The use of truncated normal distributions mayresult in excess density towards one of the bounds.● They are not necessarily symmetrical.● They are defined with two parameters that can beestimated from available data using the method ofmoments. 2The shape and scale parameters necessary to define theBeta distribution were computed using the method ofmoments, as follows:First, the variance for the distribution was taken as:V =u – l4where l and u are the lower and upper bounds of theplausible range for the proportion of incident cases thatwere reported (also referred to as the case detection ratein Chapter 3).Shape 1 (noted α) and 2 (noted β) follow from:E(l – E)s =V = sE = s(l – E)Sources of information and data on TBincidence used in regional workshops andcountry missions– lDemographic andhealth surveys,KABP a surveysSurvey“Inventory” surveyTB surveillanceaKABP = knowledge, attitudes, behaviour and practices.SOURCES OF DATAwhere E is the expected value of the distribution.Capture–recapturemodellingTime series for the period 1990–2011 were built accordingto the characteristics of the levels of underreportingthat were estimated for the three reference years. A cubicspline extrapolation of V and E, with knots set at the referenceyears, was used for countries with low-level orconcentrated HIV epidemics. In countries with a generalizedHIV epidemic, the trajectory of incidence from 1990to the first reference year (usually 1997) was based on theannual rate of change in HIV prevalence. Incidence trajectorieswere derived from the series of notified TB casesusing Monte Carlo simulations from which expected values,2.5th and 97.5th centiles were extracted. All computationswere conducted in the R statistical environment. 3In two countries, incidence rates were estimated tobe similar to those in a neighbouring country becauseinformation from surveillance systems was insufficient:estimates for West Bank and Gaza Strip were extrapolatedfrom estimates for Jordan and estimates for SouthSudan were extrapolated from estimates for Sudan. Theestimates for West Bank and Gaza Strip and South Sudanshould therefore be considered as preliminary.Trends in incidence were derived from repeat tuberculinsurvey results in Bhutan, India and Yemen and for 40countries (including countries in Eastern Europe) fromtrends in mortality.If there were insufficient data to determine the factorsleading to time-changes in case notifications, incidencewas assumed to follow a horizontal trend going throughthe most recent estimate of incidence.4.2 Estimating TB incidence from dataon case notifications and expert opinionfor high-income countriesFor high-income countries, the level of TB incidence wasassumed to be distributed between the notification ratefor new and recurrent cases combined (lower uncertaintybound, noted l) and 1.3 times the notification rate (upperuncertainty bound, noted u), as informed by expert opinion.The distribution of incidence was assumed to followa Beta distribution with shape and scale parameters computedusing the method of moments, as described above.In the absence of country-specific data on the qualityand coverage of TB surveillance systems, it was assumedthat TB surveillance systems from countries in the highincomegroup performed similarly well, although themodel does allow for stochastic fluctuations. The excep-1See www.who.int/tb/advisory_bodies/impact_measurement_taskforce.The tools (called TISAT and the Workbook) used in regionalworkshops and country missions are also available on the TaskForce’s web site.2Rényi A. Probability theory. New York, Dover Publications Inc.,2007.3R Development Core Team. R: a language and environmentfor statistical computing. Vienna, R Foundation for StatisticalComputing, 2009 (www.R-project.org).98 GLOBAL TUBERCULOSIS REPORT 2012