T3 Problem Solving Using Excel - Computer and Information Science
T3 Problem Solving Using Excel - Computer and Information Science
T3 Problem Solving Using Excel - Computer and Information Science
- No tags were found...

Create successful ePaper yourself
Turn your PDF publications into a flip-book with our unique Google optimized e-Paper software.
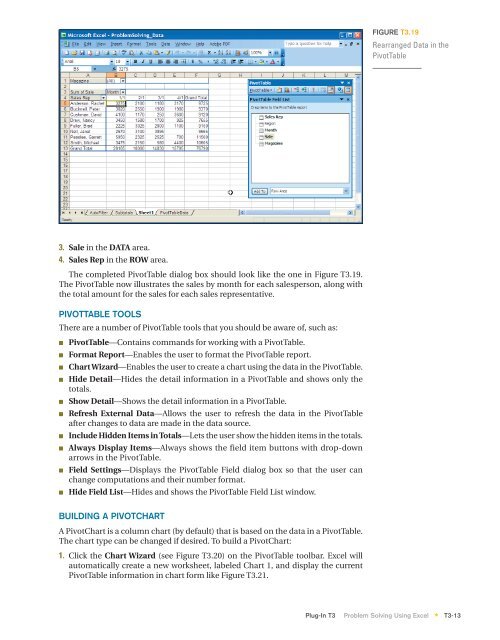
FIGURE <strong>T3</strong>.19Rearranged Data in thePivotTable3. Sale in the DATA area.4. Sales Rep in the ROW area.The completed PivotTable dialog box should look like the one in Figure <strong>T3</strong>.19.The PivotTable now illustrates the sales by month for each salesperson, along withthe total amount for the sales for each sales representative.PIVOTTABLE TOOLSThere are a number of PivotTable tools that you should be aware of, such as:■■■■■■■■■■PivotTable—Contains comm<strong>and</strong>s for working with a PivotTable.Format Report—Enables the user to format the PivotTable report.Chart Wizard—Enables the user to create a chart using the data in the PivotTable.Hide Detail—Hides the detail information in a PivotTable <strong>and</strong> shows only thetotals.Show Detail—Shows the detail information in a PivotTable.Refresh External Data—Allows the user to refresh the data in the PivotTableafter changes to data are made in the data source.Include Hidden Items in Totals—Lets the user show the hidden items in the totals.Always Display Items—Always shows the field item buttons with drop-downarrows in the PivotTable.Field Settings—Displays the PivotTable Field dialog box so that the user canchange computations <strong>and</strong> their number format.Hide Field List—Hides <strong>and</strong> shows the PivotTable Field List window.BUILDING A PIVOTCHARTA PivotChart is a column chart (by default) that is based on the data in a PivotTable.The chart type can be changed if desired. To build a PivotChart:1. Click the Chart Wizard (see Figure <strong>T3</strong>.20) on the PivotTable toolbar. <strong>Excel</strong> willautomatically create a new worksheet, labeled Chart 1, <strong>and</strong> display the currentPivotTable information in chart form like Figure <strong>T3</strong>.21.Plug-In <strong>T3</strong> <strong>Problem</strong> <strong>Solving</strong> <strong>Using</strong> <strong>Excel</strong> <strong>T3</strong>-13*