T3 Problem Solving Using Excel - Computer and Information Science
T3 Problem Solving Using Excel - Computer and Information Science
T3 Problem Solving Using Excel - Computer and Information Science
- No tags were found...

Create successful ePaper yourself
Turn your PDF publications into a flip-book with our unique Google optimized e-Paper software.
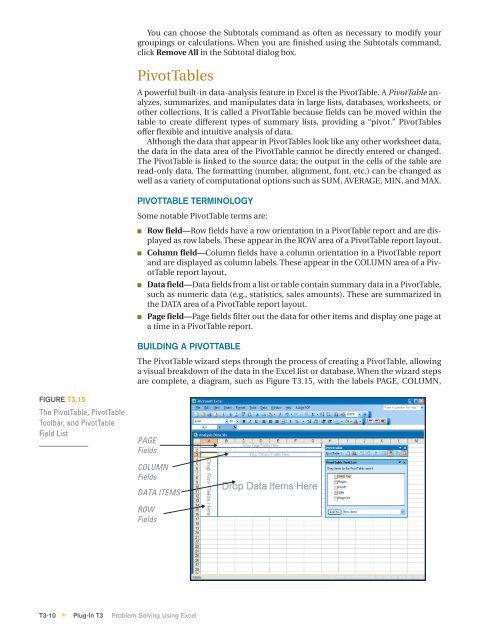
You can choose the Subtotals comm<strong>and</strong> as often as necessary to modify yourgroupings or calculations. When you are finished using the Subtotals comm<strong>and</strong>,click Remove All in the Subtotal dialog box.PivotTablesA powerful built-in data-analysis feature in <strong>Excel</strong> is the PivotTable. A PivotTable analyzes,summarizes, <strong>and</strong> manipulates data in large lists, databases, worksheets, orother collections. It is called a PivotTable because fields can be moved within thetable to create different types of summary lists, providing a “pivot.” PivotTablesoffer flexible <strong>and</strong> intuitive analysis of data.Although the data that appear in PivotTables look like any other worksheet data,the data in the data area of the PivotTable cannot be directly entered or changed.The PivotTable is linked to the source data; the output in the cells of the table areread-only data. The formatting (number, alignment, font, etc.) can be changed aswell as a variety of computational options such as SUM, AVERAGE, MIN, <strong>and</strong> MAX.PIVOTTABLE TERMINOLOGYSome notable PivotTable terms are:■■■■Row field—Row fields have a row orientation in a PivotTable report <strong>and</strong> are displayedas row labels. These appear in the ROW area of a PivotTable report layout.Column field—Column fields have a column orientation in a PivotTable report<strong>and</strong> are displayed as column labels. These appear in the COLUMN area of a PivotTablereport layout.Data field—Data fields from a list or table contain summary data in a PivotTable,such as numeric data (e.g., statistics, sales amounts). These are summarized inthe DATA area of a PivotTable report layout.Page field—Page fields filter out the data for other items <strong>and</strong> display one page ata time in a PivotTable report.BUILDING A PIVOTTABLEThe PivotTable wizard steps through the process of creating a PivotTable, allowinga visual breakdown of the data in the <strong>Excel</strong> list or database. When the wizard stepsare complete, a diagram, such as Figure <strong>T3</strong>.15, with the labels PAGE, COLUMN,FIGURE <strong>T3</strong>.15The PivotTable, PivotTableToolbar, <strong>and</strong> PivotTableField ListPAGEFieldsCOLUMNFieldsDATA ITEMSROWFields<strong>T3</strong>-10 Plug-In <strong>T3</strong> <strong>Problem</strong> <strong>Solving</strong> <strong>Using</strong> <strong>Excel</strong>*