

2010 and 2011 - Census Bureau
2010 and 2011 - Census Bureau
2010 and 2011 - Census Bureau

Create successful ePaper yourself
Turn your PDF publications into a flip-book with our unique Google optimized e-Paper software.
90<br />
80<br />
70<br />
60<br />
50<br />
40<br />
30<br />
20<br />
10<br />
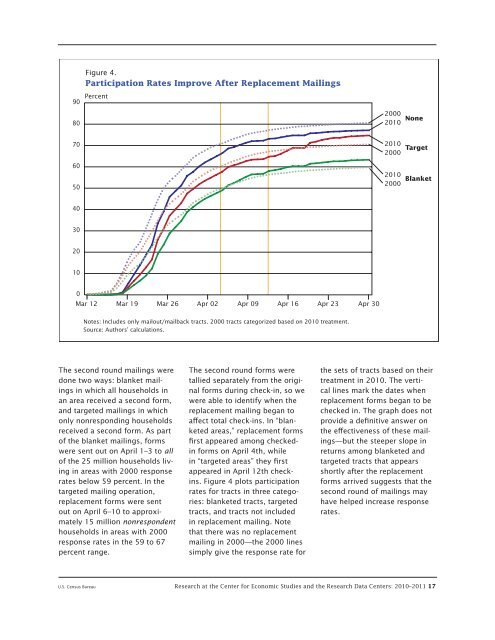
Figure 4.<br />
Participation Rates Improve After Replacement Mailings<br />
Percent<br />
0<br />
Mar 12 Mar 19 Mar 26 Apr 02 Apr 09 Apr 16 Apr 23 Apr 30<br />
Notes: Includes only mailout/mailback tracts. 2000 tracts categorized based on <strong>2010</strong> treatment.<br />
Source: Authors’ calculations.<br />
The second round mailings were<br />
done two ways: blanket mailings<br />
in which all households in<br />
an area received a second form,<br />
<strong>and</strong> targeted mailings in which<br />
only nonresponding households<br />
received a second form. As part<br />
of the blanket mailings, forms<br />
were sent out on April 1–3 to all<br />
of the 25 million households living<br />
in areas with 2000 response<br />
rates below 59 percent. In the<br />
targeted mailing operation,<br />
replacement forms were sent<br />
out on April 6–10 to approximately<br />
15 million nonrespondent<br />
households in areas with 2000<br />
response rates in the 59 to 67<br />
percent range.<br />
The second round forms were<br />
tallied separately from the original<br />
forms during check-in, so we<br />
were able to identify when the<br />
replacement mailing began to<br />
affect total check-ins. In “blanketed<br />
areas,” replacement forms<br />
first appeared among checkedin<br />
forms on April 4th, while<br />
in “targeted areas” they first<br />
appeared in April 12th checkins.<br />
Figure 4 plots participation<br />
rates for tracts in three categories:<br />
blanketed tracts, targeted<br />
tracts, <strong>and</strong> tracts not included<br />
in replacement mailing. Note<br />
that there was no replacement<br />
mailing in 2000—the 2000 lines<br />
simply give the response rate for<br />
2000<br />
<strong>2010</strong><br />
<strong>2010</strong><br />
2000<br />
<strong>2010</strong><br />
2000<br />
the sets of tracts based on their<br />
treatment in <strong>2010</strong>. The vertical<br />
lines mark the dates when<br />
replacement forms began to be<br />
checked in. The graph does not<br />
provide a definitive answer on<br />
the effectiveness of these mailings—but<br />
the steeper slope in<br />
returns among blanketed <strong>and</strong><br />
targeted tracts that appears<br />
shortly after the replacement<br />
forms arrived suggests that the<br />
second round of mailings may<br />
have helped increase response<br />
rates.<br />
U.S. <strong>Census</strong> <strong>Bureau</strong> Research at the Center for Economic Studies <strong>and</strong> the Research Data Centers: <strong>2010</strong>–<strong>2011</strong> 17<br />
None<br />
Target<br />
Blanket


