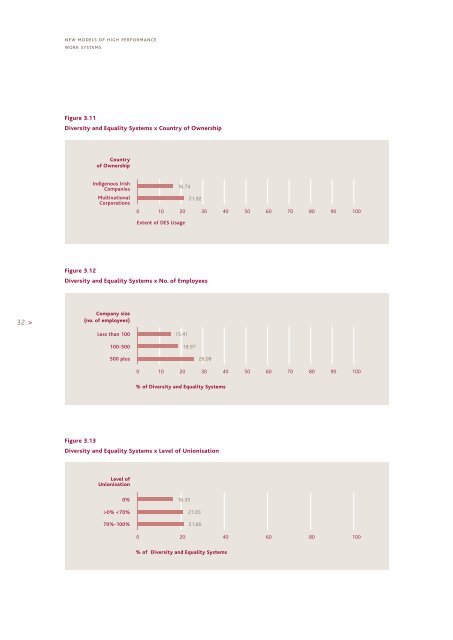
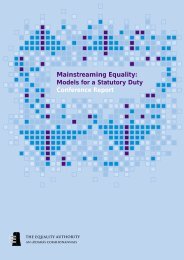
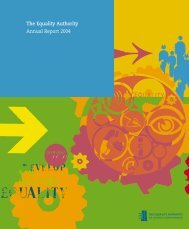
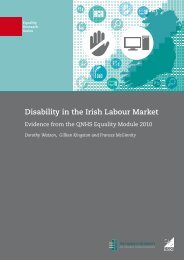
new models <strong>of</strong> high performancework systemsFigure 3.11Diversity and <strong>Equality</strong> <strong>Systems</strong> x Country <strong>of</strong> OwnershipCountry<strong>of</strong> OwnershipIndigenous IrishCompaniesMultinationalCorporations16.7421.920 10 20 30 40 50 60 70 80 90 100Extent <strong>of</strong> DES UsageFigure 3.12Diversity and <strong>Equality</strong> <strong>Systems</strong> x No. <strong>of</strong> Employees32 >Company size(no. <strong>of</strong> employees)Less than 100100-50015.4118.97500 plus26.080 10 20 30 40 50 60 70 80 90 100% <strong>of</strong> Diversity and <strong>Equality</strong> <strong>Systems</strong>Figure 3.13Diversity and <strong>Equality</strong> <strong>Systems</strong> x Level <strong>of</strong> UnionisationLevel <strong>of</strong>Unionisation0%>0%
workplace policies andpractices in irish industryDiversity and <strong>Equality</strong> PoliciesThe majority <strong>of</strong> companies (84.73%)reported having formal written policies onequal opportunities. Significantly fewercompanies (40%) reported having a formalwritten policy on managing diversity.Taking the two issues together, 51.49%<strong>of</strong> companies reported that the issues areintegrated into overall corporate strategy,with 37.69% <strong>of</strong> companies reporting thatthey have a designated senior managerto champion equality and diversity in theorganisation.Diversity and <strong>Equality</strong> monitoringGenerally, across all monitoring issues(recruitment and selection, promotion, payrates), more companies appear to monitorgender than ethnic background, disabilityand age.In the recruitment and selection <strong>of</strong>employees, 20.8% <strong>of</strong> companies monitorit with respect to employee gender, withfewer companies monitoring it with respectto ethnic background (11.6%), disability(10.85%) and age (12.4%).In relation to the promotion <strong>of</strong> employees,13.10% <strong>of</strong> companies monitor it withrespect to gender, again with fewercompanies monitoring it with respect toethnic background (5.28%), disability (2.31$)and age (3.85%).In relation to the monitoring <strong>of</strong> pay rateswith respect to gender, ethnic background,disability, and age, the proportion <strong>of</strong>companies engaged in any form <strong>of</strong>monitoring was universally low, though stillslightly higher in relation to gender paydifferences (3.45%).Diversity and <strong>Equality</strong> TrainingThe data reveals that 25.3% <strong>of</strong> employeesreceived diversity/equality training. Furtheranalysis reveals that these tended to belarger multinational organisations ratherthan Irish indigenous companies, pursuing aproduct differentiation rather than low coststrategy, investing significant amounts inR&D, and with an emphasis on partnershipwith employees.3.5 Flexible <strong>Work</strong>ing3.5.1 OverviewFlexible working practices are generallyconsidered to entail benefits includingincreased employee satisfaction, improvedstaff retention and reduced turnover,increased employee productivity andenhanced organisational reputation. Dex andSmith (2002) provide a useful review <strong>of</strong> theliterature on the effects <strong>of</strong> family-friendlyworking arrangements in the UK. They foundthat the provision <strong>of</strong> family-friendly policesrelating to working at home and childcarewas associated with greater employeecommitment. Shepard et al. (1996) als<strong>of</strong>ound that flexible working practices led toan increase in productivity.3.5.2 Flexible <strong>Work</strong>ing <strong>Systems</strong>(FWS) IndexFor this report, five survey items wereselected and compiled to create the FWSIndex, providing a single score representation<strong>of</strong> FWS. The FWS Index had a Cronbach’salpha reliability rating <strong>of</strong> 0.712. The averagescore <strong>of</strong> FWS across all companies is 16.55%.Table 2.4 describes these practices andtheir percentage usage in the respondingcompanies.< 33