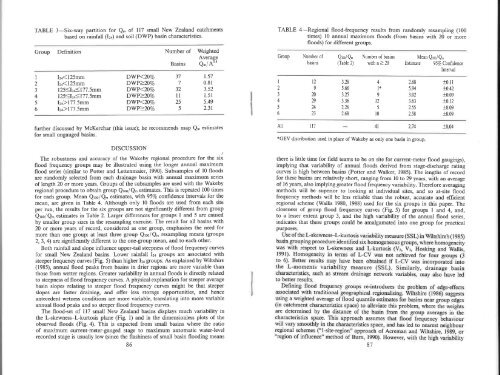
TABLE 3-Six-way partition <strong>for</strong> Q. of ll7 <strong>small</strong> New Zealand catchmentsbased on rainfall (Iz¿) and soil (DWP) basin characteristics.Group DefrnitionI23456lzq1l25mmIzq(125mm12520%oNumber of WeightedAveraseBasins Q-i Aõt37732ll255t.570.813.52<strong>1.</strong>5 I5.492.31TABLE 4-Regional <strong>flood</strong>-<strong>frequency</strong> results from randomly resampling (100times) l0 annual maximum <strong>flood</strong>s (from <strong>basins</strong> with 20 or more<strong>flood</strong>s) <strong>for</strong> different groups.GroupIzJ456Number ofbæinst2920292423Q:oo/Q.Number of bæins(Table 2) with n > 203.285.663.253.362.262.684l*9125l0Mean Qroo/Q.Estimate 95% Confidence2.685.943.023.632.552.58Interval+0.11+0.42+0.09+0.1210.0910.09further discussed by McKerchar (this issue); he recommends map Q. estimates<strong>for</strong> <strong>small</strong> ungauged <strong>basins</strong>.Alrfi1274*GEV distribution used in place of Wakeby as only one basin in group.+0 04DISCUSSIONThe robustness and accuracy of the Wakeby <strong>regional</strong> procedure <strong>for</strong> the sil<strong>flood</strong> <strong>frequency</strong> groups may be illustrated using the longer annual maximum<strong>flood</strong> series (similar to Potter and Lettenmaier, 1990). Subsamples of l0 <strong>flood</strong>sare randomly selected from each drainage basin with annual maximum seriesof length 20 or more yeaß. Groups of the subsamples are used with the Wakeby<strong>regional</strong> procedure to obtain group Qroo/Q* estimates. This is repeated 100 times<strong>for</strong> each group. Mean Qroo/Q. estimates, w\th957o confidence intervals <strong>for</strong> themean, are given in Table 4. Although only l0 <strong>flood</strong>s are used from each siteper run, the results <strong>for</strong> the six groups are not significantly different from groupQroo/Q- estimates in Table 2.Larger differences <strong>for</strong> groups I and 5 are causedby <strong>small</strong>er group sizes in the resampling exercise. The result <strong>for</strong> all <strong>basins</strong> with20 or more years of record, considered as one group, emphasises the need <strong>for</strong>more than one group: at least three group Qroo/Q. resampling means (groups2,3,4) are significantly different to the one-group mean, and to each other.Both rainfall and slope influence upper-tail steepness of <strong>flood</strong> <strong>frequency</strong> curves<strong>for</strong> <strong>small</strong> New Zealand <strong>basins</strong>. Lower rainfall I2a groups are associated withsteeper <strong>frequency</strong> curves (Fig. 5) than higher Izr firoups. As explained by Wiltshire(1985), annual <strong>flood</strong> peaks from <strong>basins</strong> in drier regions are more variable thanthose from wetter regions. G¡eater variability in annual <strong>flood</strong>s is directly relatedto steepness of <strong>flood</strong> <strong>frequency</strong> curves. A physical explanation <strong>for</strong> steeper averagebasin slopes relating to steeper <strong>flood</strong> <strong>frequency</strong> curves might be that steeperslopes are faster draining, and offer less storage opportunities, and henceantecedent wetness conditions are more variable, translating into more variableannual <strong>flood</strong> peaks and so steeper <strong>flood</strong> <strong>frequency</strong> curves.The <strong>flood</strong>-set of 117 <strong>small</strong> New Zealand <strong>basins</strong> displays much variability inthe L-skewness-L-kurtosis plane (Fig. l) and in the dimensionless plots of theobserved <strong>flood</strong>s (Fig. 4). This is expected from <strong>small</strong> <strong>basins</strong> where the ratioof maximum current-meter-gauged stage to maximum automatic waterlevelrecorded stage is usually low (since the flashiness of <strong>small</strong> basin <strong>flood</strong>ing means86there is little time <strong>for</strong> held teams to be on site <strong>for</strong> current-meter <strong>flood</strong> gaugings),implying that variabi-lity of annual <strong>flood</strong>s derived from stage-discharge ratingcuryes is high between <strong>basins</strong> (Potter and \ilalker, 1985). The lengths of record<strong>for</strong> these <strong>basins</strong> are relatively short, ranging from l0 to 29 years, with an averageof 16 years, also implying greater <strong>flood</strong> <strong>frequency</strong> variability. There<strong>for</strong>e averagingmethods will be superior to looking at individual sites, and so at-site <strong>flood</strong><strong>frequency</strong> methods will be less reliable than the robust, accurate and efhcient<strong>regional</strong> scheme (Wallis 1980, 1988) used <strong>for</strong> the six groups in this paper. Thecloseness of group <strong>flood</strong> <strong>frequency</strong> curves (Fig.5) <strong>for</strong> groups I and 4, and,to a lesser extent group 3, and the high variability of the annual <strong>flood</strong> series,indicates that these groups could be amalgamated into one group <strong>for</strong> practicalpurposes.87
in this <strong>flood</strong>-set, nearest neighbour schemes were not suitable <strong>for</strong> this study,since most emphasis is usually placed on the closest basin in catchmentcharacteristic space. For <strong>small</strong> <strong>basins</strong> <strong>for</strong> which <strong>flood</strong> <strong>frequency</strong> estimates arerequired, between-group averaging could be used when a basin's Izq and Scharacteristics place it at the edge of two or more groups. Otherwise the definedgroups in Table I and Figs. 4 and 5 can be used directly as a robust alternativeto the McKerchar and Pearson (1989, 1990) procedure.Examples: Estimation of 100-year<strong>flood</strong> peak dischargel. Kumeu River at Maddren (45315) in Auckland has A = 46.46km2, l2a =125 mm and S = l5o (see Appendix of McKerchar, this issue). This basinis there<strong>for</strong>e in <strong>flood</strong> <strong>frequency</strong> group 3 (from Table l), which has a dimensionless100-year <strong>flood</strong> quantile of 3.25 (from Table 2). From 6 annual <strong>flood</strong> peaks(1984 89), the at-site Q- is 40.3 ¡¡:/s. The McKerchar and Pearson (1989)map Q. estimate is 32.3 m3/s. The pooled at-site and map Q. estimate is33.7 mr/s (pooling described in McKerchar and learson). Multiplying thepooled Q. estimate by the dimensionless 100-year <strong>flood</strong> quantile (3.25) givesa 100 year <strong>flood</strong> estimate of 13.251, f33.71= | lQ ¡¡¡:/ s <strong>for</strong> this basin.3. Moutere Catchment 5 (57405) in Nelson has A = 0.069ó km2, Iz¿ = 105 mmand S = l8o (from Appendix). From Table l, this basin is in <strong>flood</strong> <strong>frequency</strong>group 3, but close to being in groups l, 2 and, 4. Because this basin is locatedat the edges of group 3, a weighted-average quantile estimate is required.The weights <strong>for</strong> each group quantile are the reciprocals of the dimensionlessEuclidean distance in the Iz¿-S space between the group averages (given inTable 2) and the Moutere values. The distances can be made dimensionlessby dividing by Moutere's Iz¿ and S values (105 mm and 18"). For groupI, the weight is:{l(t0s-79.4) I 10sT + Kl8-14.2)/ lSlz}{ s = 3. 1Similarly, weights fcr groups 2, 3 and 4 are 2.0, 2.5, and, 2.3 respectively.Hence, the 1O0-year dimensionless quantile estimate <strong>for</strong> this basin is {(3.1)(3.28)+ (2.0)(5.66) + (2.5)(3.25) + (2.3)(3.36))/(3.1 + 2.0 + 2.5 + 2.3) = 3.77. This canbe used with the at-site Q* (.0297 mz ls) derived from 24 annual <strong>flood</strong> peaksto give a 100-year <strong>flood</strong> peak estimate of <strong>1.</strong>12 m3/s.CONCLUSIONSSix <strong>flood</strong> <strong>frequency</strong> groups were defined on the basis of areally averagedrainfall Iz+ and slope S basin characteristics using Wiltshire's (1985) method withan L-moments measure of <strong>flood</strong> <strong>frequency</strong> variability. Wakeby distributions werefitted to each group, providing robust dimensio¡rless <strong>flood</strong> <strong>frequency</strong> estimators<strong>for</strong> <strong>small</strong> ungauged New Zealand drainage <strong>basins</strong>.88Appendix: Rainfall Izr, slope S, hydrogeology H, and depth-weighted-soil-porosity DWPbasin characte¡istics, and annual <strong>flood</strong> peak L-moments <strong>for</strong> l17 <strong>small</strong> (AreaA < 100 km2) New Zeala¡d <strong>basins</strong>, each with "n" annual <strong>flood</strong> peaks. Sitenumbers from Walter (1990)Site A L¿ S HDWP(km,) (mm) (deg) (fù3506 ll.l04901 12.505513 0.63005515 0.15505516 0.r2ó05519 r3.906501 8.r307202 9.5707604 1<strong>1.</strong>087805 82.4078r I l <strong>1.</strong>968203 0.30008604 40.729228 7.92014610 57.1314625 73.89t4627 68.80t0t464t 75.98r014ó45 0.810010t4646 0.920015453 45.0515534 2.67019734 30.502t4t0 50.2921601 2<strong>1.</strong>4t22901 18.4423005 0.520023209 23.39232t0 53.7323220 84.6029242 40.2529244 36.3229246 75.7829250 15.5729254 78.7529259 0.230020ó05 79.7329808 87.2429841 43.8429843 37.9530516 9.100140 8.54 <strong>1.</strong>00200 18.9 <strong>1.</strong>00190 18.0 <strong>1.</strong>00190 18.0 <strong>1.</strong>00190 18.0 <strong>1.</strong>00190 15.7 <strong>1.</strong>02t95 24.3 5.04135 t0.t 4.40125 9.02 3.13130 t0.7 5.18t25 8.21 5.76t20 r.50 8.00t50 24.5 2.17150 33.2 3.31r60 15.0 6.16160 19.7 7.01200 19.8 6.00190 20.0 6.24ró0 5.50 8.00160 5.50 8.00200 30.9 4.66150 23,2 8.00160 24.1 4.91r55 26.5 5.30165 27.9 4.09170 20.3 4.49ló5 23.0 6.0095 16.7 2.57160 t7.r 4.78150 t7.7 4.99160 3<strong>1.</strong>7 t.5l105 24j 3.98200 35.0 <strong>1.</strong>48140 28.5 <strong>1.</strong>06180 35.2 <strong>1.</strong>4990 22.4 4.03120 23.4 t.92200 34.9 <strong>1.</strong>00l l0 25.9 t.42135 32.0 <strong>1.</strong>00100 17.5 2.34n Unbiased L-moments; L-moment ratios:9.70 22 53.60r0.0 20 ó<strong>1.</strong>0913.0 r0 3.090r0.r lr 0.ó400l0.r ll 0.7fl09.00 l0 5<strong>1.</strong>8010.0 12 18.536.40 l0 26.34<strong>1.</strong>20 27 3<strong>1.</strong>155.44 t5 118.27.10 l0 2<strong>1.</strong>50l3.l t8 <strong>1.</strong>480ll.8 il 69.15u.0 t9 42.2422.1 22 17.8926.7 t4 23.9420.0 23 34.6728.3 15 20.2t29.3 l 2.02029.3 l r.53028.2 l0 43.8819.6 23 t.86020.1 lt 37.5116.9 2t 56.62l4.t t4 45 9l8.ó0 ll 2<strong>1.</strong>6822.t 2t <strong>1.</strong>330lr.5 25 10.22t2.2 26 59.2514.6 tz 83.6015.7 20 lll.3<strong>1.</strong>2 22 3<strong>1.</strong>3814.8 l0 282.016.7 20 32.8114.4 t2 330.29.ó0 I I 0.220013.3 l0 76.3614.7 22 285.1t6.5 12 69.0015.4 l0 85.289.10 2t 7.42089lr = Q' l, lr/1, L,lIt l,/1,(m3/s) (mr/s)9.260 0.02616.39 0.079<strong>1.</strong>040 0.2180.2200 0.il30.2500 0.17417.63 0.0599.590 0.5ó09.930 0.3068.120 0.27340. u 0.iló9.240 0.3200.5200 0.292249t 0.45718.29 0.4983.620 0.3004.920 0.2988.350 0.2206.340 0.1840.3100 0.0860.1600 0.09010.49 0.1930.5600 0.2411t.23 0.36115.23 0.28013.01 0.2037.920 0.0750.3300 0.0033.ó40 0.23018.37 0.13429.05 0.36625.52 0.3688.160 0.07550 7ó 0.33510.13 0.25557.15 0.0940.0700 0.459t7.t4 0.10957.19 0.153r7.68 0.20112.19 0.0192.490 0.3360.143 -0.0480.119 -0.0220.094 0.0830.04r -0.1910.003 -0.1580.06ó 0.1580.424 0.2690,101 0.2340.127 0.055-0.054 -0.0350.r68 0.0990.216 0.t490.505 0.5210.295 0.1560.159 0.0660.088 -0.1020.120 0.0400.059 0.0890.260 0.2530.093 -0.0390.363 0.2330.143 0.0050.235 0.1090.194 0.1280.098 -0.1330.il9 4.076-0.003 -0.0870.120 0.0130.029 -0.0260.2m -0.0660.152 -0.0690.143 4.0160.0ó5 -0.1060.387 0.2130.100 0.0290.327 0.3920.103 0.2780.054 4.0100.224 0.1300.103 -0.r530.2u 0.149