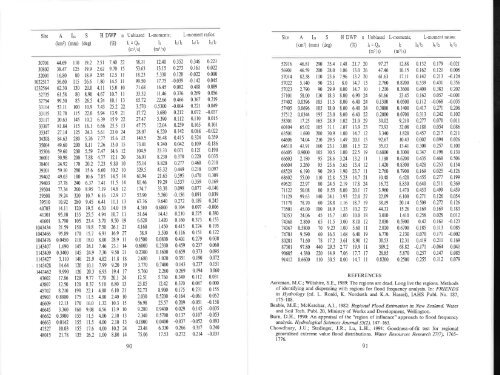
Site A Iu¿ S(km2) (mm) (deg)HDWP(Va)n Unbiased L-moments;lr =Q,lz(m3/Ð (mr/ÐL-moment ratios:bllz Iallz lsllzSite A Iz¿ S(km,) (mm) (deg)HDWPga)n Unbiæed L-moments; L-moment ratios:lr = Q, l, l3/1, lallz lr/lt(mr/Ð (mr/Ð30701 4.6930802 38.4732001 16.80r032517 5ó.601232564 62.3032735 6<strong>1.</strong>5832754 99.5033il4 53.11331l5 32.7833117 20.6333307 8<strong>1.</strong>8433347 27.1434308 84.6335004 49.6035506 59.603ó001 30.9838401 24.9239201 59.1039402 49.0339403 37.7839504 77.3439508 19.2439510 t0.92û703 l4.ll41301 95.1041601 8.7901043434 2<strong>1.</strong>591043466 95.891043476 0.04501t43407 <strong>1.</strong>6901143409 0.3400fi43427 3.1101143428 14.64t443462 9.99043602 17.8643807 12.5045702 8.21045903 0.880046609 12.1346&5 3.36046662 0.390046663 0.0t4247527 10.0348015 2<strong>1.</strong>78I l0 t9.2 2.51 T .40 22125 19.9 2.62 9.70 1580 18.9 2.95 12.5 I Iil5 26.6 <strong>1.</strong>80 14.5 l l130 20.0 4.r1 15.0 l080 8.90 4.67 10.7 ll85 26j 4.24 l0.l 13100 t0.9 7.43 25.2 22ll5 22.0 5.94 13.9 2l145 t0.2 6.39 15.9 22115 l6.t 6.66 25.5 13t25 24.3 5.6t 23.0 24280 5.26 7,11 15.6 12200 8.t I 7.26 13.0 15200 5.59 <strong>1.</strong>41 14.6 t2200 <strong>1.</strong>88 4,17 t2.l 20170 20.2 7.23 9.80 l0280 15.6 6.60 10.2 l0180 10.6 7.85 r4.5 14240 6.37 1 .4t I<strong>1.</strong>5 14260 8.95 7.19 14.8 12320 10.7 6.16 t2.9 11280 9.45 6.41 ll.l 13120 19.5 6.30 14.0 19135 25.5 4.94 10.7 l1105 23.4 3.70 9.50 19150 19.8 7.50 26.1 2l170 15.7 6.91 16.9 27110 18.0 8.00 28.9 ll145 24.1 7.46 23j 14145 24.9 7.30 9.50 2l140 2<strong>1.</strong>9 4.82 I<strong>1.</strong>8 18120 l0.l 7.99 9.m ß120 20.3 6.93 19.4 17t20 9.77 <strong>1.</strong>70 20.1 24t20 8.37 5.10 6.80 13190 22.1 4.00 6.10 2lt75 lr.5 4.00 2.40 l0170 16.0 t.32 r0.3 15160 9.08 4.56 13.9 l0155 il.5 4.00 2.10 13155 lr.5 4.00 2.10 l3r55 17.6 4.00 10.2 24135 26.2 <strong>1.</strong>00 8.80 149038.11 t2.4053.63 13.1518.23 5.33099.50 17.757<strong>1.</strong>68 16.4533.32 1<strong>1.</strong>4665.72 22.663.570 0.530017.72 3.68027.41 5.39047.75 12.0428.07 6.220149.5 26.4873.01 9.240104.9 23.3336.91 8.23055.14 8.820329.5 43.326<strong>1.</strong>94 2<strong>1.</strong>658<strong>1.</strong>46 19.29174.7 33.3853.90 5.36067.36 9.&04.310 0.68005<strong>1.</strong>64 14.436.620 <strong>1.</strong>4204.160 <strong>1.</strong>45038.9 5.5000.1500 0.08000.6000 0.23000.2300 0.16002.680 <strong>1.</strong>0203.170 0.74005.760 2.260t2.5t 5.76023.85 t2.4232.73 8.9002.030 0.520056.98 25.579.280 0.94002.y0 0.57000.1800 0.040023.48 6.33075.06 17.530.352 0.360.273 0.1610.r28 4.022-0.039 -0.1420.082 0.4080.376 0.2690.466 0.361-0.004 0.2210.212 0.0720.1 12 0.1 l00.259 0.1650.142 0.0880.415 0.3240.042 0.1090.071 0.1210.370 0.2n0.277 0.400.449 0.2180.595 0.4700.537 0.3590.098 0.077-0.156 0.0910.272 0.1890.r04 0.0970.210 0.2150.1ó0 0.3730.415 0.2740.11ó 0.1510.401 0.2790.459 0.2370.ó59 0.3730.351 0.1900.143 0.2370.269 0.1940.349 0.1120.370 0.0870.175 0.231-0.164 -0.0610.209 -0.0510.029 0.1450.137 0.107-0.037 -0.0520.266 0.3170.272 0.2140.2210.0220.0000.0450.0890.0560.2190.049-0.0370.0150. l0l-0.0220.359-0. I 8ó0.1900.0350.2100.0970.3090.169-0.1400.0390.245-0.0060.3800 1530.1950.t220.0380.0600.0950.0720.15 10.0600.03r0.m00.1550.052-0.158-0.035-0.0530.0930.240-0.03 r52916 46.8156901 46.5957014 82.3857022 5.14051023 2.79057101 58.0057402 0.039ó57405 0.069ó57512 0.034458301 t7.2560104 65.0263501 <strong>1.</strong>69064ffi6 74.0464610 4<strong>1.</strong>9166405 0.900066ó03 2.18066604 3.26068529 6.19068602 55.0069621 22.977fi22 50.081lL29 99.637r 178 78.7073501 45.0074353 24.0674360 2.86074367 0.580074701 9.59080201 7t.6087301 97.8090605 4.3809t4t2 0.6600290 35.4 <strong>1.</strong>48 2t.7 20200 28.0 r.06 13.0 26n0 23.6 7.96 t3.2 2090 23.1 8.0 14.7 t390 29.9 8.00 14.7 l0ll0 18.3 8.00 6.90 24105 il.5 8.00 6.40 24105 18.0 8.00 6.40 24195 23.0 8.00 6.40 22165 28.9 <strong>1.</strong>02 2<strong>1.</strong>0 29105 3l.r <strong>1.</strong>07 13.9 23200 30.9 <strong>1.</strong>00 14.7 12210 29.5 r.49 20.1 15160 23.1 3.08 1L5 22105 30.5 <strong>1.</strong>00 22.5 1995 28.6 3.24 13.2 1l95 25.6 3.65 t3.4 1290 29.3 <strong>1.</strong>90 23.7 tll l0 12.8 5.23 14.7 2t80 24j 2.19 t7.8 2480 8.55 8.00 20.1 17t40 24.1 3.93 22.0 2760 28.8 <strong>1.</strong>16 18.7 19100 18.9 <strong>1.</strong>33 t0.2 2745 15.7 <strong>1.</strong>00 r0.0 1865 il.5 3.00 8.10 t270 9.23 r.00 5.60 I I60 16.5 <strong>1.</strong>68 6.40 1978 17.2 3.61 8.90 1240 29.3 2.77 19.9 l1220 14.9 7 .06 t7.7 t7I l0 30.5 8.00 t4.7 11REFERENCES97.27 12.8847.46 10.156<strong>1.</strong>ó3 l7.ll2.160 0.8200<strong>1.</strong>210 0.36006<strong>1.</strong>ó6 23.450.1300 0.05000.3000 0.14000.2000 0.070030.02 9.21073.93 32.083.340 <strong>1.</strong>82092.67 10.4335.13 13.4t0.6800 0.3000<strong>1.</strong>180 0.6200<strong>1.</strong>420 0.83002.760 0.790010.48 6.42016.72 8.8303.960 <strong>1.</strong>47022.09 6.10038.19 20.1444.33 t5.263.010 t.4102.030 0.59002.020 0.67006.770 2.13030.53 12.31389.2 68.8228.85 5.8700.8200 0.25000.132 0.179 -0.0210.162 0.121 0.m60J42 0.213 4.1240.539 0.431 0.3560.409 0.383 0.2020.162 0.057 -0.0010.1 l2 -0.068 -0.0350.417 0.211 0.2080.313 0.242 0.1020.277 0.070 0.01I0.t88 0.0f 0.0860.457 0.217 0.21I0.002 0.094 0.0260.300 0.257 0.1000.347 0.198 0.1300.435 0.468 0.5060.428 0.253 0.1540.169 0.025 -0.1260.455 0.277 0.1990.640 0.5il 0.3690.453 0.499 0.4590.271 0.126 0.0540.509 0.272 0.1260.tó9 0.169 0.1830.258 0.028 0.0120.42 0.161 -0.1230.185 0.r13 0.0850.070 0.171 -0.0020.419 0.211 0.t69-0.171 -0.064 0.0410.257 0.147 0.0850.255 0.112 0.079Acreman, M.C.; Wiltshire, S.E., 1989: The regions are dead. Long live the regions. Methodsof identifying and dispensing with regions <strong>for</strong> <strong>flood</strong> <strong>frequency</strong> <strong>analysis</strong>. In: -FR1ðir'DSin Hydrology (ed. L. Roald, K. Nordseth and K.A Hassel), IAHS Publ. No- 187,r75-188.Beable, M.E.; McKerchar, A.L, 1982: Regíonal Flood Btimation in New Zealand Waterand Soil Tech. Publ. 20, Ministry of Wo¡ks and Development, Wellington.Burn, D.H., 1990: An appraisal of the "region of influence" approach to <strong>flood</strong> <strong>frequency</strong><strong>analysis</strong>. Hydrological Sciences Journal 35(2), 147-163.Chowdhury, J.U.; Stedinger, J.R.; Lu, L.H., 1991: Goodness-of-fit test <strong>for</strong> <strong>regional</strong>generalised ext¡eme value <strong>flood</strong> distributions. Water Resources Research 27(7), 1765-1776.9T
Cunnane, C., 1989: Statistical distributions <strong>for</strong> <strong>flood</strong> <strong>frequency</strong> <strong>analysis</strong>. ìWMO Rep. No.718, World Meteorological Organisation, Geneva.Hosking, J.R.M., 1988: Fortran routines <strong>for</strong> use with the methods of L-moments, ResearchRep RC13844, IBM Research, Yorktown Heights, New York.Hosking, J.R.M., 1990: L-moments: <strong>analysis</strong> and estimation of distributions using linearcombinations of order statistics, Journal of Royal Statßtical Society B, 52, 105-124.Hosking, J.R.M.; Wallis, J.R., 1988: The effect of inter-site dependence on <strong>regional</strong> <strong>flood</strong><strong>frequency</strong> <strong>analysis</strong>, llater Resources Research 24(4), 588-600.Hosking, J.R.M.; Wallis, J.R., 1990: Regional <strong>flood</strong> <strong>frequency</strong> <strong>analysis</strong> using L-moments,Research Rep RC15658, IBM Research, Yorktown Heights, New York.Hosking, J.R.M.; V/allis, J.R., l99l: Some statistics useful in <strong>regional</strong> <strong>frequency</strong> <strong>analysis</strong>.Research Rep. RC17096, IBM Research, Yorktown Heights, New York.Hosking, J.R.M.; Wallis J.R.; Wood, E.F., 1985: An appraisal of the <strong>regional</strong> <strong>flood</strong> <strong>frequency</strong>procedure in the UK Flood Studies Report, Hydrological Sciences Journal 30, 85-r09.Hutchinson, P.D., 1990: Regression estimation of low flow in New Zealand- Publ. No.22, Hy dr ology Centre, Christchurch.Kuczera, G., 1982: Robust <strong>flood</strong> <strong>frequency</strong> models. ll/ater Resources Research 18 (2),315-324.Lettenmaier, D.P.; rüallis, J.R.; Wood, E.F., 1987: Effect of <strong>regional</strong> heterogeneity on<strong>flood</strong> <strong>frequency</strong> estimation. llater Resources Research 23 Q),313-323.McKerchar, 4.I., this issue: Regional <strong>flood</strong> <strong>frequency</strong> <strong>analysis</strong> <strong>for</strong> <strong>small</strong> New Zealand,<strong>basins</strong>. l. Mean annual <strong>flood</strong> estimation. Journal of Hydrology (NZ).McKerchar, A.I; Pearson, C.P., 1989: Flood Frequency in New Zealand. Publ. No. 20,Hydrology Centre, Christchurch.McKerchar, A.I; Pearson, C.P., 1990: Maps of <strong>flood</strong> statistics <strong>for</strong> regiona.l <strong>flood</strong> <strong>frequency</strong><strong>analysis</strong> in New Zealand. Hydrological Sciences Journal,35 (6),609-62<strong>1.</strong>Natural Environment Resea¡ch Council, 1975: Flood Studies Report, Volume l. NaturalEnvi¡onment Research Council, London.Pearson, C.P., this issue: Regional <strong>flood</strong> <strong>frequency</strong> <strong>analysis</strong> of New Zealand data usingL-moments. Journal of Hyùology (NZ).Potter, K.W.; Lettenmaier, D.P., 1990: A comparison of <strong>regional</strong> <strong>flood</strong> <strong>frequency</strong> estimationmethods using a resampling method. Water Resources Research 26(3), 415424.Potter, K.W.; Walker, J-F., 1985: An empirical study of <strong>flood</strong> measuremeît elr.or. WdterResources Research 21(3), 43 406.Tomlinson, 4.I., 1980: The Frequency of High IntensiÐ) Rainfalls in New Zealand. Wafer& Soil Tech Publ. No. 19, Ministry of Vy'orks and Development, Wellington.Waìlis, J.R., 1980: Risk and uncertainties in the evaluation of <strong>flood</strong> events <strong>for</strong> the designof hydraulic structures. kt: Piene e Siccita (ed. E. Guggino, G. Rossi and E. Todini),Fondazione Politecnica del Mediterraneo, Catania, ltaly, 3-36.ìùr'ailis, J.R., 1988: Catastrophes, computing, and containment: Iiving vvith our restlesshabitat. Speculatíons in Science and TÞchnology I I (4),295-315.Wallis, J.R., 1989: Regional <strong>frequency</strong> studies using L-moments, Research Rep RC14597,ItsM Research, Yorktown Heights, New York.Wallis, J.R.; Wood, E.F., 1985: Relative accuracy of log Pearson III procedures, ,4SC.EJournal of Hydraulic Engineering 1 I I (7), 1043-1056.Walter, K.M., 1990'. Index to hydrological recording sites in New Zealand 1989. HydrologyCentre Publ. No. 21, Christchurch.Wiltshire, S.E., 1985: Grouping <strong>basins</strong> <strong>for</strong> <strong>regional</strong> <strong>flood</strong> <strong>frequency</strong> <strong>analysis</strong>- HydrologicalScíences Journal 30 (1), 151-159-Vr'iltshire, S.E., 1986: Identfication of homogeneous regions <strong>for</strong> <strong>flood</strong> <strong>frequency</strong> <strong>analysis</strong>.Journal of Hydrology 84,287-302.92COMPARISON AND USE OF HYDROLOGICALNETWORK DESIGN AIDS NARI AND NAUGLSC P Pearson<strong>for</strong>merly: Hydrology Centre, P O Box 22037, Christchurchnow: NIWAR Freshwater, P O Box 8602, ChristchurchABSTRACTThe World Meteorological Organisation project HYNET uses a technique, basedon random subsampling of real data, to compare network designs with commonobjectives. Two network design aids, Network Analysis <strong>for</strong> Regional In<strong>for</strong>mation(NARD and Network Analysis Using Generalised Least Squares (NAUGLS),were applied to data from a network of 76 water-level recording stations inNorth Island, New Zealand. NAUGLS conveys more in<strong>for</strong>mation than NARI<strong>for</strong> maximizing <strong>regional</strong> in<strong>for</strong>mation about mean flows given a limited budget.NAUGLS is applied to low flows, mean flows and <strong>flood</strong> peaks <strong>for</strong> the Nelsonregion, South Island, to illustrate its use.INTRODUCTIONIn 1984, at the Seventh Session of its Commission <strong>for</strong> Hydrology, the WorldMeteorological Organization (WMO) set up a project to compare technologiesused by hydrological and meteorological services of its member countries todesign networks. This project is known as Intercomparison of OperationalHydrological Network Design Techniques (HYNET).WMO member countries, including New Zealand, have participated incomparing two network design aids developed and used in the United Statesof America (Moss and Tasker, 1991). The methods are Network Analysis <strong>for</strong>Regional In<strong>for</strong>mation (NARI) and Network Analysis Using Generalised LeastSquares (NAUGLS). Both are in a HYNET computer program (Moss and Tasker,1ee0).These aids aim to define networks that efficiently provide in<strong>for</strong>mation <strong>for</strong>estimating statistical variables of streamflow at ungauged sites in a homogeneousregion. Estimation is based on a multiplicative regression model of a streamflowvariable against physiographic and climatic characteristics.NARI uses ordinary least squares to calibrate the regression relation and isbased on simulations using stochastic hydrology. NAUGLS uses generalised leastsquares (Stedinger and Tasker, 1985) in which values of computed strearnflowcharacteristics at each gauged site are weighted in inverse relation to the estimateof their precision. NAUGLS does not rely on simulation and is moremathematically elegant than is NARI. However, NAUGLS entails somesimplifying assumptions in developing its weighting scheme. HYNET enablesus to test whether the added elegance is a practical improvement over the moresimplistic NARI.HYNET uses randomly selected subsets from existing hydrologic data tosimulate the design and evaluation of a network. Repeated sampling providesstatistics describing the effectiveness of the network design in addressing a specifiedcommon objective. These statistics <strong>for</strong>m a basis <strong>for</strong> comparison.93