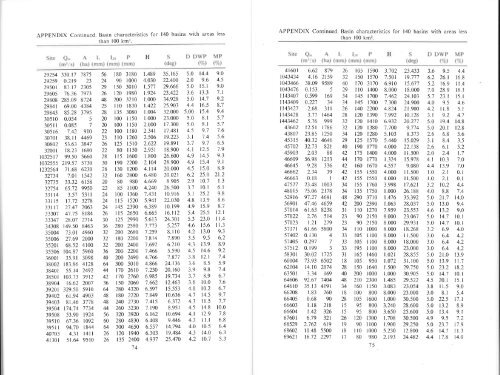
APPENDIX Continued. Basin characteristics <strong>for</strong> 140 <strong>basins</strong> with areas lessthan 100 km2APPENDIX Continued. Basin characteristics <strong>for</strong> 140 <strong>basins</strong> with areas lessthan 100 kmSite Q. A l, Izo P(m3/s) (ha) (mm) (mm) (mm)29254 330.17 787529259 0.219 2329501 8<strong>1.</strong>17 230s29605 76.36 797329808 28s.09 872429841 ó9.00 438429843 85.28 379530510 0.054 5305t1 0.085 130516 7.42 9103070r 38.11 446930802 53.63 384732001 18.23 ló80t032517 99.50 5660103255s 219.s7 5'7301232564 7<strong>1.</strong>68 623032734 7.01 t5423273s 33.32 615832754 65.72 995033114 3.57 531 I33 r r5 17 .72 327833117 27.47 206333307 47.15 818433347 28.07 2'71434308 149.50 846335004 73.01 496035006 27.69 200035201 68.52 410035506 104.87 59603600r 35.91 309838002 r83.86 412838401 55.14 24923850t 103.73 391238904 16.62 200739201 329.50 591039402 6<strong>1.</strong>94 490339403 8<strong>1.</strong>46 3'778395A1 174.74 '773439508 53.90 1924395r0 67.36 1092395¡l 94.70 t84440'703 4.31 l41l4r30r 5l-64 951056 180 3180 <strong>1.</strong>48924 90 r000 4.03029 150 3010 <strong>1.</strong>57726 120 1980 <strong>1.</strong>92448 200 3210 <strong>1.</strong>00025 I t0 1830 <strong>1.</strong>42228 135 3080 <strong>1.</strong>00420 r00 l 150 <strong>1.</strong>00020 100 l 150 2.00022 r00 II80 2.34123 1 l0 r 260 2.50626 125 1510 2.62222 80 I 150 2.95128 I r5 1ó00 <strong>1.</strong>80030 t90 2200 2.10428 130 1200 4.11432 r60 2800 6.4802A 80 980 4.66922 85 I 100 4.24024 100 1360 7 .43124 U5 1520 5.94124 145 2390 6.38926 I l5 2650 6.66530 t25 2990 5.61336 280 2580 7.77332 200 2680 7.2s932 180 2200 7.81432 200 2400 7.69236 200 2200 7.466q 200 2490 4.76664 300 5010 4.866M ltj 261042 '7.230t70 2760 6.98536 150 20ó0 7.66264 280 4320 6.59'748 180 2220 7.84948 240 2730 7.41544 260 3230 7.19056 320 3920 6.16260 280 4830 6.408@ 300 4650 6.55726 t20 1940 ó.30326 135 2400 4.93774S(dee)DDWP35.165 5.022.400 2.029.666 5.023.422 3.634.928 5.025.903 4.432.000 5.0023.000 5.0r7.300 5.01<strong>1.</strong>481 4.519.223 3.119.891 3.718.900 4.126.600 4.928.900 4.920.000 4.520.021 6.28.905 2.926.500 3.'7r0.916 5.122.030 4.810.199 4.9l6. t l2 5.424.301 5.35.25'7 4.68.1 l0 4.27.890 3.56.210 4.35.590 4.57.877 3.824.136 3.620.160 3.919.734 3.712.463 3.615.553 4.010.636 4.76.372 4.38.95 r 4.510.694 4.19.446 4.314.794 4.019.484 4.325.470 4.2(Vo)MP(%)14.4 9.09.6 4.5r5.l 9.013.3 7 .1t4.7 9.2ló.5 8.715.4 9.48.1 5.78.1 5.79.7 7.67.4 5.69.7 6.512.5 <strong>1.</strong>9t4.5 9-3t5.4 9.I15.0 8.925.0 2<strong>1.</strong>210.7 <strong>1.</strong>3t0.l 6.125.2 9.8r3.9 8.6t5.9 8.725.5 l2.l23.0 ll.415.6 r L313.0 9.39.5 6.2r3.9 8.914.6 9.2l2.l 7.48.5 5.99.8 7.48.9 6.710.0 7.610.2 6.714.5 9.7I <strong>1.</strong>5 7.714.8 10.012.9 7.8I l.r 6.8r 0.5 6.414.0 6.310.7 5.3Site a. A lr l:¡ P(m'/s) (ha) (mm) (mm) (mm)41601 6.62 879t043434 4.16 21591043466 38.09 95891043476 0.153 51t43407 0.599 t69n43409 0.22'7 341143427 2.68 3l It143428 3.77 14641443462 5.76 99943602 12.51 178643807 23.85 125045315 40.32 464645702 32.73 82t45903 2.03 8846609 56.98 121346645 9.28 33646662 2.34 3946663 0.r8 r4'752'7 23.48 r00348015 75.06 217852916 97.27 468t5ó901 47.46 465957014 6r.63 823857022 2.'76 51457023 t.2l 279s717t 6<strong>1.</strong>ó6 580057402 0.130 4574Q5 0.297 757512 0. t99 358301 30.02 172560104 73.93 650262104 14.10 207463501 3.34 16964606 92.67 740464610 35.r3 4r9166208 r.83 26066405 0.68 9066603 <strong>1.</strong>18 21866604 <strong>1.</strong>42 32667601 6.79 32168529 2.'762 6\968602 10.48 550069621 16.72 229726 r05 1590 3.70232 150 1570 7.50140 170 3170 6.91029 lr0 1400 8.00034 145 1700 7.46234 145 t700 7.30026 t40 2200 4.82428 r20 r390 7.99232 120 t4t0 6.93232 r20 1380 7.70034 120 1280 5.10329 125 1570 5.44040 190 1770 4.00042 175 1400 4.00044 170 1770 t.32442 160 1670 4.55742 155 1550 4.00042 r55 1550 4.00034 t55 1160 3-99834 135 1750 r.00048 290 37t0 <strong>1.</strong>47642 200 2390 r.0633l 110 1270 7.95923 90 2150 8.00023 90 2150 8.00034 r r0 1000 8.00033 105 l 100 8.00033 105 l 100 8.00033 r95 l 100 8.00031 165 t460 <strong>1.</strong>02tI 8 105 950 t .07228 150 1640 r.50040 200 1000 <strong>1.</strong>00048 210 2300 l-48534 160 I 150 3-08318 100 800 8.00028 105 1ó00 <strong>1.</strong>000r 5 95 800 3.24015 95 800 3-65026 120 1300 <strong>1.</strong>708t9 90 r 100 t.90018 ilO 1000 s.23017 80 980 2.193t5S(dee)D DV/P(Va)MP(Vo)23.433 3.6 9.5 4.419.777 6.2 26.1 I6.815.677 5.2 16.9 tt.418.000 t .0 28.9 18. r24.t03 5.7 23.1 l5.l24.900 4.0 9.5 4.62<strong>1.</strong>900 4.2 I I -8 5.110. r28 3.I 9.2 4.720.277 5.0 19.4 14.89.774 5.0 20.t 12.88.373 2.6 6.8 5.615.029 3- I 8.4 3.522.138 2.6 ó.1 5.2I <strong>1.</strong>500 2.0 2-4 <strong>1.</strong>715.978 4.1 10.3 7.09.080 4.4 13.9 7.0l <strong>1.</strong>500 r.0 2.1 0.1I <strong>1.</strong>500 l .0 2.t 0. I17.621 3.2 10.2 4.426.188 4.0 8.8 7.435.392 5.0 2<strong>1.</strong>7 14.028.037 5.0 13.0 9.423.s53 4.6 13.2 9.023.067 5.0 14.7 l0.l29.931 5.0 14.7 l0.l18.268 3.2 6.9 4.0l l.500 3.0 6.4 4.218.000 3.0 6.4 4.223.000 3.0 6.4 4.228.855 5.0 2<strong>1.</strong>0 13.93<strong>1.</strong>100 5.0 l3-9 n.729.750 5.0 23.2 18.230.905 5.0 14.7 l0. r29.522 4.5 20.1 l5.l23.054 3.8 r<strong>1.</strong>5 9.023.000 3.0 8.1 5.430.500 5.0 22.5 17.128.600 5-0 13.2 8.925.600 5.0 13.4 9. r30.500 4.9 9.5 7.229.250 5.0 23.7 t7 .912.800 4.6 14.7 I r.324.482 4.4 17.8 14.0
APPENDIX Continued. Basin characteristics <strong>for</strong> 140 <strong>basins</strong> with areas lessthan 100 km2Site a- A \ lzq P(m,/s) (ha) (mm) (mm) (mm)69627 <strong>1.</strong>39 12871t22 3.9ó 500871129 22.09 996371t78 38.19 787073501 44.33 450074353 3.01 240674360 2.03 28674367 2.02 5874701 6.77 95980201 30.53 716087301 389.18 978090ó05 28.85 43890607 193.82 123391402 19.13 16609t412 0.828 6693602 143.s7 1964Hló 70 850 <strong>1.</strong>000ló 80 950 8.00024 140 1560 3.927l8 60 900 <strong>1.</strong>16014 100 ll00 <strong>1.</strong>33013 45 550 <strong>1.</strong>000t6 65 750 3.000t7 70 lt80 <strong>1.</strong>000t4 60 830 <strong>1.</strong>ó8419 78 1200 3.61l56 440 7200 2.77048 220 3400 7.062r28 660 I1700 2.393a 130 2600 3.25028 lr0 2200 8.00060 260 5670 <strong>1.</strong>000REFERENCESS(deÐ27.9008.55024.rtl28.82018.90015.711I <strong>1.</strong>5009.225ló.51817.24429.30014.94333.74024.50030.500t6.023D DWP MP(Va) (%a)5.05.05.05.04.t4.33.02.04.73.24.74.14.04.25.02.724.3 18.120.1 15.522.0 15.918.7 14.610.2 7.910.0 7.88.1 5.55.6 r.06.4 4.28.9 5.819.9 13.017.7 9.218.0 I I .612.4 8.214.7 l0.lt2.3 8.0Beable, M.E.; McKerchar, 4.I., 1982: "Regional <strong>flood</strong> estimation in New Zealand',, Tech.Rep. 20, rùy'ater and Soil Division, MWD, Wellington. 132p.Hutchinson, P.D., 1990: "Regression estimation of low flow in New Zealand". pub. No.22, Hydrology Centre, DSIR Marine and Freshwater, Christchurch, 5 | p.McKerchar, A.I.; Pearson, C.P., 1989: "Flood <strong>frequency</strong> in New Zealand',. pub. No. 20,Hydrology Centre, DSIR Christchurch, 89p.MV/D, 1970: "Our land resources" Ministry of Works and Development, Wellington.Mosley, M.P., 1979: "Prediction of hydrologic variables from channel morphology, SouthIsland rivers". Journal of Hydrology (NZ) 18(2),109-120.NZ Met. Serv., 1985: "Climate map series I:2000,000. Part ó: Annual Rainfall" Ministryof Transport, Wellington.Pearson, c.P. this issue."Regional <strong>flood</strong> <strong>frequency</strong> <strong>analysis</strong> <strong>for</strong> <strong>small</strong> New Zealand <strong>basins</strong>.2. Flood <strong>frequency</strong> groups". Journal of Hydrology (NZ).Potter, K.W., Walker, J.F., 1985: "An empirical study of <strong>flood</strong> measurement error', ll'aterResources Research 2 I (3 ), 403406.Rodgers, M.W.; Thompson, S.M., 1991: "TIDEDA reference manual,' publ. No. 24,Hydrology Centre, DSIR, Christchurch, 200p.Tomlinson, 4.I., 1980: "The <strong>frequency</strong> of high intensity rainfalls in New Zealand, partI" Tech. Pub. 19, Water and Soil Division, MV/D, Wellington. 36p and 4 maps.Walter, K.M., 1990: "Index to hydrological recording sites in New Zeala¡d, 19g9,'. publNo. 21, Hydrology Centre, DSIR, Christchurch. I8lp.vy'ilkinson, L., 1986: "SYSTAT: The system <strong>for</strong> statistics". sysrAT Inc., Evanston, Illinois,522p.76REGIONAL FLOOD FREQUENCY ANALYSIS FORSMALL NEW ZEALAND BASINS2. FLOOD FREQUENCY GROUPSC P Pearson<strong>for</strong>merly: Hydrology Cent¡e, P O Box 22-037 , Christchurchnow: NIWAR Freshwater, P O Box 8602, ChristchurchABSTRACTOne hundred and seventeen <strong>small</strong> New Zealand drainage <strong>basins</strong> with areas ofless than 100 square kilometres were used <strong>for</strong> a <strong>regional</strong> <strong>flood</strong> <strong>frequency</strong> study.Each basin had annual maximum <strong>flood</strong> peak series of length l0 or more years.L-moment statistics of the <strong>flood</strong> series and basin physical characteristics wereused to classify the <strong>basins</strong> into six non-geographic <strong>flood</strong> <strong>frequency</strong> groups.Dimensionless <strong>flood</strong> <strong>frequency</strong> growth curves <strong>for</strong> each group offer robustalternatives to geographical <strong>regional</strong>isation and <strong>flood</strong> contour maps.INTRODUCTIONFloods are arguably the most common and devastating natural catastrophes(Wallis, 1988). Reliable <strong>flood</strong> <strong>frequency</strong> in<strong>for</strong>mation is required <strong>for</strong> developmentsnear rivers and streams as part of their design and protection. Small drainage<strong>basins</strong> rarely have waterlevel records and engineers must rely on <strong>regional</strong> <strong>flood</strong><strong>frequency</strong>methods to estimate <strong>flood</strong> exceedance probabilities.A review of<strong>regional</strong> <strong>flood</strong> <strong>frequency</strong> in New Zealand was conducted between1987 and 1989 (McKerchar and Pearson, 1989, 1990), and a design procedure<strong>for</strong> estimating <strong>flood</strong> peak quantiles <strong>for</strong> ungauged drainage <strong>basins</strong> was developedduring this review. The procedure prescribes the 2-parameter extreme value typeI _(EVl) distribution <strong>for</strong> annual maximum <strong>flood</strong> peaks, in conjunction withcontour maps of two <strong>flood</strong> statistics, which enable <strong>flood</strong> quantile estimates tobe derived <strong>for</strong> any basin, gauged or ungauged, in New Zealand. This approachis a <strong>for</strong>m of index <strong>flood</strong> procedure: one map provides mean annual <strong>flood</strong> estimates(Q,, "index <strong>flood</strong>') and the other provides dimensionless I / 100 annual exceedanceprobability (AEP) <strong>flood</strong> esrimates (Qroo/Q*). (AEP = l/T, where T is returnperiod in years).For drainage <strong>basins</strong> with areas less than l0 square kilometres the designprocedure is less precise. This reflects the predominance of larger catchmentswith longer annual maximum <strong>flood</strong> series, with more spatially averagedhydrological response masking out the individuality of <strong>small</strong>er <strong>basins</strong> with shorterseries; and the larger variability in stage-discharge rating curve extrapolationassociated with <strong>small</strong>er <strong>basins</strong>.In this paper robust <strong>regional</strong> <strong>flood</strong> <strong>frequency</strong> estimation procedures developedby Wallis (1980, 1988) are applied to <strong>small</strong> <strong>basins</strong> to derive dimensionless <strong>flood</strong><strong>frequency</strong> growth curyes <strong>for</strong> groupings of physically similar <strong>small</strong> <strong>basins</strong>. The5-parameter Wakeby distribution fitted by L-moments or probability-weightedmoments is a robust, accurate and efficient <strong>regional</strong> <strong>flood</strong> <strong>frequency</strong> procedure77