regional flood frequency analysis for small new zealand basins 1.
regional flood frequency analysis for small new zealand basins 1.
regional flood frequency analysis for small new zealand basins 1.
- No tags were found...

Create successful ePaper yourself
Turn your PDF publications into a flip-book with our unique Google optimized e-Paper software.
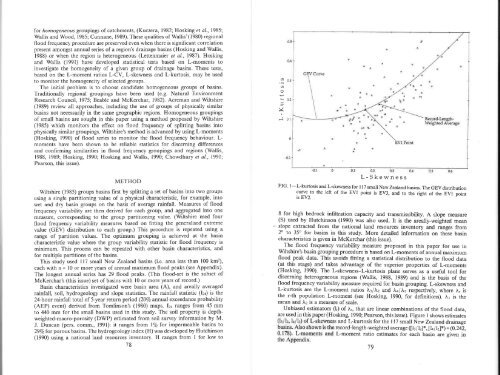
<strong>for</strong> homogeneous groupings of catchments, (Kuczera, 1982; Hosking et al., 1985;Wallis and Wood, 1985; Cunnane, 1989). These qualities of Watlis'(1980) <strong>regional</strong><strong>flood</strong> <strong>frequency</strong> procedure are preserved even when there is significant correlationpresent amongst annual series of a region's drainage <strong>basins</strong> (Hosking and Wallis,1988) or when the region is heterogeneous (Lettenmaier et al., 1987). Hoskingand WaÌlis (1991) have developed statistical tests based on L-moments toinvestigate the homogeneity of a given group of drainage <strong>basins</strong>. These tests,based on the L-moment ratios L-CV, L-skewness and L-kurtosis, may be usedto monitor the homogeneity of selected groups.The initial problem is to choose candidate homogeneous groups of <strong>basins</strong>.Traditionally <strong>regional</strong> groupings have been used (e.g. Natural EnvironmentResearch Council, 1975; Beable and McKerchar, 1982). Acreman and Wiltshire(1989) review all approaches, incÌuding the use of groups of physically similar<strong>basins</strong> not necessarily in the same geographic regions. Homogeneous groupingsof <strong>small</strong> <strong>basins</strong> are sought in this paper using a method proposed by Wiltshire(1985) which monitors the effect on <strong>flood</strong> <strong>frequency</strong> of splitting <strong>basins</strong> intophysically similar groupings. Wiltshire's method is advanced by using L-moments(Hosking, 1990) of <strong>flood</strong> series to monitor the <strong>flood</strong> <strong>frequency</strong> behaviour. L-moments have been shown to be reliable statistics <strong>for</strong> discerning differencesand confirming similarities in <strong>flood</strong> <strong>frequency</strong> groupings and regions (Wallis,1988, 1989; Hosking, 1990; Hosking and \üallis, 1990; Chowdhtry et al., l99l:'Pearson, this issue).METHODWiltshire (1985) groups <strong>basins</strong> first by splitting a set of <strong>basins</strong> into two groupsusing a single partitioning value of a physical characteristic, <strong>for</strong> example, intowet and dry basin groups on the basis of average rainfall. Measures of <strong>flood</strong><strong>frequency</strong> variability are then derived <strong>for</strong> each group, and aggregated into onemeasure, corresponding to the group partitioning value. (Wiltshire used four<strong>flood</strong> <strong>frequency</strong> variability measures based on fitting the generalised extremevalue (GEV) distribution to each group.) This procedure is repeated using arange of partition values. The optimum grouping is achieved at the basincharacteristic value where the group variability statistic <strong>for</strong> <strong>flood</strong> <strong>frequency</strong> isminimum. This process can be repeated with other basin characteristics, and<strong>for</strong> multiple partitions of the <strong>basins</strong>.This study used ll7 <strong>small</strong> New Zealand <strong>basins</strong> (i.e. area less than 100 km2),each with n = l0 or more years of annual maximum <strong>flood</strong> peaks (see Appendix).The longest annual series has 29 <strong>flood</strong> peaks. (fhis <strong>flood</strong>-set is the subset ofMcKerchar's (this issue) set of <strong>basins</strong> with l0 or more years of record.)Basin characteristics investigated were basin area (A), and areally averagedrainfall, soil, hydrogeology and slope statistics. The rainfall statistic (Izo) is the24-hotr rainfall total of5-year return period (207oan¡tal exceedance probability(AEP) event) derived from Tomlinson's (1980) maps. Iz¿ ranges from 45 mmto 440 mm <strong>for</strong> the <strong>small</strong> <strong>basins</strong> used in this study. The soil property is depthweighted-macro-porosity(DWP) estimated from soil survey in<strong>for</strong>mation by M.J. Duncan (pers. comm., l99l): it ranges from 1% <strong>for</strong> impermeable <strong>basins</strong> to29/61or porots <strong>basins</strong>. The hydrogeology index (H) was developed by Hutchinson(1990) using a national land resources inventory. H ranges from I <strong>for</strong> low to78Ø 0.3.t)oL 0.2VI-J o.lL-SkewnessFIG' l-L-kurtosis and L-skewness <strong>for</strong> I 17 <strong>small</strong> New Zealand <strong>basins</strong>. The GEV distributioncurve to the left of the EVI point is EV3, and to the right of the EVI pointis EV2.8 <strong>for</strong> high bedrock infiltration capacity and transmissibility. A slope measure(S) used by Hutchinson (1990) was also used. It is the areally-weighted mean- slope extracted from the national land resources inventory and ranges from2" to 35" <strong>for</strong> <strong>basins</strong> in this study. More detailed in<strong>for</strong>mation on these basincharacteristics is given in McKerchar (this issue).The <strong>flood</strong> <strong>frequency</strong> variability measure proposed in this paper <strong>for</strong> use inwiltshire's basin grouping procedure is based on L-moments of ànnual maximum<strong>flood</strong> peak data. This avoids fitting a statistical distribution to the <strong>flood</strong> data(at this stage) and takes advantage of the superior properties of L-moments(Hosking, 1990). The Lskewness-L-kurtosis plane serves as a useful tool <strong>for</strong>discerning heterogeneous regions (Wallis, 1988, 1989) and is the basis of the<strong>flood</strong> <strong>frequency</strong> variability measure required <strong>for</strong> basin grouping. L-skewness andL-kurtosis are the L-moment ratios À¡/Àz and Àq/Àz respectively, where À. isthe r-th population L-moment (see Hosking 1990, <strong>for</strong> definitions). Àr is themean and Àz is a measure of scale.Unbiased estimators (l) of À., that are linear combinations of the <strong>flood</strong> data,areusedinthispaper(Hosking'rt-tJ"i*31:î".'r'i'ö'P"iK:i¿:iîîåîlåxi:record-length-weighted average ([l:/ b]*,fh I lzl*) = (0.242,L-moment ratio estimates <strong>for</strong> each basin are given in79