regional flood frequency analysis for small new zealand basins 1.
regional flood frequency analysis for small new zealand basins 1.
regional flood frequency analysis for small new zealand basins 1.
- No tags were found...

You also want an ePaper? Increase the reach of your titles
YUMPU automatically turns print PDFs into web optimized ePapers that Google loves.
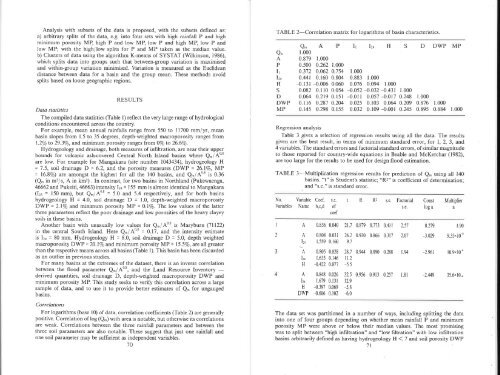
Analysis with subsets of the data is proposed, \,ith the subsets defined as:a) arbitrary splits of the data, e.g. into four sets with high rainfalt P and highminimum porosity MP, high P and low MP, low P and high MP, low P andlow MP; with the high/low splits <strong>for</strong> P and MP taken as the median value.b) Clusters of data using the algorithm K-means of SYSTAT (Wilkinson, I986),which splits data into groups such that between-group variation is maximisedand within-group variation minimised. Variation is measured as the Euclideandistance between data <strong>for</strong> a basin and the group mean. These methods avoidsplits based on loose geographic regions.RESULTSData statisticsThe compiled data statistics (Table l) reflect the very large range of hydrologicalconditions encountered across the country.For example, mean annual rainfalls range from 550 to 11700 mm/yr, meanbasin slopes from <strong>1.</strong>5 to 35 degrees, depth-weighted macroporosity ranges froml.2Vo to 29.3V0, and minimum porosity ranges from ÙVo to 26.6%.Hydrogeology and drainage, both measures ofinfiltration, are near their upperbounds <strong>for</strong> volcanic ash-covered Central North Island <strong>basins</strong> where Q./Au'oare low. For example <strong>for</strong> Mangakara (site number 1043434), hydrogeology H= 7.5, soil drainage D = 6.2, and the porosity measures (DWP = 26.lEo, MP= 16.870) are amongst the highest <strong>for</strong> all the 140 <strong>basins</strong>, and Q./A'o is 0.36(Q* in m3/s, A in km2) . In contrast, <strong>for</strong> two <strong>basins</strong> in Northland (Pukewaenga,46662 and. Pukeiti, 46663) intensity lz+= 155 mm is almost identical to Mangakara(Iz+ = 150 mm), but Q./Ao' = 5.0 and 5.4 respectively, and <strong>for</strong> both <strong>basins</strong>hydrogeology H = 4.0, soil drainage D = <strong>1.</strong>0, depth-weighted macroporosìtyDWP = 2.1/s and, minimum porosity MP = o.lTa. The low values of the latterthree parameters reflect the poor drainage and low porosities of the heavy clayeysoils in these <strong>basins</strong>.Another basin with unusually low values <strong>for</strong> Q-/40'8 is Maryburn (71122)in the central South Island. Here Q./N8 = 0.17, and the intensity estimateis Iz¿ = 80 mm. Hydrogeology H = 8.0, soil drainage D = 5.0, depth weightedmacroporosity DWP = 20.Wa and minimum porosity MP = 15.5Va, are all greaterthan the respective means across all <strong>basins</strong> (Table I ). This basin has been discardedas an outlier in previous studies.For many <strong>basins</strong> at the extremes of the dataset, there is an inverse correlationbetween the <strong>flood</strong> parameter Q-/Ao't, and the Land Resource Inventoryderived quantities, soil drainage D, depth-weighted macroporosity DWP and -minimum porosity MP. This study seeks to verify this correlation across a largesample of data, and to use it to provide better estimates of Q. <strong>for</strong> ungauged<strong>basins</strong>.CorrelationsFor logarithms (base l0) of data, correlation coefficients (Table 2) are generallypositive. Correlation of log (Q.) with area is notable, but otherwise its correlationsare weak. Correlations between the three rainfall parameters and between thethree soil parameters are also notable. These suggest that just one rainfall andone soil parameter may be sufficient as independent variables.70TABLE 2-Correlation matrix <strong>for</strong> logarithms of basin characteristics.Q,a. l.0ooA 0.879P 0.500\ 0.3720Á41lzqH -0.131s 0.082D 0.064DWP 0.116MP 0.145<strong>1.</strong>0000.262 <strong>1.</strong>0000.062 0.7540.160 0.804-0.006 0.0600.1l0 0.0540.219 0.1510.287 0.2040.298 0.155lrIzq H S D DWPMPl.0000.883 <strong>1.</strong>0000.076 0.094 <strong>1.</strong>0004.052 -0.032 -0.431 <strong>1.</strong>000-0.011 0.057 -0.017 0.248 <strong>1.</strong>0000-025 0.103 0.064 0.209 0.876 <strong>1.</strong>0000.032 0.109 -0.001 0.245 0.895 0.884 <strong>1.</strong>000Regression <strong>analysis</strong>Table 3 gives a selection of regression results using all the data. The resultsgiven are the best result, in terms of minimum standard error, <strong>for</strong> l, 2, 3, and4 variables. The standard errors and factorial standard errors, ofsimilar magnitudeto those reported <strong>for</strong> country-wide equations in Beable and McKerchar (1982),are too large <strong>for</strong> the results to be used <strong>for</strong> design <strong>flood</strong> estimation.TABLE 3-Multiplication regression results <strong>for</strong> prediction of Q. using all 140<strong>basins</strong>. "t" is Student's statistic; "Rz" is coefficient of determination;and "s.e." is standard error-No.VariableVariables NameI2AAlzoAIztHAII¿HDWPCoef.s.e.tRR2b,c,d ofcoef0.856 0.0400.808 0.031r 559 0.1600.805 0.028l.ó35 0.r464.422 0.0170.848 0.026<strong>1.</strong>679 0.t3t{.397 0.069{.606 0.102217 0.879 0.713 0.4n26.2 0.930 0.866 0.3t79.7281 0.9M 0.890 0.288<strong>1.</strong>2-5.5325129-58-60s.e . Factorial Const Multþliers.e. log a a2.572.07<strong>1.</strong>940.956 0.913 0.257 r.8r0.279 r.90-3.029 9.35*10-a-2.961 10.9"10 a-2.449 35.ó"10-¡The data set \üas partitioned in a number of ways, including splitting the datainto one of four groups depending on whether mean rainfall P and minimumporosity MP were above or below their median values. The most promisingwas to split between "high infiltration" and "Iow filtration" with low infiltration<strong>basins</strong> arbitrarily defrned as having hydrogeology H ( 7 and soil porosity DWP'11