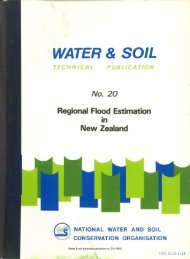
to five years of record. These error statistics are likely to be underestimatesbecause they do not include uncertainty about the placement of regions-Mosley (1979) used morphologic reach and cross-section variables to estimateQ. <strong>for</strong> 73 South Island rivers. The factorial standard error <strong>for</strong> the best equationusing all 73 rivers was <strong>1.</strong>7<strong>1.</strong> This reduced to <strong>1.</strong>52 <strong>for</strong> 63 non-braided rivers.McKerchar and Pearson (1989) drew contour maps to use to estimate Q-/Au'8 (division by A0 8 removes the effect of basin area) <strong>for</strong> any basin. The mapswere developed using data from 343 <strong>basins</strong>. Proportional errors of estimatesfrom the maps were defined by:E = t00 (Q., _ Q..)/Q*,.where: Q.. is the "<strong>regional</strong>" mean annual <strong>flood</strong> estimate inferred from the map,and Q,,, is the "at-site" estimate of mean annual <strong>flood</strong>, i.e. the estimate of Q-from the <strong>flood</strong> series.E values showed a mean of 8.6%a, (i.e. the bias) and a root mean square errorof -1557aE values ranged from 697o to 578%. Nineteen sites, (i.e. 570 of sites) withE exceeding 7070 were discarded as outliers. Statistics <strong>for</strong> the remaintng 95c/oof sites were bias = -0.970 and root mean square error = t227a, so that thestandard error of estimate of Q. from the maps was 1227a. This was animprovement over the Beable and McKerchar equations, which also discardedabottt 5Vo of the catchments as outliers.Results were more variable <strong>for</strong> <strong>small</strong> <strong>basins</strong> than <strong>for</strong> larger <strong>basins</strong>. For all<strong>basins</strong> with areas less than l0 km2, McKerchar and Pearson obtained thefollowing:All <strong>basins</strong> (10 km2Outlìers excludedNo- Basins4943Bias (Va)22-0.7Root MeanSquare ErrorOutline of problemThe error statistics <strong>for</strong>'all <strong>basins</strong> (10 km2" are unacceptably large <strong>for</strong> design<strong>flood</strong> estimation. With "outliers excluded" the error statistics are acceptable,but the question of what is an outlier is not resolved, and this raises doubtabout the reliability of the method. Also, the outliers are disproportionatelyrepresented among the <strong>basins</strong> with area (10 km2- Are the six records all inerror, or are they conveying in<strong>for</strong>mation about hydrological conditions notadequately represented by the contour maps? For example, the scale of themaps and the level of smoothing in their contours may mask much real variationbetween <strong>small</strong> <strong>basins</strong>. Can additional in<strong>for</strong>mation be employed to improve<strong>regional</strong> estimates of <strong>flood</strong> statistics?669234.(¿\,4:t")["r*\ y'-t.ii ,.80201rt0 100 200 kmFIG. I Location of the 140 <strong>small</strong> (A < 100 km2) New Zealand <strong>basins</strong> used in this study.Site numbers from Walter (1990).The additional in<strong>for</strong>mation available in the NZ Land Resource Inventory(Ministry of Works and Development, 1979) includes broad classes of rock type,overland slope, vegetation and soils. This in<strong>for</strong>mation can be extracted froma database <strong>for</strong> any basin boundary, and this study sought to use it to improveestimates of mean annual <strong>flood</strong> <strong>for</strong> <strong>small</strong> <strong>basins</strong>.\I/. z.t tz's.ro"r" //.Asazl73so1 474360. /,470167
METHODData compílationTo assemble sufficient data <strong>for</strong> comprehensive <strong>analysis</strong> the area threshold wasraised from l0 to 100 km2. Data <strong>for</strong> 140 <strong>basins</strong> with areas less than 100 km2,and at least six years offlow records were assembled (Fig. l).The data assembled <strong>for</strong> each basin were:Mean annual <strong>flood</strong> (Q.): This quantity is the arithmetic mean of peak-discharges <strong>for</strong> each of at least six years of record. These data were extractedfrom streamflow archives up to and including 1989 (Tideda: Rodgers andThompson, l99l). Length of record (N years) is given beside the mean. Wherepossible the stage series are checked <strong>for</strong> consistency against records <strong>for</strong> adjacent<strong>basins</strong>. Reliability ofthe rating curves, which are calibration curves to trans<strong>for</strong>mstage to discharge, is problematical. Most of these <strong>small</strong> <strong>basins</strong> are fittedwith weirs or bed-control structures calibrated using laboratory data. Wherefreld calibration is limited to low flows, it is difhcult to determine whetherthe adopted ratings are correct, especially at <strong>flood</strong> extremes beyond the rangeof conventional laboratory calibrations. This implies that annual maximum<strong>flood</strong> peak estimates <strong>for</strong> these <strong>basins</strong> are less reliable than those <strong>for</strong> <strong>basins</strong>with higher-stage current-meter gaugings (Potter and Walker, 1985).Area (A): Basin area is defined on the NZMS 260 (l:50000) or NZMS- I (l:63360) map series, and listed in Walter (1990).Rainfall intensity (Ir and Iz+): Five-year return period rainfall depths <strong>for</strong>-l-hr and 24-hr duration storms were estimated from maps in Tomlinson (1980).These depths are areal means <strong>for</strong> each basin, but are not adjusted by arealreduction factors. In the Tomlinson maps Ir is estimated from a sparse networkof recording raingauges, whereas Izq is estimated using a much morecomprehensive set of daily-read manual raingauges, and is more reliable.Mean annual raìnfall (P): An areal mean annual rainfall was estimatedfrom the map of 195l-1980 normals in NZ Met. Serv. (1985).Hydrogeology (H): Derivation of a basin estimate of "hydrogeology" is-explained in Hutchinson (1990). In summary, each combination of rock typesin the Land Resource Inventory is assigned a scalar number ranging fromI <strong>for</strong> low to 8 <strong>for</strong> high bedrock infiltration capacity and transmissibility. Lowvalues are assigned to strongly indurated sedimentary rocks, and igneous andmetamorphic rocks. Medium values are assigned to pyroclastics, loess, crushedargillites, "soft" volcanics, and weakly indurated sediments. High values areassigned to ashes, brecci4 scoria, lapilli, alluvium, colluvium, glacial till, peatand wind-blown sand. A basin mean is calculated as a sum weighted by theproportion of basin area occupied by each class.Slope (S): The Land Resource Inventory classifies parcels of land into-seven slope classes 4...G defined as:A -0-3o, flat to gently undulatingB 4-7", undulating-C 8-15', rollingD -16-20", strongly rollingE 21 25o, moderately steepF-26-35o, steep-G- >35', very steep 68Areally weighted mean slope is calculated as:S = <strong>1.</strong>5 S"+ 5.5 Su+ ll.5 S" + 18 S¿ + 23 S"+30.5 S¡+ 38 Sewhere Su, S¡, ... Se are the decimal proportions of the catchment area occupiedby ground in the slope classes A, B, ... G respectively.Soil Properties: A soil description applies to each Land Resource Inventory-parcel. Three soil properties considered to affect rapid runoff were (MJ Duncan,pers. comm-, l99l):Soit drainage (D): a scalar ranging from I to 7, I representing very poor- esenting excessive drainage.MacroporositY determined in theparticular soil horizon. A dePthofmacroPorositY <strong>for</strong> the wholehorizon. Typically macroporosities are in the range 0 to 30%0.Minimum porosity (MP): Minimum porosity <strong>for</strong> each soil class was-estimated.Area-weighted estimates of these three quantities were calculated'All the data are assembled in the Appendix, and summary statistics are givenin Table <strong>1.</strong>TABLE l-summary of basin characteristic statistics of 140 <strong>basins</strong> listed inAppendix.CHARACTERISTICMINIMUMMAXIMUMMEANSTANDARD DEVCHARACTERISTICMINIMUMMAXLMUMMEANSTANDARD DEVQ.(m3/s)0.054389.249.369. rH<strong>1.</strong>08.04.42.5A(ha)<strong>1.</strong>420996330612891S(deg)<strong>1.</strong>535.4t9.78.0I:(mm)l312834l3Dr.07.04.3t.lAnalysis proposedMultiple regression is proposed <strong>for</strong> the <strong>analysis</strong> using the <strong>for</strong>mQ*=aXrbXz"...lro P(mm) (mm)45 550660 I 1700t54 196872 l30lDWP MP(70) (Va)t.2 0.029.3 26.013.9 8.76.1 5.0where: X:, Xz -.. are basin characteristics (e.g. Area A, mean annual rainfallP, hydrogeology H, etc), and a, b, c ... are coefficients determined by multiplicativeregressron.69