AC Choksi Share Brokers Private Limited
AC Choksi Share Brokers Private Limited
AC Choksi Share Brokers Private Limited
- No tags were found...

You also want an ePaper? Increase the reach of your titles
YUMPU automatically turns print PDFs into web optimized ePapers that Google loves.
A C <strong>Choksi</strong><strong>Share</strong> <strong>Brokers</strong> <strong>Private</strong> <strong>Limited</strong>MOIL LTDMOIL MOIL LTD LTDMining wealth from manganese……..Initiation ReportSector: MiningRecommendation: BUYTarget Price:` 448Potential Upside: 16%Mining wealth from manganese……..Manganese Ore=Wealth ?A C <strong>Choksi</strong>Institutional ResearchSenior Research AnalystJinesh Sarat ShethJinesh@acchoksi.comSenior Research AnalystJinesh Sarat ShethJinesh@acchoksi.comresearch@acchoksi.com1
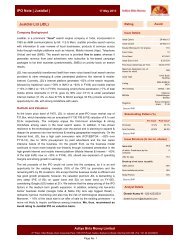
A C <strong>Choksi</strong><strong>Share</strong> <strong>Brokers</strong> <strong>Private</strong> <strong>Limited</strong>A C <strong>Choksi</strong> Institutional Research | Initiation Report|MININGMOIL April 26, 2011MOIL LTD‘Jinesh Sarat Shethjinesh@acchoksi.com+ 91 22 3021 9025RecommendationBUYTarget Price `448Recommendation Price `387Potential Upside(%) 15.8%IndustryMiningMarket Cap ( `Mn) 64,949<strong>Share</strong>s O/S (Mn) 168Face Value 10````Market StatsAverage Volumes 925,376Average Trades 17,336Average Turnover ( `Mn) 437<strong>Share</strong>holding Chart (as on 31/03/2011)`Key IndicesBSE Sensex 19602BSE Metals 16659NSE Nifty 5885Stock InfoBSE Code 533286NSE CodeMOIL <strong>Limited</strong>BloombergMOIL:INReuters CodeMOIL.BO52-Week High 59152-Week Low 367Life High 591Life Low 367105100959085FII's1%FI's/BanksMF 3%3%Others13%MOILPromoters80%<strong>Share</strong> Price Movement (Since listing)SensexInvestment ThesisProduction to double by 2020-The increase in steel consumption toaugur well for manganese ore producers; MOIL with near about 50%share in the country's Manganese ore production is all set to reap thebenefitsDemand for manganese ore is derived from steel, as the steelconsumption is expected to increase in future years, the manganese oreconsumption is also likely to follow. The company being the largestproducer of manganese ore by volume in India having access to 21.7million tonnes of proved and probable reserves and a total of 61.3million tonnes of resources (as per JORC code refer exhibit 51 & 52)islikely to gain the most under such a scenario.Zero Debt Company; with huge pile of cash, best placed to acquiremines in India and overseas; and can finance its capex internallyIn the high interest cost environment, MOIL is immune to increase ininterest rates at least directly, because it doesn't have the burden of debtin its balance sheet. That's one reason for its high PAT Margins (48.03%for FY 10).Exploring opportunities in Ferro Alloy space through JVs withSAIL & RINL; likely to add value in coming yearsProduction capacities in manganese alloys have been on the rise duringthe past ten years. The capacity increases by about 19-20% each year,whereas the domestic demand increases by 17-18%. In light of thebrighter future potential for steel sector, global demand for ferro alloysis expected to be robust; the company is planning to encash thisopportunity by entering into joint ventures with SAIL & RINL forsetting up ferro manganese and silico manganese plant. Collectively,this is expected to expand the ferro manganese capacity by 51,000Tonnes per annum and silico manganese capacity by 112,500 Tonnesper annum.Attractive Valuation: We initiate coverage with a BUY Rating onMOIL with a target price of `448, valuing it at 5.50x FY2012EEV/EBITDA, giving it an upside potential of 16% from current levels.80We expect MOIL's Sales, EBITDA & PAT to grow at a 2 year CAGR of19%, 24% & 24% respectively till FY 12 E. We have employed the_____________________________________________________________________________________Source: NSE, BSE, A C <strong>Choksi</strong> Institutional Research EV/EBITDA method for valuing MOIL.A C <strong>Choksi</strong> Institutional Research research@acchoksi.com 215-Dec-1022-Dec-1029-Dec-105-Jan-1112-Jan-1119-Jan-1126-Jan-112-Feb-119-Feb-1116-Feb-1123-Feb-112-Mar-119-Mar-1116-Mar-1123-Mar-1130-Mar-116-Apr-1113-Apr-1120-Apr-11
A C <strong>Choksi</strong><strong>Share</strong> <strong>Brokers</strong> <strong>Private</strong> <strong>Limited</strong>A C <strong>Choksi</strong> Institutional Research | Initiation Report|MINING MOILApril 26, 2011Production to double by 2020-The increase in steel consumption to augur wellfor manganese ore producers; MOIL with near about 50% share in the country'sManganese ore production is all set to reap the benefitsDemand for manganese ore is derived from steel, as the steel consumption isexpected to increase in future years, the manganese ore consumption is also likelyto follow.The company being the largest producer of manganese ore by volume in Indiahaving access to 21.7 million tonnes of proved and probable reserves and atotal of 61.3 million tonnes of resources (as per JORC code refer exhibit 51&52)is likely to gain the most under such a scenario.MOIL's share in the Indian Manganese ore market is around ~50%. We cansay that it enjoys a sort of monopoly in this space. MOIL believes to hold~17% of the proved reserves of manganese ore in India.The company has invited bids from companies across the globe to form JVs foracquisitions of mines abroad. to meet the rising demand for manganese ore. Thecompany has plans to ramp up production to ~1.5 mn tonnes by 2014-15. Thecompany is planning to double its production to ~2.0-2.5 mn tonnes by 2020.It produced 1,364,575 tonnes, 1,175,318 tonnes, 1,093,363 tonnes and 516,749tonnes of manganese ore in FY08, FY09, FY10 and HY11 respectively.Exhibit 4.Manganese Ore Production (Tonnes)Exhibit 5.Indian Mn Ore Market <strong>Share</strong>2,000,000The company plans toincrease the production to2.0 to 2.5 million tonnesby 2020.Rungta Mines7%SandurManganese10%OMC3%OMDC2%Others12%1,500,000Tata16%1,000,000MOIL50%500,0000FY 2006 FY 2007 FY 2008 FY 2009 FY 2010 FY 2011E‘P’ stands for Company ProjectedFY 2012EFY 2015PFY 2020PSource: MOIL , RHP, A C <strong>Choksi</strong> Institutional Research_____________________________________________________________________________________A C <strong>Choksi</strong> Institutional Researchresearch@acchoksi.com 3
A C <strong>Choksi</strong><strong>Share</strong> <strong>Brokers</strong> <strong>Private</strong> <strong>Limited</strong>A C <strong>Choksi</strong> Institutional Research | Initiation Report|MINING MOILApril 26, 2011Zero Debt Company; with huge pile of cash, best placed to acquire mines inIndia and overseas; and can finance its Capex internallyIn the high interest cost environment, MOIL is immune to increase in interestrates at least directly, because it doesn't have the burden of debt in its balancesheet. That's one reason for its high PAT Margins (48.03% for FY10).MOIL has a cash reserve of ~`18 bn as of 31-12-2010 (it was `17 bn as perthe RHP as on 30-06-10)(refer exhibit 6). On a per share basis it is ~`107(refer exhibit 7). The company has huge cash reserves which it may use to paydividends, acquire companies abroad and finance its capex. The managementhas taken up various proposals of mines expansion and is estimating to spend`7.7 bn over the next four years (refer exhibit 78). It is planning to investaround `1.5 bn in the JV with RINL & SAIL for setting up ferro alloy plantsat Bhilai and at Bobbili. The company is also planning to invest inexploratory activities in an area of 814.71 hectares allocated by the Govt. ofMaharashtra. The company's total outlay in various projects could be around`12.3 bn and the expansion are likely to take place by 2016-17 as per themanagement.Apart from the above plans, the management is looking to deploy its cash inacquisition of mines. It is exploring the possibility of buying mines and growinorganically by utilizing its cash reserves. The management didn't deny thatit can acquire companies if the valuations look appealing to them. Thecompany is reported to be in talks related to formation of joint venture,acquisition of the mines and long term supply with companies/mines fromSouth Africa, Gabon, Turkey and Chile.The company has been paying dividends at 20% (5 year average of 19.9%)we believe the company can maintain the dividend payout ratio at 20% forthe next couple of years at least. On a conservative estimate we expect thecompany to pay `1344 mn & `1428 mn of dividends ( `8.0 per share `8.5 pershare) for FY 11 E & FY12 E respectively (refer exhibit 8) . We expect thecompany to have a dividend yield of 2.17% in FY 12 E._____________________________________________________________________________________A C <strong>Choksi</strong> Institutional Researchresearch@acchoksi.com 4
A C <strong>Choksi</strong><strong>Share</strong> <strong>Brokers</strong> <strong>Private</strong> <strong>Limited</strong>A C <strong>Choksi</strong> Institutional Research | Initiation Report|MINING MOILApril 26, 2011Exhibit 6.Cash reserves in ` Mn30,00025,00020,00015,00010,0005,0000FY 2006 FY 2007 FY 2008 FY 2009 FY 2010 FY 2011EFY 2012E160Exhibit 7.Cash Per <strong>Share</strong> in `14012010080604020Exhibit 8.Dividend in ` Mn0FY 2006 FY 2007 FY 2008 FY 2009 FY 2010 FY 2011EFY 2012ESource:RHP, A C <strong>Choksi</strong> Institutional Research_____________________________________________________________________________________A C <strong>Choksi</strong> Institutional Researchresearch@acchoksi.com 5
A C <strong>Choksi</strong><strong>Share</strong> <strong>Brokers</strong> <strong>Private</strong> <strong>Limited</strong>A C <strong>Choksi</strong> Institutional Research | Initiation Report|MINING MOILApril 26, 2011Exploring opportunities in Ferro Alloy space through JVs with SAIL & RINL;likely to add value in coming yearsProduction capacities in manganese alloys have been on the rise during the past tenyears. The capacity increases by about 19-20% each year, whereas the domesticdemand increases by 17-18%. In light of the brighter future potential for steel sector,global demand for ferro alloys is expected to be robust; the company is planning toencash this opportunity by entering into joint ventures with SAIL & RINL for settingup ferro manganese and silico manganese plant. Collectively, this is expected toexpand the ferro manganese capacity by 51,000 Tonnes per annum and silicomanganese capacity by 112,500 Tonnes per annum.SAIL Joint Venture:The company entered into 50:50 JV with SAIL to set up a ferro manganese andsilico manganese plant at Nandini, near Bhilai, in Chhattisgarh. SAIL will leasethe land required for this proposed plant to the Joint Venture Company(JVC).MOIL has agreed to provide manganese ore of suitable quality at a price tobe set out in the manganese purchase agreement to be entered into with the JVC.SAIL has agreed to provide support services, power and raw materials and willhave the right of first refusal to purchase the ferro manganese and silico manganeseproduced by the JVC. The plant is intended to have an installed capacity of106,000 tonnes per annum, comprising 31,000 tonnes of ferro manganese and75,000 tonnes of silico manganese. The project is scheduled to be completed withina timeframe of 24 months at an estimated cost of `3,920 million. The debt equityratio of the JVC is 1:1. The JVC shall be responsible for arranging all the fundsneeded for this project. Based on industry estimates, these ferro-alloy plants, ifrunning at 100% capacity, are expected to require 0.33 million tonnes ofmanganese ore.RINL Joint Venture:MOIL has entered into one more 50:50 JV, this time with Rashtriya Ispat Nigam<strong>Limited</strong> (RINL)for the creation of a ferro manganese and silico manganese plant,proposed to be set up at Bobbili, Vizag District of Andhra Pradesh. MOIL hasagreed to lease the land and provide manganese ore of suitable quality at a priceset out in the manganese purchase agreement to be entered into by the JVC. RINLhas agreed to provide support services and raw materials required by JVC for theproduction of ferro manganese and silico manganese. The plant is intended to havean installed capacity of 57,500 tonnes per annum, comprising of 20,000 tonnes offerro manganese and 37,500 tonnes of silico manganese. This project is scheduled tobe completed within a timeframe of 24 months at an estimated cost of `2,062million. The debt equity ratio of the JVC is 1:1. The JVC shall be responsible for____________________________________________________________________________________arranging all the funds needed for this project._ A C <strong>Choksi</strong>Institutional Researchresearch@acchoksi.com6
A C <strong>Choksi</strong><strong>Share</strong> <strong>Brokers</strong> <strong>Private</strong> <strong>Limited</strong>A C <strong>Choksi</strong> Institutional Research | Initiation Report|MINING MOILApril 26, 2011Domestic Ferro Alloy ScenarioExhibit 9.Indian Imports of Ferro Alloys in Tonnes190,000180,000170,000160,000150,000140,000130,000120,000110,000100,00090,00080,00070,00060,00050,00040,00030,00020,00010,0000Other Ferro AlloysFerro MolybdenumSilico ChromeFerro SiliconFerro ManganeseFerro VanadiumFerro Silico MagnesiumHC/LC Ferro Chrome/ChCrSilico Manganese2005-06 2006-07 2007-08 2008-09 2009-10Exhibit 10.Idle Capacity of Ferro Alloys in Mn tonnesThe share of ferro manganese &silico manganese imports out oftotal imports of ferro alloys were15.2% & 0.7% respectively for2009-10. According to theIndian Ferro Alloy Producers’Association (IFAPA) as a resultof imports there was a foreignexchange outflow of `12517 Mn.India has 38% capacity of totalferro alloys (40% in case ofManganese Alloys) lying idle(refer exhibit 10).It is capable to produce therequired alloy by utilising itsidle capacity.2.502.001.50IdleCapacityFerro Alloy Capacity (in million tonnes)Production (in million tonnes)Exhibit 11.Production of Manganese Alloys in tonnes1.001,300,000Silico ManganeseHC Ferro Manganese0.501,200,0001,100,0000.001,000,000900,000ManganeseAlloysChromiumAlloysFerroSiliconNobleAlloys800,000700,000600,000500,000400,000300,000200,000100,00002006-07 2007-08 2008-09 2009-10Source: MMR Bureau, IFAPA, A C <strong>Choksi</strong> Institutional Research_____________________________________________________________________________________ A C <strong>Choksi</strong> Institutional Researchresearch@acchoksi.com 7
A C <strong>Choksi</strong><strong>Share</strong> <strong>Brokers</strong> <strong>Private</strong> <strong>Limited</strong>A C <strong>Choksi</strong> Institutional Research | Initiation Report|MINING MOILApril 26, 2011Risk to our RatingsMOIL has plans to ramp up its production, but any decrease in demand for steelmay adversely affect prices and sales volumes for manganese oreManganese ore realisation and sales volume depends primarily on the demandfor consumption of manganese ore in the steel industry. Demand for steel productsis usually linked to regional or global economic growth. If economic growthdeclines the consumption of steel might decline leading to reductions in demand formanganese ore. Prices of steel are affected by factors such as demand & supply gap,prices of key raw materials, worldwide production capacity, capacity-utilizationrates, innovation or improvement in steel manufacturing process etc. Anysignificant decline in the price of steel could result in the decline of manganese oreprice which can adversely affect MOIL's business and our forecasts.If JV's don't kick in at the expected timeFor MOIL to increase sales in its value added products, the JV with SAIL &RINL needs to start contributing at the expected time. Any delay in such mightadversely affect the business. However we have not factored anything on the JVfront as we believe that they might start contributing from FY 14 onwards.The Draft Mines and Minerals (Development and Regulation) Bill, 2010 thathas been proposed to replace the Mines and Mineral Development andRegulation Act, 1957 may adversely affect the operating & financial results ofMOIL.The bill contemplates that the holder of the mining lease is liable to anannuity equal to 26.0% of the profit as annual compensation and employmentand other assistance in accordance with the Rehabilitation and ResettlementPolicy of the concerned State Government. It implies that it proposes a 26%share in mining profits. In its current form the impact of the enactment onMOIL's financial position couldn't be exactly determined. But this should notbe under estimated as it might pose a threat to MOIL's future profitability &our forecasts.Operating costs scale up & margin contraction.We have assumed that MOIL would be able to maintain its margins. Scalingup of operating costs more than expected combined with lower than expectedManganese ore realisations may pose a threat to our ratings._____________________________________________________________________________________ A C <strong>Choksi</strong> Institutional Researchresearch@acchoksi.com 10
A C <strong>Choksi</strong><strong>Share</strong> <strong>Brokers</strong> <strong>Private</strong> <strong>Limited</strong>A C <strong>Choksi</strong> Institutional Research | Initiation Report|MINING MOILApril 26, 2011Reliance on Few CustomersMOIL is heavily dependent on a few customers for its businessIt derives 51.5% of its revenues from its top ten customers. MOIL’s sales ofmanganese ore depends on a few customers heavily. Its top ten customers accountfor approximately 51.5% of sales of manganese ore for FY 2010. It sells themanganese ore to ferro alloy manufacturers that supply ferro alloys directly to steelplants. Approximately 99.0% of manganese ore production inFY 2010 was sold to manganese ore alloy manufacturers.Two customers account for nearly 40% of the sales to the top ten customers.The key customers of MOIL include Maharashtra Elektrosmelt <strong>Limited</strong> and BhilaiSteel Plant, which are both state entities that are subsidiaries of SAIL and whichtogether accounted for 22.1% of the manganese ore sales revenue in Fiscal 2010.The loss of revenues from such customers, in particular, Maharashtra Elektrosmelt<strong>Limited</strong> and Bhilai Steel Plant, might have an adverse impact on its results ofoperations and financial condition and on our forecasts.Source: MOIL, RHP, A C <strong>Choksi</strong> Institutional Research_____________________________________________________________________________________ A C <strong>Choksi</strong> Institutional Researchresearch@acchoksi.com 11
A C <strong>Choksi</strong><strong>Share</strong> <strong>Brokers</strong> <strong>Private</strong> <strong>Limited</strong>A C <strong>Choksi</strong> Institutional Research | Initiation Report|MININGMOILApril 26, 2011QuarterHighlightsExhibit 13.3QFY11 Income StatementBottom Line & Operating levelsStable:During the 3QFY11, its PAT grew by~2.9% y-o-y to `1.25 bn as compared to`1.21 bn in Q3FY10. On a nine monthbasis it registered a healthy growth of~41.7% from `3.21 bn (9MFY10) to`4.56 bn (9MFY11) in PAT .3QFY11 EBITDA increased marginallyover 3QFY10 (on y-o-y basis) to `1.61bn, an increase of ~4.0% from `1.55 bn.Whereas; the EBITDA jumped by~50.5% y-o-y from `4.04 bn for9MFY10 to `6.08 bn for nine monthsending 31-Dec-10.Margins showed an improvement forthe quarter:The PAT Margins for Q3FY11 were~49.4%; it marginally improved by~48 basis points (bps) over Q3FY10.The margins however increased by~384 bps on a nine month basis to~51.3%.Q3 FY 11 (31st Dec 10) Result Highlights(` in (` mn in except mn except per share per share data) data)MOIL LTD Q3FY11 Q3FY10 Growth 9MFY11 9MFY10 GrowthParticulars 31-Dec-10 31-Dec-09 YoY 31-Dec-10 31-Dec-09 YoYNet Sales 2532.0 2485.1 1.9% 8882.4 6776.7 31.1%(Increase)/decrease in stock in trade -230.7 19.2 -1301.6% -191.5 226.7 -184.5%Employee cost 552.8 491.2 12.5% 1474.5 1403.5 5.1%% of Net Sales 21.83% 19.77% 207bps 16.60% 20.71% -411bpsConsumption of raw materials 24.6 38.7 -36.4% 115.9 116.4 -0.4%% of Net Sales 0.97% 1.56% -59bps 1.30% 1.72% -41bpsRoyalty & Cess 101.5 95.4 6.4% 339.8 234.2 45.1%% of Net Sales 4.01% 3.84% 17bps 3.83% 3.46% 37bpsOther Expenditure 475.6 294.0 61.8% 1068.5 759.4 40.7%% of Net Sales 18.78% 11.83% 695bps 12.03% 11.21% 82bpsTotal Expenditure 923.8 938.5 -1.6% 2807.2 2740.2 2.4%% of Net Sales 36.48% 37.77% -128bps 31.60% 40.44% -883bpsEBITDA 1608.2 1546.6 4.0% 6075.2 4036.5 50.5%EBITDA Margin 63.52% 62.23% 128bps 68.40% 59.56% 883bpsDepreciation 73.8 63.9 15.5% 206.9 186.7 10.8%EBIT 1534.4 1482.7 3.5% 5868.3 3849.8 52.4%EBIT Margin 60.60% 59.66% 94bps 66.07% 56.81% 926bpsOther income including provisions w/back 337 352.7 -4.5% 950.7 995.5 -4.5%EBIT(including Other Income) 1871.4 1835.4 2.0% 6819.0 4845.3 40.7%Interest Expense 0.0 0.0 - 0.0 0.0 -Profit from ordinary activities before tax 1871.4 1835.4 2.0% 6819.0 4845.3 40.7%% of Net Sales 73.91% 73.86% 5bps 76.77% 71.50% 527bpsTax 621.5 620.7 0.1% 2262.1 1629 38.9%% of Net Sales 24.55% 24.98% -43bps 25.47% 24.04% 143bpsProfit after tax 1249.9 1214.7 2.9% 4556.9 3216.3 41.7%PAT Margin 49.36% 48.88% 48bps 51.30% 47.46% 384bpsPaid up equity capital (Face value ` 10) 1680 1680 - 1680 1680 -EPS(Basic and Diluted) 7.44 7.23 2.9% 27.12 19.14 41.7%( in ` )Source: MOIL Ltd, A C <strong>Choksi</strong> Institutional ResearchThe EBITDA margins showed a decentincrease of ~128 bps and ~883 bps over3 month y-o-y and 9 month y-o-y to~63.5% and ~68.4%.Sales growth of 31.1% on 9 monthbasis:The nine month ending 31-Dec-2010 net sales showed a growth of ~31.1% to `8.88 bn from `6.78 bn over thecorresponding period of previous year. The top line was flat during the quarter ending 31-Dec-10; growing by 1.9%over the same quarter for previous year. MOIL registered net sales of `2.53 bn as compared to `2.49 bn in Q3FY10._____________________________________________________________________________________ A C <strong>Choksi</strong> Institutional Researchresearch@acchoksi.com 12
A C <strong>Choksi</strong><strong>Share</strong> <strong>Brokers</strong> <strong>Private</strong> <strong>Limited</strong>A C <strong>Choksi</strong> Institutional Research |Initiation Report|MINING MOILAbout MOILApril 26, 2011“MOIL BHAVAN”,1-A, Katol Road,Nagpur 440 013,MaharashtraExhibit 14.MOIL HQAwards & AchievementsMOIL is a Miniratna Category-I PSU under the Ministry of Steelhas signed a Memorandum of Understanding with the Government for theyear 2009-10.This is the 18th consecutive year that MOIL signed MoU.MOIL has been rated Excellent under MoU for the last 12 consecutive years.MOIL has been selected for the award in Mining and Metals Sector for itsexcellent performance under MoU for the year 2006-07.MOIL has been awarded the Prime Minister's Merit Certificate forExcellence in the archievements of MOU for the year2006-07.Winner ofNational Energy Conservation Award-1st prize in Mining Sector.It has bagged 2 Awards in National Safety by Min. of Labour.The financial performance during 2008-09 is highest eversince inception of MOIL.The company was incorporatedin the year 1962 as ManganeseOre (India) <strong>Limited</strong>. 80% of itsshares are held by the Govt. ofIndia, Maharashtra & MP.The company is the largestproducer of manganese ore inIndia(about 50%) and isamongst the top globally.In addition to medium grademanganese ore, It produceshigh carbon ferro manganeseHCFN and electrolyticmanganese dioxide EMD, bothare value added productsSource: MOIL Ltd, RHP, A C <strong>Choksi</strong> Institutional Research_____________________________________________________________________________________A C <strong>Choksi</strong> Institutional Researchresearch@acchoksi.com 13
A C <strong>Choksi</strong><strong>Share</strong> <strong>Brokers</strong> <strong>Private</strong> <strong>Limited</strong>A C <strong>Choksi</strong> Institutional Research |Initiation Report|MININGMOILApril 26, 2011Recent changes in holding of sharesExhibit 15.Promoter HoldingTop <strong>Share</strong>holdersThe President Of IndiaGovernor Of MaharashtraExhibit 16.Changes observed in shareholding patternover 3Q FY 11Source: NSE, A C <strong>Choksi</strong> Institutional Research<strong>Share</strong>s in Mn %120.24 71.57%7.76 4.62%6.41 3.81%Governor Of Madhya PradeshPromoters 134.40 80.00%Others 33.60 20.00%Total 168.00 100.00%as on 31st March 2011<strong>Share</strong>holding Pattern31/12/201031/03/2011<strong>Share</strong>s % <strong>Share</strong>s % Increase/ DecreasePromoters 134,400,000 80.00% 134,400,000 80.00% 0.00%FII's 1,621,255 0.97% 2,225,601 1.32% 0.36%MF 3,029,925 1.80% 5,413,642 3.22%FI's/Banks 2,737,861 1.63% 4,458,511 2.65%Others 26,210,959 15.60% 21,502,246 12.80%Total 168,000,000 100.00% 168,000,000 100.00%1.42%1.02%-2.80%0.00%The Government ofIndia, Maharashtra &Madhya Pradeshdivested 10%, 5% and5% respectively in therecent MOIL IPO.The IPO price was`375. It got listed on15th December 2010.However the stock hasunderperformed sincelisting (refer exhibit 67),foreign and domesticinstitutions haveincreased theirholding by 2.8% inthe last three months(refer exhibit 16).FII’s, MF’s &FI’s/Banks increasedtheir stake by 0.4%,1.4% & 1.0%respectively.However noninstitutional segmenthave decreased theirholding by the same2.8%._____________________________________________________________________________________A C <strong>Choksi</strong> Institutional Researchresearch@acchoksi.com 14
A C <strong>Choksi</strong><strong>Share</strong> <strong>Brokers</strong> <strong>Private</strong> <strong>Limited</strong>A C <strong>Choksi</strong> Institutional Research |Initiation Report|MINING MOILApril 26, 2011Board OfDirectorsConsists of highly experiencedindividuals.Shri. K. J. SinghChairman & Managing DirectorDirector FinanceDirector CommercialDirector Production & PlanningShri. M. A. V. GouthamDirector (Finance),Whole Time DirectorShri. A. K. MehraDirector(Commercial),Whole Time DirectorShri. G. P. KundargiDirector (Pr & Pl),Whole Time DirectorNominee Director - Govt. of IndiaDr. Dalip SinghJoint Secretary,Govt. of India, Ministryof SteelShri Vijay V KalePracticingChartered AccountantNominee Director - Govt. of MahShri. A. M. KhanPrincipal Secretary toGovt. of Maharashtra,Industry, Energy &Labour Deptt.In d e p e n d e n t D ire c torsDr. Madhu VijProfessor,FMS New DelhiNominee Director - Govt. of MPShri. S.K.MishraSecretary, Govt. ofMadhya Pradesh,Mineral ResourcesDeptt.Dr. Subir Kr.BhattacharyyaRetired CMD of IISCOShri Sanjeeva NarayanPracticingChartered AccountantShri Hem ChanderRetired IAS OfficerPhotoNotShri Bal Kishan GuptaRetired IRS OfficerAvailableKey management team has an average experience of over 20 years in miningindustry. The team possesses extensive knowledge in the fields of exploration,production, cost efficiencies, operational efficiencies and financial management.As of Oct 31, 2010, it had 6,693 employees of which 322 are executives, 2540are non executives and balance 3831 are workers.Dr.D.D. KaushikEx Director of ICSISource: MOIL Ltd, RHP, A C <strong>Choksi</strong> Institutional Research_____________________________________________________________________________________A C <strong>Choksi</strong> Institutional Researchresearch@acchoksi.com 15
A C <strong>Choksi</strong><strong>Share</strong> <strong>Brokers</strong> <strong>Private</strong> <strong>Limited</strong>A C <strong>Choksi</strong> Institutional Research |Initiation Report|MINING MOILApril 26, 2011Exhibit 17.Organisation flow chartSource: RHP_____________________________________________________________________________________A C <strong>Choksi</strong> Institutional Researchresearch@acchoksi.com 16
A C <strong>Choksi</strong><strong>Share</strong> <strong>Brokers</strong> <strong>Private</strong> <strong>Limited</strong>A C <strong>Choksi</strong> Institutional Research |Initiation Report|MINING MOILApril 26, 2011Characteristics of ManganeseEvolutionManganese is said to have originated from the latter of the two blackminerals from Magnesia (currently known as Greece), both werecalled magnes. Both were thought to differ in gender. The malemagnes had a property to attract iron, and was the iron ore we nowknow as lodestone or magnetite, and which probably gave us theterm magnet. The female magnes ore did not attract iron, but wasused to decolorize glass. This feminine magnes was later calledmagnesia, known now in modern times as pyrolusite ormanganese dioxide. The metal isolated from it became known asmanganese later on.Chemical & Physical PropertiesName: ManganeseSymbol: MnAtomic Number: 25Atomic Mass: 54.938049 amuBoiling Point: 1962.0 °C (2235 K, 3564 °F)Melting Point: 1246 °C (1519 K, 2275 °F)Number of Neutrons: 30Number of Protons/Electrons: 253Atomic Volume:7.39 cm /molClassification: Transition MetalOther FeaturesWhat is Mn Ore ?Crystal Structure: cubic: body centered3Density @ 293 K: 7.43 g/cmColor: silverish/grayish“Mn” is the chemical symbol of manganese. It is a brittle, sivery- graymetal that looks much like iron. It is difficult to fuse, but easy tooxidize. Manganese in alloy form is an essential input in steel making,Manganese is the 12th most abundant element widely distributed inthe earth's crust and the fourth most used metal after iron,aluminium and copper._____________________________________________________________________________________A C <strong>Choksi</strong> Institutional Researchresearch@acchoksi.com 17
A C <strong>Choksi</strong><strong>Share</strong> <strong>Brokers</strong> <strong>Private</strong> <strong>Limited</strong>A C <strong>Choksi</strong> Institutional Research |Initiation Report|MINING MOILApril 26, 2011Uses of ManganeseThe demand for Manganese ore is derived from the steel industry.As per the Indian Bureau of Mines (IBM), the standard consumption of manganese ore forsteel making which was around 46 kg per tonne of steel is expected to be low at around 30kg per tonne due to technological upgradation.Manganese is mined as an oxide ore, converted to ferromanganese or silico-manganese in ablast furnace/electric arc furnace, and then used mainly in the steel production process.Exhibit 18.Essential Mn ores’Manganese ores of major commercial importanceName of Ore Chemical FormulaMn ContentPyrolusite MnO2Mn 63.2%PsilomelaneMn commonly45-60%Manganite Mn2O3. H2OMn 62.4%BrauniteManganese oxide containing water and varyingamounts of oxides of Ba, K and Na as impurities3Mn2O3, MnSiO3Mn about 62% andSiO2 about 10%Source: IBM (Indian Bureau of Mines), A C <strong>Choksi</strong> Institutional ResearchGrades of Manganese oreExhibit 19.Grades of Mn oreGrade Specifications:High Grade Grade with >= 44% Mn contentMedium Grade Grade with > 30% and < 44% MnLow Grade Grade with =< 30% Mn contentSource: RHP, CARE Research, A C <strong>Choksi</strong> Institutional Research_____________________________________________________________________________________A C <strong>Choksi</strong> Institutional Researchresearch@acchoksi.com 18
A C <strong>Choksi</strong><strong>Share</strong> <strong>Brokers</strong> <strong>Private</strong> <strong>Limited</strong>A C <strong>Choksi</strong> Institutional Research |Initiation Report|MINING MOILApril 26, 2011Exhibit 20.Manganese Ore Industry StructureSource: RHP, A C <strong>Choksi</strong> Institutional Research_____________________________________________________________________________________A C <strong>Choksi</strong> Institutional Researchresearch@acchoksi.com 19
A C <strong>Choksi</strong><strong>Share</strong> <strong>Brokers</strong> <strong>Private</strong> <strong>Limited</strong>A C <strong>Choksi</strong> Institutional Research |Initiation Report|MINING MOILApril 26, 2011Exhibit 21.Global Crude Steel Production in Million TonnesSteel Sector : Global Scenario1,4001,2001,00080060040020002000 2001 2002 2003 2004 2005 2006 2007 2008 2009 2010OceaniaAsiaMiddle EastAfricaSouth AmericaNorth AmericaC.I.S.Rest of EuropeExhibit 22.Crude Steel Production: BRIC vs Other major producersSource: World Steel Association, A C <strong>Choksi</strong> Institutional Research_____________________________________________________________________________________A C <strong>Choksi</strong> Institutional Researchresearch@acchoksi.com 20
A C <strong>Choksi</strong><strong>Share</strong> <strong>Brokers</strong> <strong>Private</strong> <strong>Limited</strong>A C <strong>Choksi</strong> Institutional Research |Initiation Report|MINING MOILApril 26, 2011Indian Steel Industry SceneExhibit 23.Production, Import, Export & Consumption of Finished SteelTotal finished steel (alloy + non-alloy) ('000 tonne)Year Production for sale Import Export Consumption2005-06 46,566 4,305 4,801 41,4332006-07 52,529 4,927 5,242 46,7832007-08 56,075 7,029 5,077 52,1252008-09 57,164 5,841 4,437 52,3512009-10 60,892 7,296 3,235 57,675Apr-Dec 2010-11* 47,296 5,359 2,462 44,275Exhibit 24.Crude Steel Capacity UtilisationCrude SteelYearCapacityProduction Capacity utilisation('000 tonne)('000 tonne) (%)2005-06 5117146460912006-07 5684350817892007-08 5984553857902008-09 6634358437882009-10 729636487589Apr-Dec 2010-11* 56597**5059489Exhibit 25.Indian scenarioIndian steel scene: April - December, 2010-11 *Finished SteelItemQuantity(million tonne)Change%Production for sale 47.37.9Import 5.42.8Export 2.517.3Consumption 44.38Crude steel Production 50.64.5Capacity Utilisation (%) 89%* represents provisional** 2.5 million tonne capacity added during April-December 2010_____________________________________________________________________________________Source: JPC, Ministry of Steel, Govt. of India, A C <strong>Choksi</strong> Institutional ResearchA C <strong>Choksi</strong> Institutional Researchresearch@acchoksi.com 21
A C <strong>Choksi</strong><strong>Share</strong> <strong>Brokers</strong> <strong>Private</strong> <strong>Limited</strong>A C <strong>Choksi</strong> Institutional Research |Initiation Report|MINING MOILApril 26, 2011Indian Steel Sector in Global MapExhibit 26.2010 Crude Steel ProductionWorld crude steel production in 2010* (in million tonne)Rank Country Production1 China 6272 Japan 1103 USA 814 Russia 675 India 676 South Korea 587 Germany 448 Ukraine 349 Brazil 3310 Turkey 29Source: World Steel Association, Ministry of Steel, Govt. of India, A C <strong>Choksi</strong> Institutional ResearchGlobal crude steel production grew at a 10 year CAGR of 5.2%.Based on provisional numbers it grew at a whopping 15.5% in2010 over 2009.Exhibit 27.GDP growth of Indiain the last decadeIndia produced ~67 million tonnes, 4.7% of world production;it emerged as the 5th largest producer in 2010 and recorded agrowth of 11.3 per cent over 2009. India also is the largest spongeiron producing country in the world in 2010. As per Ministry ofSteel, India may become the second largest crude steel producer inthe world by 2015-16 if expansion plans are implemented asproposed.10%9%8%7%6%5%4%3%2%1%0%FY 91-00 FY 01-10 FY 04-08 FY 07-08 FY 08-09 FY 09-10China was the largest producer with ~627 million tonnes. Itrepresented 44.3% of the total world steel production.With global growth back on track we believe, we should see higherconsumption of steel by growing economies of the world.India, being one of the fastest growing economies of the world isexpected to consume more of steel in future years if at best it growsat a rate higher than the rate at which it has been growing in the last6-7 years. Even if it grows at the current rate we do not expect it toconsume lesser steel until any global economic environment turnsadverse._____________________________________________________________________________________A C <strong>Choksi</strong> Institutional Researchresearch@acchoksi.com 22
A C <strong>Choksi</strong><strong>Share</strong> <strong>Brokers</strong> <strong>Private</strong> <strong>Limited</strong>A C <strong>Choksi</strong> Institutional Research |Initiation Report|MINING MOILApril 26, 2011Exhibit 28.Global Ferro Alloy demand-supply scenarioGlobal & Domestic Ferro & Manganese Alloy PictureSupply 2004 2005 2006 2007 CAGR (%)HC FeMn 3,820 3,584 4,051 4,432 5.1Ref FeMn 968 1,023 1,068 1,125 5.1SiMn 6,010 6,048 6,688 7,600 8.1TOTAL 10,798 10,655 11,807 13,157 6.8DemandHC FeMn 3,764 3,667 4,093 4,724 7.9Ref FeMn 1,007 1,070 1,060 1,176 5.3SiMn 5,960 6,104 6,595 7,659 8.7TOTAL 10,731 10,841 11,748 13,559 8.1BalanceHC FeMn 56 -83 -42 -292Ref FeMn -39 -47 8 -51SiMn 50 -56 93 -59TOTAL 67 -186 59 -402Source: RHP, Eurasian Natural Resources Corporation (ENRC) presentations, A C <strong>Choksi</strong> Institutional ResearchExhibit 29.Global Manganese Alloy Production <strong>Share</strong>Other Europe2%CIS15%EEA8%China47%India7%Other21%Asia (other)4% Japan4%Americas6%Africa &Middle East7%Source: RHP, CARE Research, A C <strong>Choksi</strong> Institutional Research_____________________________________________________________________________________A C <strong>Choksi</strong> Institutional Researchresearch@acchoksi.com 23
A C <strong>Choksi</strong><strong>Share</strong> <strong>Brokers</strong> <strong>Private</strong> <strong>Limited</strong>A C <strong>Choksi</strong> Institutional Research |Initiation Report|MINING MOILApril 26, 2011Exhibit 30.India, Ferro Alloys ProductionIndian Ferro Alloy ScenarioFerro Alloys FY07 FY08 FY09 CAGR (%)HC Fe Mn 281 378 371 14.8Refined Fe Mn 16 13 14 -5.2Si Mn 738 859 845 7.0Refined Si Mn 45 53 46 1.4Fe Si 93 84 100 3.7Hc Fe Cr 801 948 815 0.9Refined Hc Fe Cr 0 0 2 246.4Other Ferro Alloys 28 30 28 -0.5Total 1,973 2,335 2,191 5.4Exhibit 31.India, Ferro Alloys ExportsFerro Alloys FY07 FY08 FY09 CAGR (%)HC Fe Mn 42 101 101 55.3Refined Fe Mn 12 13 20 28.7Si Mn 152 263 300 40.5Fe Si 8 9 37 117.0Hc Fe Cr 288 483 492 30.7Other Ferro Alloys 9 9 9 4.0Total 511 878 960 37.1Exhibit 32.India, Ferro Alloys ImportsFerro Alloys FY07 FY08 FY09 CAGR (%)HC Fe Mn 1 2 6 144.9Refined Fe Mn 11 20 16 20.6Si Mn 0 1 0 0.0Fe Si 87 96 83 -2.4Hc /Lc Fe Cr/ Ch Cr 19 20 12 -19.4Other Ferro Alloys 9 17 15 30.1Total 127 156 133 2.1Source: RHP, Indian Ferro Alloys Producers Association (IFAPA), A C <strong>Choksi</strong> Institutional Research_____________________________________________________________________________________A C <strong>Choksi</strong> Institutional Researchresearch@acchoksi.com 24
A C <strong>Choksi</strong><strong>Share</strong> <strong>Brokers</strong> <strong>Private</strong> <strong>Limited</strong>A C <strong>Choksi</strong> Institutional Research |Initiation Report|MINING MOILApril 26, 2011Manganese Ore: Global Scenario & Future OutlookThe world output of crude steel in the calendar year 2010 increasedby 15.5% to 1,400 million tonnes. Out of that Brazil accounts for(2.3%), Russia, (4.7%), India (4.7%), China (44.3%) and Japan(7.8%). As manganese ore demand follows the demand for steelconsumption, we believe that manganese ore demand is likely to behealthy till the steel demand is robust. If we were to link the demandfor steel consumption to global growth then we should see higherconsumption of steel by growing economies of the world and with theJapanese Tsunami & nuclear disaster we see steel consumption inJapan increase in years to come.A recent TEX report in steel guru states that the total quantity ofmanganese ore produced by six major manganese mines in theworld in the calendar year 2010 saw a substantial increase of53.8% on the average compared with that in the preceding year2009. The production Manganese ore has outpaced the globalcrude steel production. 2009 saw the manganese ore miningcompanies reducing their outputs to a significant extent. So withglobal expansion in production of crude steel the miners haveincreased the output by a substantial 80% in 2010. Q4 2010 theoutput of manganese grew by 11.8% over Q4 2009. The totalquantity of manganese ore produced by six major manganese minesin 2010 is reported to be 17.1 million tonnes in 2010 a decreasefrom 18.3 million tonnes in 2008. China, the biggest producer ofsteel (44.3%) imported 11.6 million tonnes of manganese ore in thecalendar year of 2010, an increase of 20.6% comparedwith that (9.6 million tons) in the preceding year of 2009. Chinahas an inventory of 3 to 4 months quantity of manganese ore storedat wharves in discharging ports of China as of the 31st Decemberof 2010. The over supply effect may cause the manganese ore pricesto remain muted over short term. However, manganese oredemand is expected to expand in future._____________________________________________________________________________________A C <strong>Choksi</strong> Institutional Researchresearch@acchoksi.com 25
A C <strong>Choksi</strong><strong>Share</strong> <strong>Brokers</strong> <strong>Private</strong> <strong>Limited</strong>A C <strong>Choksi</strong> Institutional Research |Initiation Report|MINING MOILApril 26, 2011Manganese Ore Reserves- India & WorldExhibit 32.Mn Ore Reserves In IndiaExhibit 33.Reserves In India - GradewiseParticulars Mn TonnesReserves 138.2Resources 240.4Total 378.6Source: RHP, UNFC, USGS, A C <strong>Choksi</strong> Institutional ResearchData is as of March 31, 2005(Based on latest publically available data)Exhibit 34.Reserves In India - Statewise Exhibit 35.State-Wise %Orissa 40.0%Karnataka 22.0%Madhya Pradesh 16.0%Maharashtra 8.0%Goa 5.0%Andhra Pradesh 4.0%Others* 5.0%Total 100.0%Source: RHP, Indian Bureau of Mines (IBM),A C <strong>Choksi</strong> Institutional Research* Others include Rajasthan, Gujarat, Jharkhandand West BengalGrade-Wise^ %Ferromanganese grade 7.0%Medium grade 8.0%BF grade 34.0%Others* 51.0%Total 100.0%Source: RHP, Indian Bureau of Mines (IBM), A C <strong>Choksi</strong> Institutional Research* Others include mixed, low, others, unclassified and notknown grades including 0.5 million tonnes of battery or chemical grade.Global Reserve Base 2009Global Ore Reserves Base Million Tonnes <strong>Share</strong>South Africa 4,000 76.9%Ukraine 520 10.0%Australia 160 3.1%India 150 2.9%China 100 1.9%Gabon 90 1.7%Brazil 57 1.1%Mexico 8 0.2%Other Countries 115 2.2%Total 5,200 100.0%Source: RHP, USGS (Report- US Geological Survey, Mineral CommoditySummaries - January 2009, A C <strong>Choksi</strong> Institutional Research_____________________________________________________________________________________A C <strong>Choksi</strong> Institutional Researchresearch@acchoksi.com 26
A C <strong>Choksi</strong><strong>Share</strong> <strong>Brokers</strong> <strong>Private</strong> <strong>Limited</strong>A C <strong>Choksi</strong> Institutional Research |Initiation Report|MINING MOILApril 26, 2011MT180,000160,000140,000120,000100,00080,00060,00040,00020,000Mn Ore: EXIM IndiaExhibit 36.Exports of Manganese OreSource: IBM, A C <strong>Choksi</strong> Institutional Research0China Japan Bhutan Korea, Rep. of Nigeria Other countriesMT400,000350,000Exhibit 37.Imports of Manganese Ore300,000250,000200,000150,000100,00050,0000SouthAfricaAustralia Gabon Ivory Coast Singapore Indonesia Turkey Zambia Thailand OthercountriesSource: IBM, A C <strong>Choksi</strong> Institutional Research_____________________________________________________________________________________A C <strong>Choksi</strong> Institutional Researchresearch@acchoksi.com 27
A C <strong>Choksi</strong><strong>Share</strong> <strong>Brokers</strong> <strong>Private</strong> <strong>Limited</strong>A C <strong>Choksi</strong> Institutional Research |Initiation Report|MINING MOILApril 26, 2011Manganese Ore ProductionExhibit 38.World Mn Ore Production (in ‘000 tonnes)Country 2006 2007 2008Australia 4,567 5,289 4,838Brazil 3,128 1,866 3,210China(e) 8,000 10,000 14,000Gabon 2,979 3,334 3,250(e)Ghana 1,578 1,173 1,090India* 2,116 2,551 2,616Kazakhstan 2,531 2,482 2,485South Africa 5,213 5,995 6,807Ukraine@ 1,606 1,720 1,400(e)Other countries 1,082 1,290 2,104World 33,800 35,700 41,800Source: IBM, World Mineral Production , A C <strong>Choksi</strong>Institutional Research@: Marketable* India’s production in 2006-07, 2007-08 and 2008-09 was2.12 mn tonnes, 2.70 mn tonnes and 2.83 mn tonnesrespectively.Exhibit 39.Manganese Reserves & Production of MOIL's Global peersGlobal Reserves Grade Annual ProductionManganese Players (Mn Tonnes) (%) (Mn Tonnes)ENRC 28.1 21.0 0.9BHP Billiton 267.6 37.0-48.0 4.5Eramet 81.0 N.A 2.0OM Holdings 20.5 21.4 0.65Vale 73.9 37.9 1.7Assore/Assomang 150.4 38.0-45.0 3.1Source: RHP, A C <strong>Choksi</strong> Institutional Research_____________________________________________________________________________________A C <strong>Choksi</strong> Institutional Researchresearch@acchoksi.com 28
A C <strong>Choksi</strong><strong>Share</strong> <strong>Brokers</strong> <strong>Private</strong> <strong>Limited</strong>A C <strong>Choksi</strong> Institutional Research |Initiation Report|MINING MOILApril 26, 2011Plan outlay for 11th Five-Year Plan (2007-12)Exhibit 40.Plan Outlay Benefits for Steel & related PSUsName of theOutlay for 11th Plan (Approved)Scheme/programmeA Scheme of PSUs I&EBR GBS Total1 Steel Authority of India Ltd. 274,090 0 274,0902 Rashtriya Ispat Nigam Ltd. 95,692 0 95,6923 NMDC Ltd. 71,470 0 71,4704 KIOCL 6,500 0 6,5005 MOIL 3,429 0 3,4296 Bird Group of Companies 1,480 10 1,4907 MECON Ltd. 90 630 7208 Ferro Scrap Nigam Ltd. 600 0 6009 Hindustan Steelworks Construction Ltd. 0 350 35010 MSTC Ltd. 300 0 30011 Sponge Iron India Ltd.* 250 0 250B Scheme of Ministry of Steel1 Scheme for promotion of R&D in 0 1,180 1,180the Iron & Steel SectorTotal 453,901 2,170 456,071Source: Ministry of Steel, A C <strong>Choksi</strong> InstitutionalResearch* Merged with NMDC Ltd. w.e.f. 01.07.2010For the 11th Five Year Plan (2007-12), the Planning Commission hasapproved total outlay of `456,071 Mn.Internal and Extra Budgetary Resources [I&EBR] of `453,901 mnand Gross Budgetary Support [GBS]of `2,170 Mn.Allocation for MOIL is around `3429 Mn._____________________________________________________________________________________A C <strong>Choksi</strong> Institutional Researchresearch@acchoksi.com 29
A C <strong>Choksi</strong><strong>Share</strong> <strong>Brokers</strong> <strong>Private</strong> <strong>Limited</strong>A C <strong>Choksi</strong> Institutional Research |Initiation Report|MINING MOILApril 26, 2011Japanese Tsunami & Nuclear Disaster Effect on SteelExhibit 41.Japan’s 2011 Earthquake disasterJapan, the world's third-largest consumer of steel , a majorproducer of steel (7.75% in 2010), world's second-largestexporter of scrap steel and second-biggest buyer of iron orethis year saw a massive earthquake in the Tohuku regionleading to Tsunami which further aggravated its problems byNuclear Leak.The regulators have rated the crisis at theFukushima Daiichi plant a seven on the International AtomicEnergy Agency's accident scale, which takes it on a par withthe 1986 Chernobyl disaster, the worst ever. As per latest dataabout 630,000 terabecquerels of radiation are estimated tohave been leaked at Fukushima whereas more than fivemillion were released at Chernobyl.This massacre is expected to weigh heavily on steelproduction in near term. It was reported in The Wall StreetJournal that at least four blast furnaces were closed by theearthquake, including Nippon Steel Corp.'s Kimitsu Works,Nippon's Kamaishi Steelworks, a JFE Steel Corp. plant in theChiba prefecture and Sumitomo Metals Industries Ltd.'sKashima Steel Works. Kamaishi and Kashima remain offline.Even though most of the country's steel factories are locatedinland, away from the eastern coast hit by Tsunami. Yetproduction is expected to get affected.The International Monetary Fund (IMF) gauged Japan'seconomic growth at 1.4% (revised downwards by 20 basispoints) in 2011 from 3.9 per cent last year, on account of theabove crisis. Our view for long term would be that if Japanwere to rebuild, which it eventually will, it would require lotsof steel. As a consequence, the steel consumption could goup leading to increase in the consumption of the manganeseore. So taking this into consideration we are positive onmanganese ore producers.Source: RHP, A C <strong>Choksi</strong> Institutional Research_____________________________________________________________________________________A C <strong>Choksi</strong> Institutional Researchresearch@acchoksi.com 30
A C <strong>Choksi</strong><strong>Share</strong> <strong>Brokers</strong> <strong>Private</strong> <strong>Limited</strong>A C <strong>Choksi</strong> Institutional Research |Initiation Report|MINING MOILExhibit 42.Mine Locations:MOILMaharashtraNagpur DistrictBeldongriGumgaonKandriMunsarBhandara DistrictChiklaDongri-BuzurgApril 26, 2011Madhya PradeshBalaghat DistrictBalaghatSitapatore/SukliTirodiUkwaSource: MOIL, RHP, A C <strong>Choksi</strong> Institutional Research_____________________________________________________________________________________A C <strong>Choksi</strong> Institutional Researchresearch@acchoksi.com 31
A C <strong>Choksi</strong><strong>Share</strong> <strong>Brokers</strong> <strong>Private</strong> <strong>Limited</strong>A C <strong>Choksi</strong> Institutional Research |Initiation Report|MINING MOILApril 26, 2011sMine SnapsMOIL’s mining operations include 10 manganese ore mines, 6 of which are located inthe Nagpur and Bhandara districts of Maharashtra ( Kandri, Munsar, Beldongri,Gumgaon, Dongri Buzurg and Chikla mines) and 4 of which are located in theBalaghat district of Madhya Pradesh (Balaghat, Sitapatore, Tirodi and Ukwa mines).Exhibit 43 -Vertical Shaft at Balaghat MineBalaghat MineThe Balaghat mine, the largest ofall its mines, is an undergroundmine located in the Balaghatdistrict in the state of Madhya Pradesh.Exhibit 44-Ferro Manganese Plant at Balaghat MineThe annual production (% share) atBalaghat were 300,051 MT (22.0%),284,563 MT ( 24.2%) , 300,000 MT(27.4%) and 151,452 MT ( 29.3%) ofmanganese ore ( average grade of 40.0%)in FY08, FY09, FY10 and HY11respectively. The manganese oreproduced from the mine is primarilysold to ferro alloy producers.To meet higher demand, th e companyhas taken up initiative to deepen thevertical shaft. The expected cost is` 65.1 mn.The company has outlined` 190 mn & `3000 mn fordeepening of Holm's Shaft andHigh speed shaft for mining at deeperlevels at Balaghat mine. The potentialbenefit as evaluated by the companycould be an increase in run - of - mine(ROM) production from 340,000 MTto 475,000 MT. The expected completiondate as indicated by the company isMarch, 2015 & 2016.Source: RHP, A C <strong>Choksi</strong> Institutional Research_____________________________________________________________________________________A C <strong>Choksi</strong> Institutional Researchresearch@acchoksi.com 32
A C <strong>Choksi</strong><strong>Share</strong> <strong>Brokers</strong> <strong>Private</strong> <strong>Limited</strong>A C <strong>Choksi</strong> Institutional Research |Initiation Report|MINING MOILApril 26, 2011sExhibit 45-EMD Plant at Dongri Buzurg MineDongri Buzurg MineExhibit 47-Dongri Buzurg mine at NightThe Dongri Buzurg mine, the 2ndlargest mine is the only fullymechanized open cast mine locatedin the Bhandara district in the state ofMaharashtra.Exhibit 46-Open Cast Mine at Dongri BuzurgThe annual production (% share)were 345,572 MT (25.3%),300,101 MT ( 25.5% ) , 282,758 MT(25.9%) and 115,328 MT ( 22.3%)of manganese ore ( average gradeof 42.0%) in FY08, FY09, FY10and HY11 respectively. Themanganese ore produced fromthe mine is sold to the chemicalindustry ferro alloy producers.To increase ROM productionfrom 350,000 MT to 560,000 MT, thecompany has plans to develop theopencast mine. It has earmarked` ? 1800 mn for the project. Theexpected completion date as indicatedby the company is March, 2014.Source: MOIL Ltd, RHP, A C <strong>Choksi</strong> Institutional Research_____________________________________________________________________________________A C <strong>Choksi</strong> Institutional Researchresearch@acchoksi.com 33
A C <strong>Choksi</strong><strong>Share</strong> <strong>Brokers</strong> <strong>Private</strong> <strong>Limited</strong>A C <strong>Choksi</strong> Institutional Research |Initiation Report|MINING MOILApril 26, 2011sChikla MineThe Chikla mine is an undergroundmine located in the Bhandara district inthe state of Maharashtra.The annual production (% share) were300,786 MT (22.0%), 198,037 MT(16.9%), 150,047 MT (13.7%) and79,049 MT (15.3%) of manganese ore(average grade of 36.0%) in FY08,FY09, FY10 and HY11 respectively.OTHERTirodi MineThe Tirodi mine is an open cast minelocated in the Balaghat district ofMadhya Pradesh.The annual production (% share) were141,141 MT (10.3%), 123,549 MT(10.5%), 106,764 MT (9.8%) and47,435 MT (9.2%) of manganese ore( average grade of 32.0%) in FY08,FY09, FY10 and HY11 respectively.Kandri MineThe Kandri mine is an underground mine located in theNagpur District of Maharashtra.The annual production (% share) were 141,141 MT (10.3%),123,549 MT (10.5%), 106,764 MT (9.8%) and 47,435 MT(9.2%) of manganese ore ( average grade of 32.0%) in FY08,FY09, FY10 and HY11 respectively. Mining operations arecurrently conducted through the underground method butopen cast mining has been used in the past. However, it iscurrently proposed to exploit manganese ore of the southlimb extension above level 50 by open cast mining.MINESUkwa MineThe Ukwa mine is an underground mine located in theBalaghat district of Madhya Pradesh.The annual production (% share) were 52,511 MT (3.9%),55,422 MT (4.7%), 50,751 MT (4.6%) and 25,929 MT(5.0%) of manganese ore ( average grade of 38.0%) in FY08,FY09, FY10 and HY11 respectively. The company plans tospend `181.1 mn on sinking of vertical shaft to increaseROM production from 55,000 MT to 100,000 MT.Source: RHP, A C <strong>Choksi</strong>Institutional ResearchGumgaon MineThe Gumgaon mine is an underground mine located in theNagpur district of Maharashtra.The annual production (% share) were 47,001 MT (3.5%),42,405 MT (3.6%), 41,001 MT (3.8%) and 24,634 MT (4.8%)of manganese ore ( average grade of 36.0%) in FY08,FY09,FY10 and HY11 respectively. In order to exploit this oresafely and systematically, a vertical shaft is being sunk at thismine at an estimated cost of `160.1 mn. The project isexpected to be completed by April 2011._____________________________________________________________________________________A C <strong>Choksi</strong> Institutional Researchresearch@acchoksi.com 34
A C <strong>Choksi</strong><strong>Share</strong> <strong>Brokers</strong> <strong>Private</strong> <strong>Limited</strong>A C <strong>Choksi</strong> Institutional Research |Initiation Report|MINING MOILApril 26, 2011sOther MinesMunsar MineSitapatore and SukliThe Munsar mine is an underground mine located in theNagpur district of Maharashtra.The annual production (% share) were 65,415 MT (4.8%),62,635 MT (5.3%), 60,760 MT (5.6%) and 23,713 MT (4.6%)of manganese ore ( average grade of 32.0%) in FY08, FY09,FY10 and HY11 respectively. Increase in ROM productionfrom 30,000 tonnes to 60,000 tonnes is aimed at by incurringan expenditure of `252 mn on the sinking of vertical shaft byApril, 2014.Beldongri MineThe Beldongri mine is an underground mine located in theNagpur district of Maharashtra.The annual production (% share) were 51,239 MT (3.8%),46,220 MT (3.9%), 32,598 MT (3.0%) and 14,637 MT (2.8%)of manganese ore ( average grade of 30.0%) in FY08, FY09,FY10 and HY11 respectively.The Sitapatore and Sukli mines are open cast mines locatedin the Balaghat district of Madhya Pradesh. Mining activitieswere historically undertaken through six pits at Sitapatore andeight pits at Sukli. However, since both mines are locatedunder forest cover, no mining operations were conducted afterthe decision of the Ministry Of Environment and Forest datedJanuary 16, 2009. The Sukli mine was partially granted forestand environment clearance in February 3, 2009. A portion ofthe Sukli mine of approximately 26 hectares has not beengranted such clearance and production remains suspended as aresult of its location less than 250 meters from forest land.The annual production at Sitapatore (% share) were 1,760 MT(0.1%), 1,840 MT (0.2%), 3,065 MT (0.3%) and 5,080 MT(1.0%) of manganese ore( average grade of 30.0%) in FY08,FY09, FY10 and HY11 respectively.Source: RHP, A C <strong>Choksi</strong> Institutional Research_____________________________________________________________________________________A C <strong>Choksi</strong> Institutional Researchresearch@acchoksi.com 35
A C <strong>Choksi</strong><strong>Share</strong> <strong>Brokers</strong> <strong>Private</strong> <strong>Limited</strong>A C <strong>Choksi</strong> Institutional Research |Initiation Report|MINING MOILApril 26, 2011sManganese Ferro-alloy ProcessingValue Addition through noncore segmentsThe Company has a ferro manganese plant at the Balaghat mine (refer Exhibit 44) with a capacity of10000 TPA of High Carbon Ferro Manganese(HCFM), with 6%-8% carbon grade. The annual productionwere 11,130 MT, 10,120 MT, 9,555 MT and 4,771 MT for FY08, FY09, FY10 and HY11.EMD ProcessingThe Company is major producer of Electrolytic Manganese Dioxide in India. It’s EMD plant is situated atDongri Buzurg mine (refer Exhibit 45) with a capacity of 1000 TPA. The annual production were 1,122MT, 1,240 MT, 1,150 MT and 390 MT for FY08, FY09, FY10 and HY11.Wind Power FarmMOIL has two wind farms, one in NagdaHills with a capacity of 4.8 MW and theother in Ratedi hills with a capacity of 15.2MW; both in the Dewas district ofMadhya Pradesh.Exhibit 48 - 20 MW Wind mill at Nagda and Ratedi nearDewas(MP)The company, subject to a 2.0%fee,distributes the electricity produced fromthe Nagda Hills wind farm to MadhyaPradesh state distribution and transmissioncompanies . The same quantum ofelectricity is then distributed by their gridsto the Balaghat mine and the ferromanganese plant of MOIL at Balaghat.Entire electricity generated from the 2ndwind farm at Ratedi Hills is sold to theMadhya Pradesh Power Trading Company<strong>Limited</strong>. The sales value is insignificant (lessthan 1% of the total sales revenues forHY11).Source: MOIL Ltd, RHP, A C <strong>Choksi</strong> Institutional Research_____________________________________________________________________________________A C <strong>Choksi</strong> Institutional Researchresearch@acchoksi.com 36
A C <strong>Choksi</strong><strong>Share</strong> <strong>Brokers</strong> <strong>Private</strong> <strong>Limited</strong>A C <strong>Choksi</strong> Institutional Research |Initiation Report|MINING MOILApril 26, 2011sExhibit 49 -Reserves & resources as per UNFCMOIL follows the United Nations FrameworkClassification for Fossil Energy and MineralResources (“UNFCFramework”)MinesReservesResourcesContentA B Total Mn% Phos% Sio2% Fe%BALAGHAT 13,079,274 7,121,196 1,502,078 21,702,548 40 0.15 15 6UKWA 4,561,303 1,315,355 3,105,377 8,982,035 38 0.15 18 7DONGRI BUZURG 3,481,363 7906150 0 11,387,513 42 0.2 15 7GUMGAON 2,705,862 615125 717,500 4,038,487 36 0.25 18 7TIRODI 1,256,455 328,850 202,082 1,787,387 32 0.25 22 7CHIKLA 1,217,316 2,427,194 635,250 4,279,760 36 0.2 25 7KANDRI 1,097,826 2178610 0 3,276,436 38 0.2 18 7MUNSAR 846,035 2,446,625 1,449,485 4,742,145 32 0.25 26 7BELDONGRI 326,430 54,960 0 381,390 30 0.25 18 7SITAPATORE 83758 203438 50000 337196 32 0.25 25 7NEW SATUK 30,365 12600 0 42,965 30 0.25 18 7SUKLI 29,258 0 130,000 159,258 30 0.25 25 7OLD SATUK 0 60000 0 60,000 0 0 18 7TOTAL 28,715,245 24,670,103 7,791,772 61,177,120Exhibit 50 -Recovery Factor of MinesRecovery Factor MiningMines% MethodBalaghat 67% UndergroundUkwa 60% UndergroundChikla 70% UndergroundTirodi 80% Open CastDongri Buzurg 90% Open CastBeldongriMunsar 70% UndergroundKandri 67% Underground67% Underground90% Open CastAs per UNFC Framework,“A” represents sum total of FeasibilityOre Resources & Prefeasibility OreResources.“B” represents Measured ore Resources+ Indicated Ore resources + Inferred OreResources._____________________________________________________________________________________Source: MOIL Ltd, RHP, A C <strong>Choksi</strong> Institutional ResearchA C <strong>Choksi</strong> Institutional Researchresearch@acchoksi.com 37
A C <strong>Choksi</strong><strong>Share</strong> <strong>Brokers</strong> <strong>Private</strong> <strong>Limited</strong>A C <strong>Choksi</strong> Institutional Research |Initiation Report|MINING MOILApril 26, 2011sExhibit 51 -Reserves as per JORCMinesReservesProved Probable TotalBALAGHAT 6,916,517 2,073,343 8,989,861DONGRI BUZURG 2,976,383 0 2,976,383GUMGAON 1,627,902 0 1,627,902UKWA 1,370,464 1,458,381 2,828,845CHIKLA 532,716 615,465 1,148,180KANDRI 382,036 0 382,036BELDONGRI 216,256 7,151 223,406TIRODI 136,696 798,385 935,081MUNSAR 73,206 1,172,019 1,245,225SITAPATORE & SUTLI 0 0 0DUMP 1,388,383 0 1,388,383TOTAL 15,620,558 6,124,744 21,745,302The resources of MOIL were reviewed byIMC, an independent mining and geologicalconsultancy firm, in accordance with thecriteria for internationally recognizedreserve and resource categories of theAustralasian Code for Reporting ofExploration Results, Mineral Resources andOre Reserves published by the Joint OreReserves Committee (“JORC”) of theAustralasian Institute of Mining andMetallurgy, Australian Institute ofGeoscientists and the Minerals Councilof Australia (the “JORC Code”).JORC code is a globally recognisedreporting system.It categorises a resourceinto Inferred, Indicated & MeasuredMineral Resource.Exhibit 52 -Resources as per JORCMinesResourceMeasured Indicated Measured + Indicated InferredBALAGHAT 12,706,529 7,136,631 19,843,160 1,488,218UKWA 4,386,071 1,386,885 5,772,956 3,036,676DONGRI BUZURG 3,307,092 7,479,033 10,786,125 227,500GUMGAON 2,600,205 615,125 3,215,330 717,500CHIKLA 1,214,197 2,398,809 3,613,006 624,750TIRODI 1,168,851 33,863 1,202,714 497,081MUNSAR 702,118 2,498,915 3,201,033 1,469,125KANDRI 570,203 2,648,965 3219168 0BELDONGRI 355,688 125,565 481,253 0SUTLI 29,258 0 29,258 130,000SITAPATORE 0 203,438 203,438 50,000DUMP 9,736,665 0 9,736,665 0TOTAL 36,776,877 24,527,229 61,304,106 8,240,850_____________________________________________________________________________________Source: MOIL Ltd, RHP, A C <strong>Choksi</strong> Institutional ResearchA C <strong>Choksi</strong> Institutional Researchresearch@acchoksi.com 38
A C <strong>Choksi</strong><strong>Share</strong> <strong>Brokers</strong> <strong>Private</strong> <strong>Limited</strong>A C <strong>Choksi</strong> Institutional Research |Initiation Report|MINING MOILApril 26, 2011sMine Wise Operating &Production FiguresExhibit 53 -Manganese Ore Mine Wise ProductionManganese Ore Production in TonnesMines FY 2008 FY 2009 FY 2010 HY 2011Underground MinesBalaghat 300,051 284,563 300,000 151,452Chikla 300,786 198,037 150,047 79,049Kandri 59,099 60,546 65,619 29,492Munsar 65,415 62,635 60,760 23,713Ukwa 52,511 55,422 50,751 25,929Gumgaon 47,001 42,405 41,001 24,634Beldongri 51,239 46,220 32,598 14,637Total Underground 876,102 749,828 700,776 348,906Opencast MinesDongri Buzurg 345,572 300,101 282,758 115,328Tirodi 141,141 123,549 106,764 47,435Sitapatore/Sukli 1,760 1,840 3,065 5,080Total Opencast 488,473 425,490 392,587 167,843Total 1,364,575 1,175,318 1,093,363 516,749Exhibit 54 -Underground vs Open CastExhibit 55 -Underground vs Open Cast1,600,0001,400,0001,200,0001,000,000800,000600,000400,000200,0000Underground Mines Opencast Mines TotalFY 2008 FY 2009 FY 2010 FY 2011 E FY 2012 EMOILs production is heavilydependent on Balaghat &Dongri MinesKandri6%Ukwa5%Gumgaon5%Munsar5%Beldongri3% Sitapatore/Sukli1%Other75%Chikla15%Tirodi9%DongriBuzurg22%Balaghat29%More than 51% productionfrom the two mines.As per the latest numbers;Balaghat (29.31%),Dongri Buzurg (22.32%),Chikla (15.30%) & Tirodi (9.18%)accounts for 76.10% of the totalMn Ore production of thecompany.The rest 23.90% is producedfrom the remaining 6 mines takentogether._____________________________________________________________________________________Source: MOIL Ltd, RHP, A C <strong>Choksi</strong> Institutional ResearchA C <strong>Choksi</strong> Institutional Researchresearch@acchoksi.com 39
A C <strong>Choksi</strong><strong>Share</strong> <strong>Brokers</strong> <strong>Private</strong> <strong>Limited</strong>A C <strong>Choksi</strong> Institutional Research |Initiation Report|MINING MOILApril 26, 2011sExhibit 56 -Sales Volumes350,000300,000250,000200,000150,000100,00050,000Exhibit 54 57 -Sales Realisation (in `/Tonne)9,0008,0007,0006,0005,0004,0003,00005,0613,35936,691 42,816 52,6705,4435,770Sales quantity (in Tonnes)6,08564,619 71,406Sales Realisation6,4266,810120,0467,732162,4877,922293,5838,307 8,337327,553Sitapatore Beldongri Gumgaon Ukwa Munsar Kandri Tirodi Chikla Balaghat DongriBuzurgBalaghat & Dongri Buzurghave the highest salesrealisation & reasonable costof miningSales realisations of two of theMOIL’s biggest mines Balghat(`8,337/tonne) & DongriBuzurg ( `8,307/tonne) is thehighest of all mines. MOIL canrealise highest price for itsproduce from the two mineswhich accountedfor ~53% of the total salesvolume.Dongri Buzurg has the lowestcost of mining at `1,188 pertonne. Cost of mining atBalaghat is also at a reasonablelevel of `2,355 per tonne.2,0001,0000Exhibit 58 -Mine Cost per tonne4,5004,0003,500Sitapatore Munsar Beldongri Chikla Tirodi Ukwa Kandri Gumgaon DongriBuzurg3,940Mine Cost/TonneBalaghat3,0002,5002,0001,5003,0772,576 2,5092,3552,151 2,0731,9741,7601,0001,1885000Ukwa Gumgaon Kandri Beldongri Balaghat Sitapatore Tirodi Chikla Munsar DongriBuzurg_____________________________________________________________________________________Source: MOIL Ltd, RHP, A C <strong>Choksi</strong> Institutional ResearchA C <strong>Choksi</strong>Institutiona l Researchresearch@acchoksi.com 40
A C <strong>Choksi</strong><strong>Share</strong> <strong>Brokers</strong> <strong>Private</strong> <strong>Limited</strong>A C <strong>Choksi</strong> Institutional Research |Initiation Report|MINING MOILApril 26, 2011sMarked underperformance not to stay for longMOIL vs Leading IndicesExhibit 59 -MOIL vs SensexExhibit 60 -MOIL vs Nifty105105100MOILSensexMOILSensex105105100MOILNifty10095100959590908585808015-Dec-10 15-Dec-1022-Dec-1022-Dec-1029-Dec-1029-Dec-105-Jan-115-Jan-11 12-Jan-1119-Jan-1112-Jan-1126-Jan-1119-Jan-112-Feb-1126-Jan-11 9-Feb-1116-Feb-112-Feb-1123-Feb-119-Feb-112-Mar-1116-Feb-11 9-Mar-1116-Mar-1123-Feb-1123-Mar-112-Mar-1130-Mar-119-Mar-11 6-Apr-1116-Mar-11 13-Apr-1120-Apr-1123-Mar-1130-Mar-116-Apr-1113-Apr-1120-Apr-119590908585808015-Dec-1015-Dec-1022-Dec-1022-Dec-1029-Dec-1029-Dec-105-Jan-115-Jan-1112-Jan-1112-Jan-1119-Jan-1119-Jan-1126-Jan-1126-Jan-112-Feb-112-Feb-119-Feb-119-Feb-1116-Feb-1116-Feb-1123-Feb-112-Mar-11 23-Feb-119-Mar-11 2-Mar-1116-Mar-11 9-Mar-1123-Mar-11 16-Mar-1130-Mar-11 23-Mar-116-Apr-1113-Apr-1120-Apr-11MOIL vs Broader MarketExhibit 61 -MOIL vs BSE 200Exhibit 62 -MOIL vs Public Sector10510095MOIL BSE 200105Markedunderperfor100Marked10595underperfor10090MOILBSE PSUCNX PSE95909085858015-Dec-1022-Dec-1029-Dec-105-Jan-1112-Jan-1119-Jan-1126-Jan-112-Feb-119-Feb-1116-Feb-1123-Feb-112-Mar-119-Mar-1116-Mar-1123-Mar-1130-Mar-116-Apr-1113-Apr-1120-Apr-11858015-Dec-10800ec-1Ḏ1522-Dec-100ec-1Ḏ229-Dec-100ec-1Ḏ295-Jan-111-1an5-J12-Jan-111-1an12-J1-1an19-J19-Jan-111-1an26-J26-Jan-111-1eb2-F2-Feb-111-1eb9-F9-Feb-111-1eb16-F1-1eb23-F16-Feb-111ar-12-M23-Feb-111ar-19-M2-Mar-111ar-116-M9-Mar-111ar-123-M16-Mar-111ar-130-M1r-1p6-A23-Mar-111r-1p13-A30-Mar-116-Apr-1113-Apr-1120-Apr-11Exhibit 63-MOIL vs MidcapsExhibit 64-MOIL vs BSE METAL10510510010095MOIL Nifty Junior CNX MidcapMOIL CNX Nifty Junior CNX MidcapMarked underperformance not to110105MOILBSE METAL959010085909580858015-Dec-1022-Dec-1029-Dec-105-Jan-1112-Jan-1119-Jan-1126-Jan-112-Feb-119-Feb-1116-Feb-1123-Feb-112-Mar-119-Mar-1116-Mar-1123-Mar-11908515-Dec-1022-Dec-1029-Dec-105-Jan-1112-Jan-1119-Jan-1126-Jan-112-Feb-119-Feb-1116-Feb-1123-Feb-112-Mar-119-Mar-1116-Mar-1123-Mar-1130-Mar-116-Apr-1113-Apr-1120-Apr-118015-Dec-1022-Dec-1029-Dec-105-Jan-1112-Jan-1119-Jan-1126-Jan-112-Feb-119-Feb-1116-Feb-1123-Feb-112-Mar-119-Mar-1116-Mar-1123-Mar-1130-Mar-116-Apr-1113-Apr-1120-Apr-11_____________________________________________________________________________________Source: NSE, BSE, A C <strong>Choksi</strong> Institutional ResearchA C <strong>Choksi</strong> Institutional Researchresearch@acchoksi.com 41
A C <strong>Choksi</strong><strong>Share</strong> <strong>Brokers</strong> <strong>Private</strong> <strong>Limited</strong>A C <strong>Choksi</strong> Institutional Research |Initiation Report|MINING MOILApril 26, 2011sExhibit 65 -MOIL vs Sandur Manganese110MOIL Sandur Manganese & Iron Ores Ltd105110 10010595100908595809075857080757015-Dec-1022-Dec-1029-Dec-105-Jan-1112-Jan-1119-Jan-1126-Jan-112-Feb-119-Feb-1116-Feb-1123-Feb-112-Mar-119-Mar-1116-Mar-1123-Mar-11Exhibit 65 -MOIL vs Mining Peers15-Dec-1022-Dec-1029-Dec-105-Jan-1112-Jan-1119-Jan-1126-Jan-112-Feb-119-Feb-1116-Feb-1123-Feb-112-Mar-119-Mar-1116-Mar-1123-Mar-1130-Mar-116-Apr-1113-Apr-1120-Apr-11Exhibit 66 -MOIL vs Mining PeersMark 125120 125120 115110 115105 110100 105MOIL Sesa Goa Ltd GMDC Ltd NMDC Ltd Coal India Ltd100 9590 9585 9080 8575 807515-Dec-10 15-Dec-1022-Dec-10 22-Dec-1029-Dec-1029-Dec-105-Jan-115-Jan-1112-Jan-1119-Jan-11 12-Jan-1126-Jan-11 19-Jan-112-Feb-1126-Jan-119-Feb-112-Feb-1116-Feb-1123-Feb-119-Feb-112-Mar-11 16-Feb-119-Mar-1123-Feb-1116-Mar-112-Mar-1123-Mar-119-Mar-1130-Mar-116-Apr-11 16-Mar-1113-Apr-1123-Mar-1120-Apr-11_____________________________________________________________________________________Source: NSE, BSE, A C <strong>Choksi</strong> Institutional ResearchA C <strong>Choksi</strong> Institutional Researchresearch@acchoksi.com 42
A C <strong>Choksi</strong><strong>Share</strong> <strong>Brokers</strong> <strong>Private</strong> <strong>Limited</strong>A C <strong>Choksi</strong> Institutional Research |Initiation Report|MINING MOILApril 26, 2011sExhibit 67 - Comparative Returns TablePerformance comparisonPrice Performance1 M 3 M Since ListingMOIL 376 432 467IndicesBSE Sensex 17839 19008 19648BSE Metals 15275 16734 16404NSE Nifty 5365 5697 5892BSE PSU 8473 8792 9346BSE 200 2205 2356 2443CNX Nifty Junior 10578 11404 11960CNX Midcap 7583 8216 8631CNX PSE 3348 3559 3859Mining StocksSandur Manganese & Iron Ores Ltd 561 690 742Sesa Goa Ltd 259 336 299GMDC Ltd 132 132 131NMDC Ltd 280 270 254Coal India Ltd 346 314 327Return %MOIL 2.7% -10.5% -17.1%BSE Sensex 9.9% 3.1% -0.2%BSE Metal Index 9.1% -0.5% 1.6%NSE Nifty 9.7% 3.3% -0.1%BSE PSU 7.8% 3.9% -2.2%BSE 200 9.5% 2.5% -1.1%CNX Nifty Junior 9.0% 1.1% -3.6%CNX Midcap 9.6% 1.2% -3.7%CNX PSE 7.4% 1.1% -6.8%Sandur Manganese & Iron Ores Ltd 13.9% -7.4% -14.0%Sesa Goa Ltd 24.4% -4.2% 7.7%GMDC Ltd 7.3% 7.8% 8.7%NMDC Ltd 0.0% 3.6% 10.2%Coal India Ltd 4.7% 15.4% 10.9%MOIL hasunderperformedthe market and itspeers since listing.We believe MOILto catch up withthe market and itsmining peers overlonger term.Source: NSE, BSE, A C <strong>Choksi</strong> Institutional Research_____________________________________________________________________________________A C <strong>Choksi</strong> Institutional Researchresearch@acchoksi.com 43
A C <strong>Choksi</strong><strong>Share</strong> <strong>Brokers</strong> <strong>Private</strong> <strong>Limited</strong>A C <strong>Choksi</strong> Institutional Research |Initiation Report|MINING MOILApril 26, 2011sValuing MOILExhibit 68.Valuation MethodologyValuationEBITDA (FY12 E)EV/EBITDA Multiple (x)Enterprise ValueAdd Cash & Cash equivalentsEquity ValueIssued <strong>Share</strong>s (In Mn)Target priceCMPUpside Potential9,2385.5050,81024,38075,19016844838715.8%Exhibit 69.Valuation RatiosSource: A C <strong>Choksi</strong> Institutional ResearchParticulars FY 10 FY 11 E FY 12 EValuation Ratios (X)EV/EBITDA 8.32 5.13 4.39EV/Sales 5.17 3.52 2.97EV/Tonne (`) 42,611 39,426 34,380P/E 13.95 9.71 9.11P/B 3.87 2.97 2.37Mcap/Sales 6.70 5.07 4.75Mcap/Total Assets 3.31 2.54 2.07We have employed the EV/EBITDA method for valuingMOIL. MOIL is currently trading at 5.1 times(x) and 4.4times(x) EV upon FY 11 E & FY 12 E forward EBITDArespectively. We assign a forward multiple of 5.5 times (x)EV/EBITDA to its FY 12 E EBITDA. It also comes with adividend yield of 1.4% FY 10 and is expected to have a yield of2.17% FY 12 E on a conservative basis._____________________________________________________________________________________Source: RHP, A C <strong>Choksi</strong> Institutional ResearchA C <strong>Choksi</strong> Institutional Researchresearch@acchoksi.com 44
A C <strong>Choksi</strong><strong>Share</strong> <strong>Brokers</strong> <strong>Private</strong> <strong>Limited</strong>A C <strong>Choksi</strong> Institutional Research |Initiation Report|MINING MOILApril 26, 2011Sensitivity AnalysisExhibit 70 -Sensitivity Analysis: EV/EBITDA & Mn Ore RealisationsEV/EBITDA Multiple(x)4.00 4.50 5.00 5.50 6.00 7.009,600 328 352 375 399 422 469FY 12 E 10,200 347 372 398 423 449 500Mn Ore 10,800 365 393 420 448 475 530Realisations 11,400 383 413 442 472 502 561( `/Tonne) 12,000 402 433 465 496 528 59112,600 420 454 487 521 554 621Exhibit 71 -Sensitivity Analysis: EV/EBITDA & Mn Ore SalesEV/EBITDA Multiple(x)4.00 4.50 5.00 5.50 6.00 7.001,140,000 354 380 407 433 459 5121,150,000 357 383 410 437 463 516FY 12 E 1,160,000 360 386 413 440 467 5211,170,000 362 389 417 444 471 525Mn Ore 1,180,000 365 393 420 448 475 530Sales 1,190,000 368 396 423 451 479 535(Tonne) 1,200,000 371 399 427 455 483 5391,210,000 373 402 430 459 487 544Source: A C <strong>Choksi</strong> Institutional Research_____________________________________________________________________________________A C <strong>Choksi</strong> Institutional Researchresearch@acchoksi.com 45
A C <strong>Choksi</strong><strong>Share</strong> <strong>Brokers</strong> <strong>Private</strong> <strong>Limited</strong>A C <strong>Choksi</strong> Institutional Research |Initiation Report|MINING MOILApril 26, 2011Exhibit 72 -Key AssumptionsKey AssumptionsFY 2011 E FY 2012 ESales (in Tonnes)Manganese ore 1,143,000 1,180,000High carbon Ferro Manganese (HCFM) 10,251 10,583EMD 1,108 1,144Ferro manganese slag 11,588 11,964Sales Realization (Net) (in per Tonne)Manganese ore 10,450 10,800High carbon Ferro Manganese (HCFM) 55,561 59,450EMD 61,740 62,357Ferro manganese slag 9,534 9,534`Source: A C <strong>Choksi</strong> Institutional Research_____________________________________________________________________________________A C <strong>Choksi</strong> Institutional Researchresearch@acchoksi.com 46
A C <strong>Choksi</strong><strong>Share</strong> <strong>Brokers</strong> <strong>Private</strong> <strong>Limited</strong>A C <strong>Choksi</strong> Institutional Research |Initiation Report|MININGMOILApril 26, 2011Exhibit 73.Reserves & Surplus in ` mnZooming Net worth30,00025,000Reserves and surplusLinear (Reserves and surplus)20,00015,00010,0005,000030,00025,00020,000FY 2006 FY 2007 FY 2008 FY 2009 FY 2010 FY 2011EExhibit 74.Net Worth in ` mnFY 2012EMOIL’s net worth has increasedfrom `3541 mn to `16,767 mnfrom FY 06 to FY 10.It grew at a CAGR of 48%.It is owing to a significant 45%4 year - CAGR growth in itsreserves to `15,087 mnfrom `3,388 mn duringthe same period.15,00010,0005,0000FY 2006 FY 2007 FY 2008 FY 2009 FY 2010 FY 2011EFY 2012ESource: MOIL Ltd, RHP, A C <strong>Choksi</strong> Institutional Research_____________________________________________________________________________________A C <strong>Choksi</strong> Institutional Researchresearch@acchoksi.com 47
A C <strong>Choksi</strong><strong>Share</strong> <strong>Brokers</strong> <strong>Private</strong> <strong>Limited</strong>A C <strong>Choksi</strong> Institutional Research |Initiation Report|MINING MOILApril 26, 2011OPEXExhibit 75 -Breakup of operating expenses3,500.003,000.002,500.002,000.00Ore raising and operatingexpenses1,500.001,000.00500.00Manufacturing andelectricity generatingexpensesAdministrative and sellingexpenses0.00FY 2006 FY 2007 FY 2008 FY 2009 FY 2010 FY 2011 E FY 2012 EOthersExhibit 76 -Per Tonne operating expenses_____________________________________________________________________________________Source: MOIL, RHP, A C <strong>Choksi</strong> Institutional ResearchA C <strong>Choksi</strong> Institutional Researchresearch@acchoksi.com 48
A C <strong>Choksi</strong><strong>Share</strong> <strong>Brokers</strong> <strong>Private</strong> <strong>Limited</strong>A C <strong>Choksi</strong> Institutional Research |Initiation Report|MINING MOILApril 26, 2011sOPEX CAGRExhibit 77 -CAGR of operating expensesMOILParticularsCAGR E^Ore Raising and Operating Expenses 14.64%Employee costs 19.10%Transport, rail and other 8.55%Consumption of stores and spares 4.50%Power and fuel 9.60%Repairs and maintenance 11.08%Other 1.39%Manufacturing and electricity generating expenses 15.03%Employee costs 20.21%Consumption of raw materials 20.60%Power and fuel 8.84%Other 12.42%Administrative and selling expenses 16.12%Total administrative expenses 13.03%Total selling expenses 17.73%^ 4 Year CAGR from FY 08 to FY 12 ESource: RHP, A C <strong>Choksi</strong> Institutional Research_____________________________________________________________________________________A C <strong>Choksi</strong> Institutional Researchresearch@acchoksi.com 49
A C <strong>Choksi</strong><strong>Share</strong> <strong>Brokers</strong> <strong>Private</strong> <strong>Limited</strong>A C <strong>Choksi</strong> Institutional Research |Initiation Report|MINING MOILApril 26, 2011sCAPEXExhibit 78 -CAGR of operating expenses in `mnProjects CAPEX Commencement Date # Completion Date $ Potential BenefitDeepening of Production Shaft 65.1 Jun-07 Dec-10 To increase ROMDeepening of Holm's Shaft 190.0 Mar-11 Mar-15 productionCompany has issued work orderfrom 340,000 THigh speed shaft for mining at 3000.0 to Central Mines Planning & Design, 2016 to 475,000 Tdeeper levels a subsidiary of Coal India <strong>Limited</strong>, at Balaghat Minefor preparation of techno-economicfeasibility reportCompany is appointingTo increase ROMSinking of vertical shaft 160.1 Central Mines Planning & Design, Apr-11 productiona subsidiary of Coal India <strong>Limited</strong>,from 60,000 Tfor taking up theto 100,000 Tfeasibility studyat Gumgaon MineTo increase ROMSinking of vertical shaft 252.0 May-10 Apr-14 productionfrom 30,000 Tto 60,000 Tat Munsar MineTo increase ROMSinking of vertical shaft 181.1 Price bid yet to be Apr-14 productionopenedfrom 55,000 Tto 100,000 Tat Ukwa MineTo increase ROMDevelopment of Dongri 1800.0 Mar-11 Mar-14 productionBuzurg opencast minefrom 350,000 Tto 560,000 T^ 4 Year CAGR from FY 08 to FY 12 ESource: RHP, A C <strong>Choksi</strong>TheInstitutionalCompany hasResearchentered into twoTo build upTownship at mines 2030.0 letters of intent in 2014-15 infrastructureOct-10 accepting tendersat minesfor construction of residential buildingsSource: RHP, A C <strong>Choksi</strong> Institutional Research_____________________________________________________________________________________A C <strong>Choksi</strong> Institutional Researchresearch@acchoksi.com 50
A C <strong>Choksi</strong><strong>Share</strong> <strong>Brokers</strong> <strong>Private</strong> <strong>Limited</strong>A C <strong>Choksi</strong> Institutional Research |Initiation Report|MINING MOILApril 26, 2011Segmental AnalysisContribution of Manganese ore is ~ 93%in Tonnes1,600,000Exhibit 79 -Volumes & Realisations: Manganese Orein `14,0001,400,0001,200,0001,000,000800,000600,000400,000200,0000FY 2006 FY 2007 FY 2008 FY 2009 FY 2010 FY 2011 E FY 2012 EProduction (MT) Sales Volume (MT) Realization ( `/Tonne)`12,00010,0008,0006,0004,0002,0000Source: RHP, A C <strong>Choksi</strong> Institutional ResearchAlmost 93% of net sales come from sale of manganese ore.Mn ore average realisations have improved from `3988 in2005-06 to `11600 in 2008-09. However it fell to `7744 in FY10 due to the effect of lower Mn Ore prices. The realisationshave grown at a CAGR of 18% and sales at 32% from FY 06.We expect the average Mn ore sales realisations to be at`10450 (growth of 35%YoY) and `10800 (growth of 3%YoY) for FY 11 E & FY 12 E respectively.The physical production of Mn Ore has grown at a 10 yrCAGR of 6.0% till FY 10. We expect it to grow at 4.8% forthe next two years.Sales volume has grown at 11.5% from FY06 till FY10. Weexpect the sales volume to grow at 3.2% for FY 12 E.Sales Value has grown at a CAGR of 31.7% over the past 4years. We expect it to grow at 31.2% for FY 11 E & 6.7% forFY 12 E.Exhibit 80 -Manganese Ore accounts for 93% of net salesSource: RHP, A C <strong>Choksi</strong> Institutional Research_____________________________________________________________________________________A C <strong>Choksi</strong> Institutional Researchresearch@acchoksi.com 51100%90%80%70%60%50%40%30%20%10%0%FY 2006 FY 2007 FY 2008 FY 2009 FY 2010 FY 2011 E FY 2012 EPower to MPEDCLFerro manganeseManganese oreFerro manganese slagElectrolytic manganese di -oxide
A C <strong>Choksi</strong><strong>Share</strong> <strong>Brokers</strong> <strong>Private</strong> <strong>Limited</strong>A C <strong>Choksi</strong> Institutional Research |Initiation Report|MINING MOILApril 26, 2011in Tonnes Exhibit 81 -HCFMin `12,00090,00080,00010,50070,0009,00060,0007,50050,0006,00040,0004,50030,0003,00020,0001,50010,00000FY 2006 FY 2007 FY 2008 FY 2009 FY 2010 FY 2011 E FY 2012 Ein Tonnes`Exhibit 82 -EMDin `Production (MT) Sales Volume (MT) Net Realization ( `/Tonne)1,80070,0001,60060,0001,40050,0001,2001,00040,00080030,00060020,00040020010,00000FY 2006 FY 2007 FY 2008 FY 2009 FY 2010 FY 2011 E FY 2012 EProduction (MT) Sales Volume (MT) Net Realization ( /Tonne)in Tonnes Exhibit 83 -Ferro manganese slagin `18,00012,00016,00010,00014,00012,0008,00010,0006,0008,000`Analysing Other SegmentsHigh Carbon Ferro Manganese (HCFM)production grew at a CAGR of 11.6%from 6,170 MT (FY 06) to 9,555 units(FY 10). Sales volume reached its high of11,928 MT in FY07 thereafter decreasedto 7,479 MT in FY10.Gross & netrealizations registered a CAGR of 15.9%& 15.7% respectively during the last 5years. It contributes around 3.95% of thetotal sales. We assume the net realisationsto be `59,450 for FY12 E. For HY FY11sales realizations were `61,431.Electrolytic Manganese Dioxide (EMD)contributes around 0.55% of the totalsales. Its production grew at a negativeCAGR of 3.0% from 1,301 MT (FY 06)to 1,150 MT (FY 10). Sales volumereached its high of 1,592 MT in FY08thereafter declined to 856 MT in FY10(CAGR -6.7%). Gross & net realizationsregistered a CAGR of 3.9% & 5.8%respectively during the last 5 years.We assume the net realisations to be`62,357 for FY12 E. For HY FY11 salesrealizations were `61,820.Ferro Manganese Slag sales volume degrewat a CAGR of 8.3% from 15,445MT (FY 06) to 10,911 MT (FY 10). Salesvalue registered a CAGR of 39%. Gross& net realizations registered a CAGR of51.7% & 54.4% respectively during thelast 5 years. It contributes around 0.65%of the total sales. We assume the netrealisations to be `9,534 for FY12 E. ForHY FY11 sales realizations were `11,384.6,0004,0002,0004,0002,00000FY 2006 FY 2007 FY 2008 FY 2009 FY 2010 FY 2011 E FY 2012 ESales Volume (MT) Net Realization (_____________________________________________________________________________________`/Tonne)Source: RHP, A C <strong>Choksi</strong> Institutional ResearchA C <strong>Choksi</strong> Institutional Researchresearch@acchoksi.com 52
A C <strong>Choksi</strong><strong>Share</strong> <strong>Brokers</strong> <strong>Private</strong> <strong>Limited</strong>A C <strong>Choksi</strong> Institutional Research |Initiation Report|MINING MOILApril 26, 2011Exhibit 84 - Ferro Manganese & EMDProduction over a decade______Ferro-Manganese (Tonnes)______EMD (Tonnes)13,5001,60012,0001,40010,5001,2009,0007,5006,0004,5001,0008006003,0004001,5002000FY2002FY2003FY2004FY2005FY2006FY2007FY2008FY2009FY2010FY2011 EFY2012 E0Exhibit 85 - Movement of Mn Orephysical production & OMSSource: A C <strong>Choksi</strong> Institutional ResearchSource: MOIL, A C <strong>Choksi</strong> Institutional Research_____________________________________________________________________________________A C <strong>Choksi</strong> Institutional Researchresearch@acchoksi.com 53
A C <strong>Choksi</strong><strong>Share</strong> <strong>Brokers</strong> <strong>Private</strong> <strong>Limited</strong>A C <strong>Choksi</strong> Institutional Research |Initiation Report|MINING MOILApril 26, 2011CAGRExhibit 86 -CAGR of key revenue items36%36%36%PATTaxationCAGR E^17%23%34%PBTOther income17%16%27%28%DepreciationEBITD<strong>AC</strong>AGR *17%21%20%22%31%33%39%42%45%43%Total operating expensesTotal Other Expenses58%Administrative andselling expensesManufacturing andelectricity generationexpensesOre expenses (incl rawmaterial costs)Net sales-10.00% 0.00% 10.00% 20.00% 30.00% 40.00% 50.00% 60.00% 70.00%* 4 Year CAGR from FY 06 to FY 10 ^ 6 Year CAGR from FY 06 to FY 12 ESource: A C <strong>Choksi</strong> Institutional Research7.00%6.00%Exhibit 87 - 10 year CAGR ofphysical production5.00%4.00%3.00%ManganeseOre 5.91%Output perMan Shift6.44%2.00%EMD 3.82%Ferro-1.00%Manganese1.90%0.00%Source: MOIL, A C <strong>Choksi</strong> Institutional Research_____________________________________________________________________________________A C <strong>Choksi</strong> Institutional Researchresearch@acchoksi.com 54
A C <strong>Choksi</strong><strong>Share</strong> <strong>Brokers</strong> <strong>Private</strong> <strong>Limited</strong>A C <strong>Choksi</strong> Institutional Research |Initiation Report|MINING MOILApril 26, 2011sExhibit 20 88 -Income StatementMOILParticulars (` in Mn except EPS )FY 2006 FY 2007 FY 2008 FY 2009 FY 2010 FY 2011 E FY 2012 EPeriod Ended 31-Mar-06 31-Mar-07 31-Mar-08 31-Mar-09 31-Mar-10 31-Mar-11 31-Mar-12IncomeNet sales 3,313 4,173 9,775 12,933 9,694 12,815 13,680Other Operating Income 0 0 0 0 0 0 0Total Operating Income 3,313 4,173 9,775 12,933 9,694 12,815 13,680% Change 26% 134% 32% -25% 32% 7%Ore expenses (incl raw material costs) 1,260 1,770 1,870 2,537 2,638 2,699 3,019% change 40% 6% 36% 4% 2% 12%Manufacturing and electricity generation expenses 196 259 289 443 372 475 505% change 32% 11% 54% -16% 28% 6%Administrative and selling expenses 197 224 476 722 615 815 865% change 14% 112% 52% -15% 33% 6%Other Expenses 61 85 97 34 47 46 53% change 38% 15% -65% 39% -3% 15%Total operating expenses 1,714 2,338 2,732 3,736 3,673 4,035 4,442% change 36% 17% 37% -2% 10% 10%EBITDA 1,600 1,835 7,043 9,197 6,021 8,780 9,238% change 15% 284% 31% -35% 46% 5%Depreciation 115 141 161 247 253 301 395EBIT 1,485 1,695 6,883 8,951 5,768 8,479 8,844% change 14% 306% 30% -36% 47% 4%Less : Interest and finance charges 0 0 0 0 0 0 0Other income 206 284 466 1,117 1,300 1,504 1,798% change 38% 64% 139% 16% 16% 20%PBT 1,691 1,979 7,349 10,068 7,068 9,983 10,641Taxation 545 669 2,551 3,430 2,404 3,294 3,512Other Items/Adjustments 16 -4 183 -265 7 0 0PAT 1,131 1,313 4,616 6,903 4,656 6,688 7,130% change 16% 251% 50% -33% 44% 7%Basic EPS (`)6.7 7.8 27.5 41.1 27.7 39.8 42.4Fully Diluted EPS (`)6.7 7.8 27.5 41.1 27.7 39.8 42.4_____________________________________________________________________________________Source: RHP, A C <strong>Choksi</strong> Institutional ResearchA C <strong>Choksi</strong> Institutional Researchresearch@acchoksi.com 55
A C <strong>Choksi</strong><strong>Share</strong> <strong>Brokers</strong> <strong>Private</strong> <strong>Limited</strong>A C <strong>Choksi</strong> Institutional Research |Initiation Report|MINING MOILApril 26, 2011sExhibit 89 -Balance SheetMOILParticulars (` in Mn ) FY 2006 FY 2007 FY 2008 FY 2009 FY 2010 FY 2011 E FY 2012 EPeriod Ended 31-Mar-06 31-Mar-07 31-Mar-08 31-Mar-09 31-Mar-10 31-Mar-11 31-Mar-12Sources of Funds<strong>Share</strong> capital 153 280 280 280 1,680 1,680 1,680Reserves and surplus 3,388 4,253 7,583 12,929 15,087 20,221 25,702Net Worth 3,541 4,533 7,863 13,209 16,767 21,901 27,382Minority Interest 0 0 0 0 0 0 0Loans 0 0 0 0 0 0 0Deferred tax liabilities 19 95 168 185 128 128 128Total Liabilities 3,560 4,629 8,030 13,394 16,895 22,029 27,510Application of FundsGross Block 1,472 1,833 3,025 3,420 3,570 4,169 5,460Less:Depreciation 860 988 1,136 1,364 1,605 1,906 2,301Net block 612 845 1,889 2,056 1,965 2,262 3,159Goodwill 0 0 0 0 0 0 0Capital work in progress 126 411 86 155 222 463 607Investment 0 0 0 1 2 2 2Current assets 3,488 4,313 8,379 14,451 17,421 22,796 27,650Sundry debtors 456 500 1,589 611 857 1,123 1,422Cash and bank balances 2,181 3,215 6,086 12,322 14,871 19,885 24,380Other current assets 851 598 705 1,519 1,693 1,788 1,848Current liabilities and provisions 666 941 2,324 3,269 2,715 3,495 3,908Net Current assets 2,822 3,372 6,056 11,182 14,706 19,301 23,742Total Assets 3,560 4,629 8,030 13,394 16,895 22,029 27,510Source: RHP, A C <strong>Choksi</strong> Institutional Research_____________________________________________________________________________________A C <strong>Choksi</strong> Institutional Researchresearch@acchoksi.com 56
A C <strong>Choksi</strong><strong>Share</strong> <strong>Brokers</strong> <strong>Private</strong> <strong>Limited</strong>A C <strong>Choksi</strong> Institutional Research |Initiation Report|MINING MOILApril 26, 2011sExhibit 90 -Cash Flow StatementMOILParticulars (` in Mn )FY 2006 FY 2007 FY 2008 FY 2009 FY 2010 FY 2011 E FY 2012 EPeriod Ended 31-Mar-06 31-Mar-07 31-Mar-08 31-Mar-09 31-Mar-10 31-Mar-11 31-Mar-12PBT 1,691 1,979 7,349 10,068 7,068 9,983 10,641Depreciation 115 141 161 247 253 301 395Discarded assets written off 0 2 1 2 1 0 0Change in Working Capital -269 560 259 1,127 -1,031 419 55Other Income & Adj -159 -243 -884 -614 -1,276 -1,504 -1,798Direct taxes paid -587 -672 -2,452 -3,593 -2,378 -3,294 -3,512Net cash flow from operating activities 792 1,766 4,435 7,236 2,637 5,904 5,781(Purchase)/Sales of Fixed Asset -182 -376 -1,206 -416 -163 -598 -1,292Changes in capital work in progress -113 -286 326 -69 -67 -241 -144Purchase/sale of investments 0 0 0 -1 -1 0 0Interest Income 185 250 446 1,042 1,242 1,504 1,798Net cash flow from investing activities -110 -412 -434 556 1,011 664 363Payment of dividends -199 -280 -966 -1,330 -941 -1,344 -1,428Tax on dividends -28 -41 -164 -226 -158 -211 -221Net cash flow from financing activities -227 -321 -1,130 -1,556 -1,098 -1,555 -1,649Net increase in Cash and cash equivalents 455 1,034 2,871 6,236 2,549 5,014 4,495Opening Cash and cash equivalents 1,727 2,181 3,215 6,086 12,322 14,871 19,885Closing Cash and cash equivalents 2,181 3,215 6,086 12,322 14,871 19,885 24,380Source: RHP, A C <strong>Choksi</strong> Institutional Research_____________________________________________________________________________________A C <strong>Choksi</strong> Institutional Researchresearch@acchoksi.com 57
A C <strong>Choksi</strong><strong>Share</strong> <strong>Brokers</strong> <strong>Private</strong> <strong>Limited</strong>A C <strong>Choksi</strong> Institutional Research |Initiation Report|MINING MOILApril 26, 2011Exhibit 91 -Common Size Income StatementMOILParticulars FY 2006 FY 2007 FY 2008 FY 2009 FY 2010 FY 2011 E FY 2012 EPeriod Ended 31-Mar-06 31-Mar-07 31-Mar-08 31-Mar-09 31-Mar-10 31-Mar-11 31-Mar-12Net sales 100.0 100.0 100.0 100.0 100.0 100.0 100.0Other Operating Income 0.0 0.0 0.0 0.0 0.0 0.0 0.0Total Operating Income 100.0 100.0 100.0 100.0 100.0 100.0 100.0Operating expenses & Raw material costs 38.0 42.4 19.1 19.6 27.2 21.1 22.1Manufacturing and electricity generation expenses 5.9 6.2 3.0 3.4 3.8 3.7 3.7Administrative and selling expenses 5.9 5.4 4.9 5.6 6.3 6.4 6.3Other Expenses 1.8 2.0 1.0 0.3 0.5 0.4 0.4Total operating expenses 51.7 56.0 27.9 28.9 37.9 31.5 32.5EBITDA 48.3 44.0 72.1 71.1 62.1 68.5 67.5Depreciation 3.5 3.4 1.6 1.9 2.6 2.4 2.9EBIT 44.8 40.6 70.4 69.2 59.5 66.2 64.6Less : Interest and finance charges 0.0 0.0 0.0 0.0 0.0 0.0 0.0Other income 6.2 6.8 4.8 8.6 13.4 11.7 13.1PBT 51.0 47.4 75.2 77.8 72.9 77.9 77.8Taxation 16.4 16.0 26.1 26.5 24.8 25.7 25.7Other Items/Adjustments 0.5 -0.1 1.9 -2.0 0.1 0.0 0.0PAT 34.1 31.5 47.2 53.4 48.0 52.2 52.1Source: RHP, A C <strong>Choksi</strong> Institutional Research_____________________________________________________________________________________A C <strong>Choksi</strong> Institutional Researchresearch@acchoksi.com 58
A C <strong>Choksi</strong><strong>Share</strong> <strong>Brokers</strong> <strong>Private</strong> <strong>Limited</strong>A C <strong>Choksi</strong> Institutional Research |Initiation Report|MINING MOILApril 26, 2011Exhibit 92 -Common Size Balance SheetMOILParticulars FY 2006 FY 2007 FY 2008 FY 2009 FY 2010 FY 2011 E FY 2012 EPeriod Ended 31-Mar-06 31-Mar-07 31-Mar-08 31-Mar-09 31-Mar-10 31-Mar-11 31-Mar-12Sources of Funds<strong>Share</strong> capital 4% 6% 3% 2% 10% 8% 6%Reserves and surplus 95% 92% 94% 97% 89% 92% 94%Net Worth 99% 98% 98% 99% 99% 99% 100%Minority Interest 0% 0% 0% 0% 0% 0% 0%Loans 0% 0% 0% 0% 0% 0% 0%Deferred tax liabilities 1% 2% 2% 1% 1% 1% 0%Total Liabilities 100% 100% 100% 100% 100% 100% 100%Application of FundsGross Block 41% 40% 38% 26% 21% 19% 19%Less:Depreciation 24% 21% 14% 10% 9% 9% 8%Net block 17% 18% 24% 15% 12% 10% 11%Goodwill 0% 0% 0% 0% 0% 0% 0%Capital work in progress 4% 9% 1% 1% 1% 2% 2%Investment 0% 0% 0% 0% 0% 0% 0%Current assets 98% 93% 104% 108% 103% 102% 99%Sundry debtors 13% 11% 20% 5% 5% 5% 5%Cash and bank balances 61% 69% 76% 92% 88% 89% 88%Other current assets 24% 13% 9% 11% 10% 8% 7%Current liabilities and provisions 19% 20% 29% 24% 16% 15% 13%Net Current assets 79% 73% 75% 83% 87% 88% 87%Total Assets 100% 100% 100% 100% 100% 100% 100%Source: RHP, A C <strong>Choksi</strong> Institutional Research_____________________________________________________________________________________A C <strong>Choksi</strong> Institutional Researchresearch@acchoksi.com 59
A C <strong>Choksi</strong><strong>Share</strong> <strong>Brokers</strong> <strong>Private</strong> <strong>Limited</strong>A C <strong>Choksi</strong> Institutional Research |Initiation Report|MINING MOILApril 26, 2011Exhibit 93 -Ratio AnalysisKEY RATIOSParticulars FY06 FY07 FY08 FY09 FY10 FY11 E FY12 EGrowth (%)Gross Sales 25.4% 133.9% 31.8% -25.1% 32.4% 6.8%Net Sales 26.0% 134.2% 32.3% -25.0% 32.2% 6.8%EBITDA 14.7% 283.7% 30.6% -34.5% 45.8% 1.9%EBIT 14.1% 306.1% 30.0% -35.6% 47.0% 4.3%PBT 17.0% 271.4% 37.0% -29.8% 41.2% 6.6%PAT 16.2% 251.5% 49.6% -32.5% 43.6% 6.6%Gearing Ratio (X)Debt to Equity 0 0 0 0 0 0 0Coverage Ratios (X)Interest Coverage - - - - - - -Yield (%)Dividend Yield 1.4% 2.1% 2.2%Margins (%)EBITDA 48.3% 44.0% 72.1% 71.1% 62.1% 68.5% 67.5%EBIT 44.8% 40.6% 70.4% 69.2% 59.5% 66.2% 64.6%PBT 51.0% 47.4% 75.2% 77.8% 72.9% 77.9% 77.8%PAT 34.1% 31.5% 47.2% 53.4% 48.0% 52.2% 52.1%Profitability (%)Operating Return on Asset (OROA) 37.9% 37.5% 88.5% 68.1% 33.2% 38.9% 31.4%Return on Asset (ROA) 26.8% 26.8% 58.0% 51.1% 25.7% 29.6% 25.0%Return on Equity(ROE) 31.9% 32.5% 74.5% 65.5% 31.1% 34.6% 28.9%Turnover (X)Total Asset turnover 0.8 0.9 1.2 1.0 0.5 0.6 0.5Fixed Asset turnover (Net Block) 5.4 5.7 7.2 6.6 4.8 6.1 5.0Fixed Asset turnover (Gross Block) 2.3 2.5 4.0 4.0 2.8 3.3 2.8Inventory Turnover 2.3 3.3 6.5 7.1 4.9 5.0 5.0Receivables Turnover 7.3 8.7 9.4 11.8 13.2 11.4 9.6Payables Turnover 2.5 2.1 1.7 1.8 1.5 1.7 1.8_____________________________________________________________________________________Source: MOIL, A C <strong>Choksi</strong> Institutional ResearchA C <strong>Choksi</strong> Institutional Researchresearch@acchoksi.com 60
A C <strong>Choksi</strong><strong>Share</strong> <strong>Brokers</strong> <strong>Private</strong> <strong>Limited</strong>A C <strong>Choksi</strong> Institutional Research |Initiation Report|MINING MOILApril 26, 2011Exhibit 94 -Du Pont Analysis & Valuation RatiosWCC,Per <strong>Share</strong> Data, Du-Pont Analysis & Valuation RatiosParticulars FY06 FY07 FY08 FY09 FY10 FY11 E FY12 EWorking Capital Cycle (Days)Inventory Days 157 112 56 51 75 73 73Debtor days 50 42 39 31 28 32 38Payable days 147 170 221 200 238 220 207Per <strong>Share</strong> ( `)Earnings 6.7 7.8 27.5 41.1 27.7 39.8 42.4DividendsBook Value 21.1 27.0 46.8 78.6 99.8 130.4 163.0Cash 13.0 19.1 36.2 73.3 88.5 118.4 145.1Du pont analysisPAT/Net worth(%) 31.9% 32.5% 74.5% 65.5% 31.1% 34.6% 28.9%Net profit Margin (%) 34.1% 31.5% 47.2% 53.4% 48.0% 52.2% 52.1%Asset turnover (X) 0.8 0.9 1.2 1.0 0.5 0.6 0.5TA/Networth 1.2 1.2 1.3 1.3 1.2 1.2 1.2Valuations (X)EV/EBITDA 8.3 5.1 4.4EV/Sales 5.2 3.5 3.0EV/Tonne 42,611 39,426 34,380P/E 13.9 9.7 9.1P/B 3.9 3.0 2.4Mcap/Sales 6.7 5.1 4.7Mcap/Total Assets 3.3 2.5 2.1Source: MOIL, A C <strong>Choksi</strong> Institutional Research_____________________________________________________________________________________A C <strong>Choksi</strong> Institutional Researchresearch@acchoksi.com 61
A C <strong>Choksi</strong><strong>Share</strong> <strong>Brokers</strong> <strong>Private</strong> <strong>Limited</strong>A C <strong>Choksi</strong> Institutional Research |Initiation Report|MINING MOILApril 26, 2011Technical Chart MOILTechnical View MOILIn order to form a technical view of anystock/commodity, it needs to have sufficienttrading history.MOIL doesn’t have enough trading history as itwas listed only on 15th December 2010.Mehul JhaveriTechnical Analyst+ 91 22 3021 9026 / 9029mehuljhaveri@acchoksi.comAs a result we cannot give any technical view onMOIL.However, we have presented a dailychart of MOIL for reference.technical_____________________________________________________________________________________A C <strong>Choksi</strong> Institutional Researchresearch@acchoksi.com 62
A C <strong>Choksi</strong><strong>Share</strong> <strong>Brokers</strong> <strong>Private</strong> <strong>Limited</strong>A C <strong>Choksi</strong> Institutional Research |Initiation Report|MINING MOILApril 26, 2011Notes:_____________________________________________________________________________________A C <strong>Choksi</strong> Institutional Researchresearch@acchoksi.com 63
A C <strong>Choksi</strong><strong>Share</strong> <strong>Brokers</strong> <strong>Private</strong> <strong>Limited</strong>A C <strong>Choksi</strong> Institutional Research |Initiation Report|MINING MOILApril 26, 2011Notes:_____________________________________________________________________________________A C <strong>Choksi</strong> Institutional Researchresearch@acchoksi.com 64
A C <strong>Choksi</strong><strong>Share</strong> <strong>Brokers</strong> <strong>Private</strong> <strong>Limited</strong>A C <strong>Choksi</strong> Institutional Research |Initiation Report|MINING MOILApril 26, 2011Recommendation History: MOIL LtdMOIL 3QFY11 Result UpdateEquity Research TeamJinesh Sarat Sheth+91 22 3021 9025Jinesh@acchoksi.comDisclaimerThe information and views presented in this report are prepared by A C <strong>Choksi</strong> <strong>Share</strong> <strong>Brokers</strong> <strong>Private</strong> <strong>Limited</strong>.The information contained herein is based on our analysis and up onsources that we consider reliable. We, however, do not vouch for the accuracy or the completeness thereof. This material is for personal information and we are not responsible for anyloss incurred based upon it. The investments discussed or recommended in this report may not be suitable for all investors. Investors must make their own investment decisions basedon their specific investment objectives and financial position and using such independent advice, as they believe necessary. While acting upon any information or analysis mentionedin this report, investors may please note that neither A C <strong>Choksi</strong> <strong>Share</strong> <strong>Brokers</strong> <strong>Private</strong> <strong>Limited</strong> nor any person connected with any associated companies of A C <strong>Choksi</strong> <strong>Share</strong><strong>Brokers</strong> <strong>Private</strong> <strong>Limited</strong> accepts any liability arising from the use of this information and views mentioned in this document.The analysts for this report certifiesthat all of the viewsexpressed in this report accurately reflect his or her personal views about the subject company or companies and its or their securities, and no part of his or her compensation was, is or will be,directly or indirectly related to specific recommendations or views expressed in this report.Disclosure of InterestAnalyst ownership of the stockNOBroking Relationship with the company coveredNOInvestment Banking relationship with the company coveredNODiscretionary Portfolio Management ServicesNO_____________________________________________________________________________________A C <strong>Choksi</strong> Institutional Researchresearch@acchoksi.com 65