Fit Family Task Force Project - Rockford Public Schools
Fit Family Task Force Project - Rockford Public Schools
Fit Family Task Force Project - Rockford Public Schools

You also want an ePaper? Increase the reach of your titles
YUMPU automatically turns print PDFs into web optimized ePapers that Google loves.
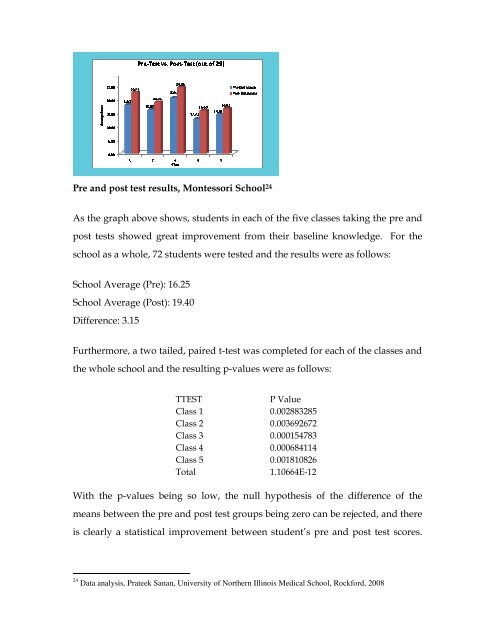
Pre and post test results, Montessori School 24<br />
As the graph above shows, students in each of the five classes taking the pre and<br />
post tests showed great improvement from their baseline knowledge. For the<br />
school as a whole, 72 students were tested and the results were as follows:<br />
School Average (Pre): 16.25<br />
School Average (Post): 19.40<br />
Difference: 3.15<br />
Furthermore, a two tailed, paired t-test was completed for each of the classes and<br />
the whole school and the resulting p-values were as follows:<br />
TTEST P Value<br />
Class 1 0.002883285<br />
Class 2 0.003692672<br />
Class 3 0.000154783<br />
Class 4 0.000684114<br />
Class 5 0.001810826<br />
Total 1.10664E-12<br />
With the p-values being so low, the null hypothesis of the difference of the<br />
means between the pre and post test groups being zero can be rejected, and there<br />
is clearly a statistical improvement between student’s pre and post test scores.<br />
24 Data analysis, Prateek Sanan, University of Northern Illinois Medical School, <strong>Rockford</strong>, 2008