Fit Family Task Force Project - Rockford Public Schools
Fit Family Task Force Project - Rockford Public Schools
Fit Family Task Force Project - Rockford Public Schools

Create successful ePaper yourself
Turn your PDF publications into a flip-book with our unique Google optimized e-Paper software.
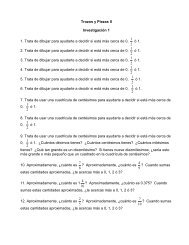
The results for each group were as follows:<br />
Nashold (Experimental): Pre – 6.54 Post – 13.00 Difference – 6.46<br />
Nashold (Control): Pre – 5.53 Post – 8.07 Difference – 2.53<br />
Differences between control group and intervention group pre and post test scores at Nashold School<br />
The figure above shows the change from pre to post test scores in both the<br />
experimental and the control group at Nashold. A two tailed, paired t-test (as<br />
previously described) was also performed for both groups. The results were as<br />
follows:<br />
Paired t-test comparing pre and post test scores:<br />
Nashold (Experimental) 0.0000156<br />
Nashold (Control) 0.0024928<br />
Clearly, the experimental group had a much higher post test score and positive<br />
difference between post and pre test scores than the control group. Thus, the p-<br />
value was much lower for the experimental group than the control group.<br />
Furthermore, 0/13 students from the experimental group recorded a lower score<br />
on the post test than their pre test, while 3/15 students from the control group<br />
recorded a lower score on their post test than their pre test.