Confidence Interval Criteria for Assessment of Dose ... - ENVT
Confidence Interval Criteria for Assessment of Dose ... - ENVT
Confidence Interval Criteria for Assessment of Dose ... - ENVT

Create successful ePaper yourself
Turn your PDF publications into a flip-book with our unique Google optimized e-Paper software.
<strong>Confidence</strong> <strong>Interval</strong> <strong>Criteria</strong> <strong>for</strong> <strong>Dose</strong> Proportionality 1281<br />
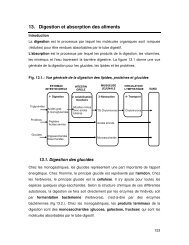
Fig. 1. Power model <strong>for</strong> example 1. The solid line denotes tile expected<br />
geometric mean value and the shading denotes the 90% prediction<br />
limits.<br />
where � 1 � K m/V max and � 2 � 1/(2V maxV). Linking the CI<br />
criterion to the model and solving <strong>for</strong> the model parameters<br />
gives:<br />
h − �� L<br />
� L − 1 � � 2<br />
� 1<br />
� h − �� H<br />
� H − 1<br />
(10)<br />
Calculation <strong>of</strong> a confidence interval <strong>for</strong> � 2/� 1 requires bootstrapping<br />
or use <strong>of</strong> Fieller’s theorem (11) since it is a ratio <strong>of</strong><br />
two normally distributed values.<br />
Decision Rules<br />
The acceptance interval (� L, � H) <strong>for</strong> R dnm and the statistical<br />
model <strong>for</strong> estimation are not alone sufficient to support<br />
clinically meaningful conclusions. If (L, U) lay completely<br />
outside the acceptance interval, then one would conclude<br />
lack <strong>of</strong> proportionality. A 90% CI lying entirely within<br />
the critical region would confirm a proportionate increase in<br />
exposure. If the dose ratio <strong>of</strong> interest falls between � 1 and � 2,<br />
then (L, U) would span the critical region and no clear-cut<br />
statistic would be obtained. Here, � 1 as the best estimate <strong>of</strong><br />
deviation from ideal proportionality, and (L, U) indicating<br />
the maximal possible deviations, could be interpreted in the<br />
context <strong>of</strong> drug safety and efficacy or pharmacological effect<br />
<strong>Dose</strong> range<br />
studied<br />
data. This is, understanding the association between systemic<br />
exposure and dose is more difficult that accepting a dichotomous<br />
outcome <strong>of</strong> a statistical test.<br />
RESULTS AND DISCUSSION<br />
Estimation <strong>of</strong> the expected PK value by means <strong>of</strong> a statistical<br />
power model, coupled with confidence interval criteria<br />
to define proportionate and disproportionate ranges is a pragmatic<br />
approach to obtaining clinically relevant in<strong>for</strong>mation on<br />
variation in drug exposure with dose. An essential model assumption<br />
is that doubling the dose will increase PK by a<br />
constant proportion. For instance, if increasing -the dose from<br />
100 to 200 causes a 90% increase in the PK parameter <strong>of</strong><br />
interest, then a dose increment from 200 to 400 will also increase<br />
PK by 90%. The first example illustrates analysis <strong>of</strong><br />
limited data typical <strong>of</strong> a dose-escalation study in early clinical<br />
development, and the second example represents a “definitive”<br />
dose proportionality study.<br />
Example 1 (Secretory Phospholipase Inhibitor LY333013)<br />
LY333013 is the methyl ester <strong>of</strong> [[3-(aminooxoacetyl)-2ethyl-1-(phenylmethyl)-1H-indol-4-yl]ocy]acetate,<br />
which is a<br />
potent inhibitor <strong>of</strong> human non-pancreatic secretary phospholipase<br />
A 2 (sPLA 2). When orally administered, LY333013 is<br />
rapidly hydrolyzed to the active acid, which is measured in<br />
plasma. LY333013 is being developed <strong>for</strong> use in patients with<br />
chronic inflammatory conditions associated with elevated serum<br />
levels <strong>of</strong> sPLA 2. Evaluation <strong>of</strong> exposure (AUC and<br />
C max) as a function <strong>of</strong> dose was an objective <strong>of</strong> the first clinical<br />
study, in which single doses <strong>of</strong> an oral suspension were<br />
administered to healthy subjects (Table I).<br />
The PK values were evaluated with the following mixed<br />
effects statistical model:<br />
ln(PK ij) � (� 0 + � i)+� 1 � ln(dose ij) +� ij<br />
All � i’s and � ij’s were assumed to be mutually independent.<br />
Estimates <strong>of</strong> � 0 and � 1 and their 90% CI’s were obtained with<br />
the MIXED procedure (ML method) <strong>of</strong> SAS. Results revealed<br />
a disproportionately low increase in C max over the<br />
dose range (Figure 1). The estimate <strong>of</strong> the “intercept” parameter<br />
� 0 [1.94 with a 90% CI <strong>of</strong> (1.54, 2.35)] and its betweensubject<br />
variability � 2 � 0.097 are not <strong>of</strong> interest here. The<br />
Table 2. <strong>Dose</strong> Proportionality <strong>Assessment</strong> <strong>of</strong> a Phase 1, <strong>Dose</strong>-escalation Study<br />
Predicted<br />
geometric<br />
mean PK<br />
parameter<br />
values<br />
Cmax (ng/mL)<br />
25 to 250 mg 80.9 to 467<br />
AUC0-� (ng � hr/mL)<br />
25 to 250 mg 415 to 3353<br />
R dnm 90%<br />
confidence interval a<br />
Conclusion <strong>for</strong><br />
dose range<br />
studied b<br />
Maximal proportional<br />
dose range c<br />
(� 1)<br />
Threshold dose<br />
ratio to reject<br />
proportionality d<br />
(� 2)<br />
0.577<br />
(0.477, 0.698)<br />
0.808<br />
not proportional 2.0 4.2<br />
(0.653, 1.001) inconclusive 3.3 no value e<br />
a Ratio <strong>of</strong> model-predicted mean values <strong>for</strong> high and low dose, normalized <strong>for</strong> dose.<br />
b Proportionality was concluded if the 90% confidence interval <strong>for</strong> Rdnm was contained completely within (0.8, 1.25).<br />
c Proportionality would be concluded <strong>for</strong> any dose ratio less than this value.<br />
d Lack <strong>of</strong> proportionality would be concluded <strong>for</strong> any dose ratio greater than this value.<br />
e See qualification in text.