Confidence Interval Criteria for Assessment of Dose ... - ENVT
Confidence Interval Criteria for Assessment of Dose ... - ENVT
Confidence Interval Criteria for Assessment of Dose ... - ENVT

You also want an ePaper? Increase the reach of your titles
YUMPU automatically turns print PDFs into web optimized ePapers that Google loves.
<strong>Confidence</strong> <strong>Interval</strong> <strong>Criteria</strong> <strong>for</strong> <strong>Dose</strong> Proportionality 1283<br />
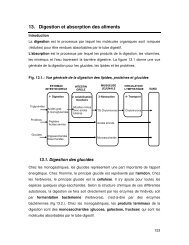
Fig. 4. The ratio <strong>of</strong> geometric mean values normalized <strong>for</strong> dose (—)<br />
and its 90% CI (– – –) as predicted by the power model <strong>for</strong> Example<br />
2. Region 1 corresponds to a definitive conclusion <strong>of</strong> proportionality.<br />
Region 2 is inconclusive on dose proportionality.<br />
ideal dose proportionality. This is not to condone extrapolation<br />
far beyond the dose levels studied, since any drug would<br />
be expected to display nonlinear pharmacokinetics at inordinately<br />
high or low doses. The 90% CI <strong>for</strong> � 1 contained 1.0;<br />
thus, a hypothesis that AUC 0-� was truly proportional to dose<br />
could not be rejected based on this study alone. This is represented<br />
by the entry <strong>of</strong> “no value” in Table III.<br />
Estimation <strong>of</strong> Deviations from Proportionality<br />
The examples indicate that conclusions are not constrained<br />
to a dichotomous outcome <strong>of</strong> “proportional” or “not<br />
proportional” over an arbitrary dose range, since a maximal<br />
dose ratio consistent with proportionality and a threshold ratio<br />
above which exposure is definitely not proportional are<br />
defined. The need to link any conclusion on dose proportionality<br />
with a specific dose range has been well stated by Gough,<br />
et al. (4) and Sheppard et al. (14). Conclusions from the<br />
power model relate to a dose ratio rather than to specific dose<br />
levels. If there is evidence that this modeling assumption is<br />
inappropriate, then the CI criteria can be used with another<br />
function.<br />
For a given subject sample size, a study design can be<br />
chosen in order to minimize the standard error <strong>for</strong> � 1 and<br />
thereby narrow its confidence interval (minimize region 2).<br />
The standard error is minimized (estimation is most efficient)<br />
when one-half <strong>of</strong> the observations are collected at the lowest<br />
dose at which precise PK measurements are possible and onehalf<br />
at the maximum tolerated dose. From a statistical point<br />
<strong>of</strong> view, the optimal design is thus a 2-period, 2-treatment<br />
crossover. A desire to collect data at other levels and to verify<br />
the applicability <strong>of</strong> the power model could be persuasive <strong>for</strong><br />
inclusion <strong>of</strong> additional treatments.<br />
Decision rules based on a confidence interval <strong>for</strong> the<br />
statistical model <strong>of</strong> choice can be detached from the power<br />
model, as was noted above <strong>for</strong> the saturable elimination<br />
model. Irrespective <strong>of</strong> the mathematical relationship between<br />
PK and dose, the 90% CI <strong>for</strong> the ratio <strong>of</strong> expected mean<br />
(arithmetic, least squares, geometric, predicted geometric,<br />
etc.) values <strong>of</strong> the PK metric can be compared to a prespecified<br />
acceptance interval (� L, � H). This approach is<br />
straight<strong>for</strong>ward and based on the logic used in bioequivalence<br />
testing. The method can be applied to common doseescalation<br />
and crossover designs and supports standardization<br />
<strong>of</strong> decision rules and comparisons across studies and drugs.<br />
ACKNOWLEDGMENTS<br />
The authors wish to thank Mosun Ayan-Oshodi, David<br />
Radtke, and Patty Grega <strong>for</strong> their assistance.<br />
REFERENCES<br />
1. J. D. Haynes and A. I. Weiss. Modeling pharmacokinetic doseproportionality<br />
data. Proceed. Biopharm. Section Amer. Stat. Assoc.<br />
85–89 (1989).<br />
2. L. Yuh, M. G. Eller, and S. J. Ruberg. A stepwise approach <strong>for</strong><br />
analyzing dose proportionality studies. Proceed. Biopharm. Section<br />
Amer. Stat. Assoc. 47–50 (1990).<br />
3. H. I. Patel. <strong>Dose</strong>-response in pharmacokinetics. Commun. Statist.-Theory<br />
Meth. 23:451–465 (1994).<br />
4. K. Gough, M. Hutchison, O. Keene, B. Byrom, S. Ellis, L. Lacey,<br />
and J. McKellar. <strong>Assessment</strong> <strong>of</strong> dose proportionality: Report<br />
from the statisticians in the pharmaceutical industry/pharmacokinetics<br />
UK joint working party. Drug Info. J. 29:1039–1048<br />
(1995).<br />
5. J. T. Lettieri, M. C. Rogge, L. Kaiser, R. M. Echols, and A. H.<br />
Heller. Pharmacokinetic pr<strong>of</strong>iles <strong>of</strong> cipr<strong>of</strong>loxacin after single intravenous<br />
and oral doses. Antimicrob. Agents Chemother. 36:993–<br />
996 (1992).<br />
6. W. Cawello, A. Leonhardt, H. Schweer, H. W. Seyberth, R.<br />
Bonn, and A. L. Lomeli. <strong>Dose</strong> proportional pharmacokinetics <strong>of</strong><br />
alprostadil (prostaglandin E1) in healthy volunteers following intravenous<br />
infusion. Br. J. Clin. Pharmacol. 40:273–276 (1995).<br />
7. D. R. Brocks, A. W. Meikle, S. C. Boike, N. A. Mazer, N. Zariffa,<br />
P. R. Audet, and D. K. Jorkasky. Pharmacokinetics <strong>of</strong> Testosterone<br />
in hypogonadal men after transdermal delivery: Influence <strong>of</strong><br />
dose. J. Clin. Pharmacol. 36:732–739 (1996).<br />
8. T. M. Ludden, D. A. Boyle, D. Gieseker, G. T. Kennedy, M. H.<br />
Craw<strong>for</strong>d, L. K. Ludden, and W. A. Clement. Absolute bioavailability<br />
and dose proportionality <strong>of</strong> betaxolol in normal healthy<br />
subjects. J. Pharm. Sci. 77:779–782 (1988).<br />
9. K. J. Klamerus, K. Maloney, R. L. Rudolph, S. F. Sisenwine,<br />
W. J. Jusko, and S. T. Chiang. Introduction <strong>of</strong> a composite parameter<br />
to the pharmacokinetics <strong>of</strong> Venalfaxine and its active<br />
O-desmethyl metabolite. J. Clin. Pharmacol. 32:716–724 (1992).<br />
10. M.-L. Chen and R. Patnaik. Statistical Procedures <strong>for</strong> Bioequivalence<br />
Studies Using a Standard Two-Treatment Crossover Design.<br />
Division <strong>of</strong> Bioequivalence, Office <strong>of</strong> Generic Drugs, Food<br />
and Drug Administration 1992.<br />
11. D. J. Finney. Statistical Method in Biological Assay, Third Edition,<br />
Charles Griffin & Company Ltd, London, 1978.<br />
12. J. G. Wagner. Properties <strong>of</strong> the Michaelis-Menton equation and<br />
its integrated <strong>for</strong>m which are useful in pharmacokinetics. J. Pharmacokin.<br />
Biopharm. 1:103–120 (1973).<br />
13. N. P. Chau. Area-dose relationships in nonlinear models. J. Pharmacokin.<br />
Biopharm. 4:537–551 (1976).<br />
14. T. A. Sheppard, N. Lordi, and P. E. Sparrow. Influence <strong>of</strong> dose<br />
range on degree <strong>of</strong> nonlinearity detected in dose-proportionality<br />
studies <strong>for</strong> drugs with saturable elimination: single-dose and<br />
steady-state studies. Pharm. Res. 10:289–293 (1993).