Confidence Interval Criteria for Assessment of Dose ... - ENVT
Confidence Interval Criteria for Assessment of Dose ... - ENVT
Confidence Interval Criteria for Assessment of Dose ... - ENVT

Create successful ePaper yourself
Turn your PDF publications into a flip-book with our unique Google optimized e-Paper software.
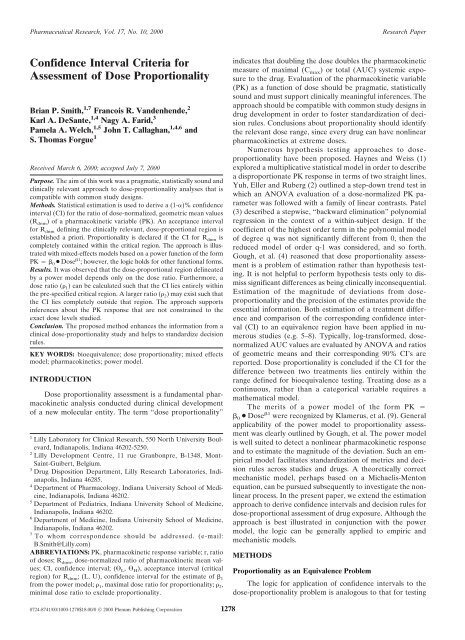
Pharmaceutical Research, Vol. 17, No. 10, 2000 Research Paper<br />
<strong>Confidence</strong> <strong>Interval</strong> <strong>Criteria</strong> <strong>for</strong><br />
<strong>Assessment</strong> <strong>of</strong> <strong>Dose</strong> Proportionality<br />
Brian P. Smith, 1,7 Francois R. Vandenhende, 2<br />
Karl A. DeSante, 1,4 Nagy A. Farid, 3<br />
Pamela A. Welch, 1,5 John T. Callaghan, 1,4,6 and<br />
S. Thomas Forgue 1<br />
Received March 6, 2000; accepted July 7, 2000<br />
Purpose. The aim <strong>of</strong> this work was a pragmatic, statistically sound and<br />
clinically relevant approach to dose-proportionality analyses that is<br />
compatible with common study designs.<br />
Methods. Statistical estimation is used to derive a (1-�)% confidence<br />
interval (CI) <strong>for</strong> the ratio <strong>of</strong> dose-normalized, geometric mean values<br />
(R dnm) <strong>of</strong> a pharmacokinetic variable (PK). An acceptance interval<br />
<strong>for</strong> R dnm defining the clinically relevant, dose-proportional region is<br />
established a priori. Proportionality is declared if the CI <strong>for</strong> R dnm is<br />
completely contained within the critical region. The approach is illustrated<br />
with mixed-effects models based on a power function <strong>of</strong> the <strong>for</strong>m<br />
PK � � 0 ● <strong>Dose</strong> �1 ; however, the logic holds <strong>for</strong> other functional <strong>for</strong>ms.<br />
Results. It was observed that the dose-proportional region delineated<br />
by a power model depends only on the dose ratio. Furthermore, a<br />
dose ratio (� 1) can be calculated such that the CI lies entirely within<br />
the pre-specified critical region. A larger ratio (� 2) may exist such that<br />
the CI lies completely outside that region. The approach supports<br />
inferences about the PK response that are not constrained to the<br />
exact dose levels studied.<br />
Conclusion. The proposed method enhances the in<strong>for</strong>mation from a<br />
clinical dose-proportionality study and helps to standardize decision<br />
rules.<br />
KEY WORDS: bioequivalence; dose proportionality; mixed effects<br />
model; pharmacokinetics; power model.<br />
INTRODUCTION<br />
<strong>Dose</strong> proportionality assessment is a fundamental pharmacokinetic<br />
analysis conducted during clinical development<br />
<strong>of</strong> a new molecular entity. The term “dose proportionality”<br />
1<br />
Lilly Laboratory <strong>for</strong> Clinical Research, 550 North University Boulevard,<br />
Indianapolis, Indiana 46202-5250.<br />
2<br />
Lilly Development Centre, 11 rue Granbonpre, B-1348, Mont-<br />
Saint-Guibert, Belgium.<br />
3<br />
Drug Disposition Department, Lilly Research Laboratories, Indianapolis,<br />
Indiana 46285.<br />
4<br />
Department <strong>of</strong> Pharmacology, Indiana University School <strong>of</strong> Medicine,<br />
Indianapolis, Indiana 46202.<br />
5<br />
Department <strong>of</strong> Pediatrics, Indiana University School <strong>of</strong> Medicine,<br />
Indianapolis, Indiana 46202.<br />
6<br />
Department <strong>of</strong> Medicine, Indiana University School <strong>of</strong> Medicine,<br />
Indianapolis, Indiana 46202.<br />
7<br />
To whom correspondence should be addressed. (e-mail:<br />
B.Smith@Lilly.com)<br />
ABBREVIATIONS: PK, pharmacokinetic response variable; r, ratio<br />
<strong>of</strong> doses; Rdnm, dose-normalized ratio <strong>of</strong> pharmacokinetic mean values;<br />
CI, confidence interval; (�L, �H), acceptance interval (critical<br />
region) <strong>for</strong> Rdnm; (L, U), confidence interval <strong>for</strong> the estimate <strong>of</strong> �1 from the power model; �1, maximal dose ratio <strong>for</strong> proportionality; �2, minimal dose ratio to exclude proportionality.<br />
0724-8741/00/1000-1278$18.00/0 © 2000 Plenum Publishing Corporation<br />
1278<br />
indicates that doubling the dose doubles the pharmacokinetic<br />
measure <strong>of</strong> maximal (C max) or total (AUC) systemic exposure<br />
to the drug. Evaluation <strong>of</strong> the pharmacokinetic variable<br />
(PK) as a function <strong>of</strong> dose should be pragmatic, statistically<br />
sound and must support clinically meaningful inferences. The<br />
approach should be compatible with common study designs in<br />
drug development in order to foster standardization <strong>of</strong> decision<br />
rules. Conclusions about proportionality should identify<br />
the relevant dose range, since every drug can have nonlinear<br />
pharmacokinetics at extreme doses.<br />
Numerous hypothesis testing approaches to doseproportionality<br />
have been proposed. Haynes and Weiss (1)<br />
explored a multiplicative statistical model in order to describe<br />
a disproportionate PK response in terms <strong>of</strong> two straight lines.<br />
Yuh, Eller and Ruberg (2) outlined a step-down trend test in<br />
which an ANOVA evaluation <strong>of</strong> a dose-normalized PK parameter<br />
was followed with a family <strong>of</strong> linear contrasts. Patel<br />
(3) described a stepwise, “backward elimination” polynomial<br />
regression in the context <strong>of</strong> a within-subject design. If the<br />
coefficient <strong>of</strong> the highest order term in the polynomial model<br />
<strong>of</strong> degree q was not significantly different from 0, then the<br />
reduced model <strong>of</strong> order q-1 was considered, and so <strong>for</strong>th.<br />
Gough, et al. (4) reasoned that dose proportionality assessment<br />
is a problem <strong>of</strong> estimation rather than hypothesis testing.<br />
It is not helpful to per<strong>for</strong>m hypothesis tests only to dismiss<br />
significant differences as being clinically inconsequential.<br />
Estimation <strong>of</strong> the magnitude <strong>of</strong> deviations from doseproportionality<br />
and the precision <strong>of</strong> the estimates provide the<br />
essential in<strong>for</strong>mation. Both estimation <strong>of</strong> a treatment difference<br />
and comparison <strong>of</strong> the corresponding confidence interval<br />
(CI) to an equivalence region have been applied in numerous<br />
studies (e.g. 5–8). Typically, log-trans<strong>for</strong>med, dosenormalized<br />
AUC values are evaluated by ANOVA and ratios<br />
<strong>of</strong> geometric means and their corresponding 90% CI’s are<br />
reported. <strong>Dose</strong> proportionality is concluded if the CI <strong>for</strong> the<br />
difference between two treatments lies entirely within the<br />
range defined <strong>for</strong> bioequivalence testing. Treating dose as a<br />
continuous, rather than a categorical variable requires a<br />
mathematical model.<br />
The merits <strong>of</strong> a power model <strong>of</strong> the <strong>for</strong>m PK �<br />
� 0 ● <strong>Dose</strong> �1 were recognized by Klamerus, et al. (9). General<br />
applicability <strong>of</strong> the power model to proportionality assessment<br />
was clearly outlined by Gough, et al. The power model<br />
is well suited to detect a nonlinear pharmacokinetic response<br />
and to estimate the magnitude <strong>of</strong> the deviation. Such an empirical<br />
model facilitates standardization <strong>of</strong> metrics and decision<br />
rules across studies and drugs. A theoretically correct<br />
mechanistic model, perhaps based on a Michaelis-Menton<br />
equation, can be pursued subsequently to investigate the nonlinear<br />
process. In the present paper, we extend the estimation<br />
approach to derive confidence intervals and decision rules <strong>for</strong><br />
dose-proportional assessment <strong>of</strong> drug exposure. Although the<br />
approach is best illustrated in conjunction with the power<br />
model, the logic can be generally applied to empiric and<br />
mechanistic models.<br />
METHODS<br />
Proportionality as an Equivalence Problem<br />
The logic <strong>for</strong> application <strong>of</strong> confidence intervals to the<br />
dose-proportionality problem is analogous to that <strong>for</strong> testing
<strong>Confidence</strong> <strong>Interval</strong> <strong>Criteria</strong> <strong>for</strong> <strong>Dose</strong> Proportionality 1279<br />
average bioequivalence in the United States. Bioequivalence<br />
is declared if the (1-�)% CI <strong>for</strong> the ratio <strong>of</strong> geometric mean<br />
values <strong>for</strong> C max and AUC are contained completely in the<br />
acceptance interval (� L, � H), where � L
1280<br />
Thus, as the dose ratio increases, the critical region <strong>for</strong> �1 narrows. It is intuitive that the criterion <strong>for</strong> proportionality<br />
should be more stringent <strong>for</strong> a large dose range than that <strong>for</strong><br />
a narrow range. This property has two important consequences.<br />
First, a maximal dose ratio �1 can be calculated such<br />
that the CI <strong>for</strong> �1, denoted (L, U), is included entirely within<br />
the interval defined by Eq. (4). Second, a dose ratio �2 can<br />
sometimes be calculated such that (L, U) lies completely outside<br />
the acceptance interval. The value <strong>of</strong> �1 or �2 may be<br />
larger or may be smaller than the actual dose range studied.<br />
Thus, the proposed approach supports inferences about how<br />
the PK response changes with dose that are not constrained to<br />
the doses studied. Extrapolation beyond the studied dose<br />
range should obviously be done cautiously.<br />
The values <strong>of</strong> �1 and �2 may be calculated as follows. If<br />
1-L > U-1 then solve the following equation <strong>for</strong> �1: 1 + ln(�L)/ ∧<br />
ln(�1) � L. This gives �1 � �L [1/(L − 1)]. If 1-L < U-1 then<br />
∧<br />
solving 1 + ln(�H)/ln(�1) � U <strong>for</strong> �1 gives �1 � �H [1/<br />
(U − 1)]. This procedure ensures that if r < �1 then (L, U) is<br />
completely contained in (1 + ln(�L)/ln(r), 1 + ln(�H)/ln(r)). If �H � 1/�L then the analytical solution <strong>for</strong> �1 is:<br />
�1 = � ∧� 1<br />
H<br />
(6)<br />
max�1 − L, U −1��<br />
A similar set <strong>of</strong> logic leads to the analytical solution <strong>for</strong> � 2<br />
which is<br />
� 2 = � H<br />
∧�<br />
1<br />
(7)<br />
max�L − 1, 1 − U��<br />
WhenL1,� 2 cannot be solved. This is logical <strong>for</strong><br />
this circumstance, since it implies strict dose proportionality is<br />
tenable.<br />
<strong>Dose</strong>-proportionality data are commonly obtained following<br />
drug administration to healthy subjects or patients on<br />
two or more occasions. If the power model is appropriate,<br />
then a mixed-effects statistical model based on Eq. (3) can be<br />
used to account <strong>for</strong> correlation between repeated measurements<br />
in a given subjects. The following general <strong>for</strong>m was<br />
considered:<br />
ln(PK ij) � (� 0 + � 1i) +(� 1 + � 2i) � ln(DOSE ij) +� ij (8)<br />
<strong>for</strong> the jth observation <strong>of</strong> PK in the ith subject. The model<br />
2<br />
denotes random between-subject variability �1i ∼ N(0, �1)in the intercept parameter, random between-subject variability<br />
2<br />
�2i ∼ N(0, �2) in the slope, as well as random error �ij ∼ N(0,<br />
� 2 ). The data may not support inclusion <strong>of</strong> �2i in the model.<br />
The random effects, as well as the fixed effects (�0 and �1) and their 90% confidence intervals, can be estimated with the<br />
MIXED procedure <strong>of</strong> SAS and other statistical packages.<br />
Subject<br />
Number<br />
Modeling <strong>of</strong> Clearance<br />
When AUC is dose proportional, then the apparent oral<br />
clearance (CL/F � <strong>Dose</strong>/AUC; F � 1.0) or the clearance<br />
after intravenous dosing (F � 1.0) is dose-independent. For<br />
any assessment to be congruous, an inference about whether<br />
or not AUC is dose proportional should be exactly the same<br />
as an inference about whether or not clearance is dose independent.<br />
If AUC at each dose level is log-normally distributed<br />
(an assumption <strong>of</strong> the power model), then CL/F is also<br />
log-normal since it is the inverse <strong>of</strong> AUC (times a constant).<br />
Substituting CL/F ● <strong>Dose</strong> as the PK parameter in Eq. (3) reveals<br />
that the coefficient <strong>of</strong> ln(dose) is 1-� 1. Thus, the inference<br />
that � 1 � 1 <strong>for</strong> the AUC model is equivalent to the<br />
inference that � 1 � 0 <strong>for</strong> regression <strong>of</strong> ln(CL/F) on ln(<strong>Dose</strong>).<br />
The (1-�) confidence interval <strong>for</strong> the ratio <strong>of</strong> geometric mean<br />
CL/F values can be compared to a acceptance interval in a<br />
manner analogous to that described above.<br />
Case 4: Saturable Elimination Model (Quadratic Regression<br />
with no Intercept)<br />
This case applies the confidence interval logic to a common<br />
mechanistic model <strong>of</strong> pharmacokinetic non-linearity.<br />
Consider a single bolus intravenous dose <strong>of</strong> a drug that distributes<br />
to one volume (V) and that is eliminated by a saturable<br />
process characterized by a hyperbolic (Michaelis-<br />
Menton) function with parameters Vmax and Km. Here Km is<br />
the drug concentration at which the elimination rate is halfmaximal<br />
(Vmax/2). Wagner (12) showed that drug exposure<br />
(AUC) is:<br />
AUC = Km 1<br />
<strong>Dose</strong> +<br />
Vmax 2Vmax V <strong>Dose</strong>2 (9)<br />
where his equation has been reparameterized to relate it to<br />
quadratic regression through the origin. If Vmax is large<br />
(elimination is not readily saturable), 1/(2VmaxV) → 0 and<br />
AUC is given by dose times intrinsic clearance (Vmax/Km), a<br />
fundamental pharmacokinetic property. Chau (13) derived<br />
equations <strong>for</strong> AUC as a function <strong>of</strong> dose <strong>for</strong> more complex<br />
pharmacokinetic models <strong>of</strong> Michaelis-Menton elimination.<br />
Sheppard, et al. (14) showed that the dose-normalized AUC<br />
ratio is:<br />
� 1<br />
r� AUCh AUC� = 2V � K m + h<br />
2V � K m + �<br />
The values <strong>of</strong> V and K m are usually unknown; there<strong>for</strong>e, the<br />
statistical model would be based on an empirical <strong>for</strong>m <strong>of</strong> Eq.<br />
(9) such as:<br />
AUC � � 1 � dose + � 2 � dose 2<br />
Table 1. Noncompartmental Parameters from a Phase 1, <strong>Dose</strong>-escalation Study<br />
LY333013<br />
<strong>Dose</strong><br />
C max<br />
(ng/mL)<br />
Smith et al.<br />
AUC 0-�<br />
(ng � hr/mL)<br />
1, 2 25 mg 64.82, 67.35 326.4, 437.82<br />
4, 5, 6 50 mg 104.15, 143.12, 243.63 557.47, 764.85, 943.59<br />
250 mg 451.44, 393.45, 796.57 2040.84, 2989.29, 4107.58<br />
7, 8, 9 75 mg 145.13, 166.77, 296.9 1562.42, 982.02, 1359.68<br />
250 mg 313, 387, 843 3848.86, 4333.1, 3685.55
<strong>Confidence</strong> <strong>Interval</strong> <strong>Criteria</strong> <strong>for</strong> <strong>Dose</strong> Proportionality 1281<br />
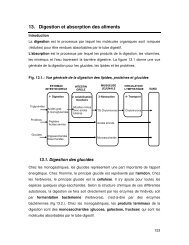
Fig. 1. Power model <strong>for</strong> example 1. The solid line denotes tile expected<br />
geometric mean value and the shading denotes the 90% prediction<br />
limits.<br />
where � 1 � K m/V max and � 2 � 1/(2V maxV). Linking the CI<br />
criterion to the model and solving <strong>for</strong> the model parameters<br />
gives:<br />
h − �� L<br />
� L − 1 � � 2<br />
� 1<br />
� h − �� H<br />
� H − 1<br />
(10)<br />
Calculation <strong>of</strong> a confidence interval <strong>for</strong> � 2/� 1 requires bootstrapping<br />
or use <strong>of</strong> Fieller’s theorem (11) since it is a ratio <strong>of</strong><br />
two normally distributed values.<br />
Decision Rules<br />
The acceptance interval (� L, � H) <strong>for</strong> R dnm and the statistical<br />
model <strong>for</strong> estimation are not alone sufficient to support<br />
clinically meaningful conclusions. If (L, U) lay completely<br />
outside the acceptance interval, then one would conclude<br />
lack <strong>of</strong> proportionality. A 90% CI lying entirely within<br />
the critical region would confirm a proportionate increase in<br />
exposure. If the dose ratio <strong>of</strong> interest falls between � 1 and � 2,<br />
then (L, U) would span the critical region and no clear-cut<br />
statistic would be obtained. Here, � 1 as the best estimate <strong>of</strong><br />
deviation from ideal proportionality, and (L, U) indicating<br />
the maximal possible deviations, could be interpreted in the<br />
context <strong>of</strong> drug safety and efficacy or pharmacological effect<br />
<strong>Dose</strong> range<br />
studied<br />
data. This is, understanding the association between systemic<br />
exposure and dose is more difficult that accepting a dichotomous<br />
outcome <strong>of</strong> a statistical test.<br />
RESULTS AND DISCUSSION<br />
Estimation <strong>of</strong> the expected PK value by means <strong>of</strong> a statistical<br />
power model, coupled with confidence interval criteria<br />
to define proportionate and disproportionate ranges is a pragmatic<br />
approach to obtaining clinically relevant in<strong>for</strong>mation on<br />
variation in drug exposure with dose. An essential model assumption<br />
is that doubling the dose will increase PK by a<br />
constant proportion. For instance, if increasing -the dose from<br />
100 to 200 causes a 90% increase in the PK parameter <strong>of</strong><br />
interest, then a dose increment from 200 to 400 will also increase<br />
PK by 90%. The first example illustrates analysis <strong>of</strong><br />
limited data typical <strong>of</strong> a dose-escalation study in early clinical<br />
development, and the second example represents a “definitive”<br />
dose proportionality study.<br />
Example 1 (Secretory Phospholipase Inhibitor LY333013)<br />
LY333013 is the methyl ester <strong>of</strong> [[3-(aminooxoacetyl)-2ethyl-1-(phenylmethyl)-1H-indol-4-yl]ocy]acetate,<br />
which is a<br />
potent inhibitor <strong>of</strong> human non-pancreatic secretary phospholipase<br />
A 2 (sPLA 2). When orally administered, LY333013 is<br />
rapidly hydrolyzed to the active acid, which is measured in<br />
plasma. LY333013 is being developed <strong>for</strong> use in patients with<br />
chronic inflammatory conditions associated with elevated serum<br />
levels <strong>of</strong> sPLA 2. Evaluation <strong>of</strong> exposure (AUC and<br />
C max) as a function <strong>of</strong> dose was an objective <strong>of</strong> the first clinical<br />
study, in which single doses <strong>of</strong> an oral suspension were<br />
administered to healthy subjects (Table I).<br />
The PK values were evaluated with the following mixed<br />
effects statistical model:<br />
ln(PK ij) � (� 0 + � i)+� 1 � ln(dose ij) +� ij<br />
All � i’s and � ij’s were assumed to be mutually independent.<br />
Estimates <strong>of</strong> � 0 and � 1 and their 90% CI’s were obtained with<br />
the MIXED procedure (ML method) <strong>of</strong> SAS. Results revealed<br />
a disproportionately low increase in C max over the<br />
dose range (Figure 1). The estimate <strong>of</strong> the “intercept” parameter<br />
� 0 [1.94 with a 90% CI <strong>of</strong> (1.54, 2.35)] and its betweensubject<br />
variability � 2 � 0.097 are not <strong>of</strong> interest here. The<br />
Table 2. <strong>Dose</strong> Proportionality <strong>Assessment</strong> <strong>of</strong> a Phase 1, <strong>Dose</strong>-escalation Study<br />
Predicted<br />
geometric<br />
mean PK<br />
parameter<br />
values<br />
Cmax (ng/mL)<br />
25 to 250 mg 80.9 to 467<br />
AUC0-� (ng � hr/mL)<br />
25 to 250 mg 415 to 3353<br />
R dnm 90%<br />
confidence interval a<br />
Conclusion <strong>for</strong><br />
dose range<br />
studied b<br />
Maximal proportional<br />
dose range c<br />
(� 1)<br />
Threshold dose<br />
ratio to reject<br />
proportionality d<br />
(� 2)<br />
0.577<br />
(0.477, 0.698)<br />
0.808<br />
not proportional 2.0 4.2<br />
(0.653, 1.001) inconclusive 3.3 no value e<br />
a Ratio <strong>of</strong> model-predicted mean values <strong>for</strong> high and low dose, normalized <strong>for</strong> dose.<br />
b Proportionality was concluded if the 90% confidence interval <strong>for</strong> Rdnm was contained completely within (0.8, 1.25).<br />
c Proportionality would be concluded <strong>for</strong> any dose ratio less than this value.<br />
d Lack <strong>of</strong> proportionality would be concluded <strong>for</strong> any dose ratio greater than this value.<br />
e See qualification in text.
1282<br />
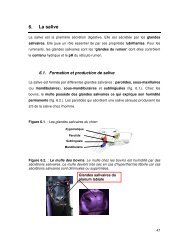
Fig. 2. The ratio <strong>of</strong> geometric mean C max values normalized <strong>for</strong> dose<br />
(—) and its 90% CI (– – –) as predicted by the power model <strong>for</strong><br />
example 1. Region 1 corresponds to a conclusion <strong>of</strong> proportionality,<br />
while C max values in region 3 are definitely not proportional to dose.<br />
Region 2 corresponds to an inconclusive result.<br />
estimate <strong>of</strong> the slope parameter � 1 was 0.7615. The corresponding<br />
90% CI (0.679, 0.844) fell outside the reference interval<br />
(0.903, 1.097) defined by Eq. (4) <strong>for</strong> r � 10 and � H �<br />
1/� L � 1.25, indicating a disproportionate change in C max<br />
across the dose range studied.<br />
The modeling results were also expressed in terms <strong>of</strong> the<br />
actual pharmacokinetic parameter. The ratio <strong>of</strong> dosenormalized<br />
geometric means (R dnm) was calculated, where<br />
each mean (Table II) was obtained as exp[1.942 + 0.7615 ●<br />
ln(dose)]. An R dnm value <strong>of</strong> 1.00 would denote ideal doseproportionality.<br />
The 90% CI <strong>for</strong> the difference in logtrans<strong>for</strong>med<br />
means was calculated within the MIXED procedure.<br />
Exponentiation <strong>of</strong> each limit and division by r gave the<br />
90% CI <strong>for</strong> R dnm. This CI lay completely outside (0.80, 1.25),<br />
indicating a disproportionate increase in C max.<br />
Setting the lower confidence limit <strong>for</strong> � 1 equal to 1 +<br />
ln(0.8)/In(r) and solving <strong>for</strong> r gave r � � 1 � 2.0. That is, if the<br />
dose ratio is �2.0, then the 90% CI <strong>for</strong> R dnm will lie entirely<br />
within the critical region (Table II and Fig. 2). Setting U equal<br />
to 1 + ln(0.8)/In(r) gave r � � 2 � 4.2. If r � 4.2, then the 90%<br />
CI <strong>for</strong> the ratio <strong>of</strong> C max values will lie completely outside the<br />
critical region (Fig. 2; Region 3).<br />
The 90% CI <strong>for</strong> R dnm based on log-trans<strong>for</strong>med AUC 0-�<br />
values (Table II) intersects the acceptance interval (0.80,<br />
1.25). This CI alone does not support any definitive conclusion<br />
<strong>for</strong> the 10-fold range, since the true R dnm value may lie<br />
within or may lie outside <strong>of</strong> the acceptance interval. The 90%<br />
CI <strong>for</strong> � 1 was (0.8147, 1.0005). Setting these limits equal to<br />
<strong>Dose</strong> range studied<br />
ln(0.8r)/ln(r) yielded r � � 1 � 3.3 and no real value <strong>for</strong> � 2.<br />
Since (U, L) contains 1.0, no real value <strong>of</strong> r will yield a confidence<br />
interval <strong>for</strong> R dnm in region 3.<br />
Example 2 (AUC data from H. Patel)<br />
Patel (3) reported AUC 0-� data from a4×4replicated<br />
Latin square design with single 25, 50, 100 and 150 mg doses<br />
<strong>of</strong> an unidentified drug. Three subjects were randomly assigned<br />
to each <strong>of</strong> four treatment sequences. Lack <strong>of</strong> any carryover<br />
effect was evidenced by pre-dose plasma concentrations<br />
<strong>of</strong> “zero.” In the reanalysis <strong>of</strong> these data, it was assumed<br />
that there was no period or sequence effect. The following<br />
power model with a mixed-effects statistical structure was<br />
used:<br />
ln(PK ij) � � 0 + � 1i +(� 1 + � 2i) ● ln(dose ij) +� ij,<br />
<strong>for</strong> the jth observation in the ith subject. The random intercept<br />
(� 1), slope (� 2), and error (�) effects, as well as all individuals<br />
� 1i, � 2i, and � ij values, were assumed to be mutually<br />
independent. This example demonstrates that the proposed<br />
approach does not restrict the variance model structure. The<br />
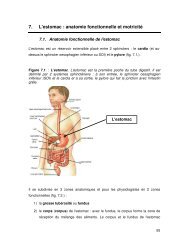
power model mirrored the obvious proportionate trend in the<br />
observed data (Fig. 3). It was possible to definitively conclude<br />
that AUC 0-� increased proportionally with dose over the<br />
6-fold range, since the 90% CI <strong>for</strong> R dnm was completely contained<br />
within the acceptance interval (Table III).<br />
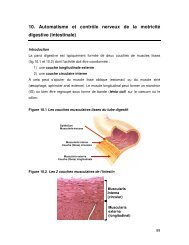
The 90% CI <strong>for</strong> � 1 was (0.980, 1.019). The lower limit<br />
corresponds to � 1 ≅ 70,000 indicating there was negligible<br />
evidence from this study alone to declare any deviation from<br />
Table 3. <strong>Dose</strong> Proportionality <strong>Assessment</strong> <strong>of</strong> AUC 0-� Data from Patel (3)*<br />
Predicted geometric<br />
mean AUC 0-� values<br />
(ng � hr/mL)<br />
25 to 150 mg 179 to 1072<br />
* Column headers are described in Table II.<br />
a See qualifications in text.<br />
R dnm and 90%<br />
confidence interval<br />
Conclusion <strong>for</strong><br />
dose range studied<br />
Maximal<br />
proportional<br />
dose range<br />
(� 1)<br />
0.9996<br />
(0.97, 1.04) Proportional ∼70,000 a<br />
Smith et al.<br />
Fig. 3. Power model <strong>for</strong> Example 2. The solid line denotes the expected<br />
geometric mean value and the shaded region denotes the 90%<br />
prediction limits.<br />
Threshold dose<br />
ratio to reject<br />
proportionality<br />
(� 2)<br />
no value a
<strong>Confidence</strong> <strong>Interval</strong> <strong>Criteria</strong> <strong>for</strong> <strong>Dose</strong> Proportionality 1283<br />
Fig. 4. The ratio <strong>of</strong> geometric mean values normalized <strong>for</strong> dose (—)<br />
and its 90% CI (– – –) as predicted by the power model <strong>for</strong> Example<br />
2. Region 1 corresponds to a definitive conclusion <strong>of</strong> proportionality.<br />
Region 2 is inconclusive on dose proportionality.<br />
ideal dose proportionality. This is not to condone extrapolation<br />
far beyond the dose levels studied, since any drug would<br />
be expected to display nonlinear pharmacokinetics at inordinately<br />
high or low doses. The 90% CI <strong>for</strong> � 1 contained 1.0;<br />
thus, a hypothesis that AUC 0-� was truly proportional to dose<br />
could not be rejected based on this study alone. This is represented<br />
by the entry <strong>of</strong> “no value” in Table III.<br />
Estimation <strong>of</strong> Deviations from Proportionality<br />
The examples indicate that conclusions are not constrained<br />
to a dichotomous outcome <strong>of</strong> “proportional” or “not<br />
proportional” over an arbitrary dose range, since a maximal<br />
dose ratio consistent with proportionality and a threshold ratio<br />
above which exposure is definitely not proportional are<br />
defined. The need to link any conclusion on dose proportionality<br />
with a specific dose range has been well stated by Gough,<br />
et al. (4) and Sheppard et al. (14). Conclusions from the<br />
power model relate to a dose ratio rather than to specific dose<br />
levels. If there is evidence that this modeling assumption is<br />
inappropriate, then the CI criteria can be used with another<br />
function.<br />
For a given subject sample size, a study design can be<br />
chosen in order to minimize the standard error <strong>for</strong> � 1 and<br />
thereby narrow its confidence interval (minimize region 2).<br />
The standard error is minimized (estimation is most efficient)<br />
when one-half <strong>of</strong> the observations are collected at the lowest<br />
dose at which precise PK measurements are possible and onehalf<br />
at the maximum tolerated dose. From a statistical point<br />
<strong>of</strong> view, the optimal design is thus a 2-period, 2-treatment<br />
crossover. A desire to collect data at other levels and to verify<br />
the applicability <strong>of</strong> the power model could be persuasive <strong>for</strong><br />
inclusion <strong>of</strong> additional treatments.<br />
Decision rules based on a confidence interval <strong>for</strong> the<br />
statistical model <strong>of</strong> choice can be detached from the power<br />
model, as was noted above <strong>for</strong> the saturable elimination<br />
model. Irrespective <strong>of</strong> the mathematical relationship between<br />
PK and dose, the 90% CI <strong>for</strong> the ratio <strong>of</strong> expected mean<br />
(arithmetic, least squares, geometric, predicted geometric,<br />
etc.) values <strong>of</strong> the PK metric can be compared to a prespecified<br />
acceptance interval (� L, � H). This approach is<br />
straight<strong>for</strong>ward and based on the logic used in bioequivalence<br />
testing. The method can be applied to common doseescalation<br />
and crossover designs and supports standardization<br />
<strong>of</strong> decision rules and comparisons across studies and drugs.<br />
ACKNOWLEDGMENTS<br />
The authors wish to thank Mosun Ayan-Oshodi, David<br />
Radtke, and Patty Grega <strong>for</strong> their assistance.<br />
REFERENCES<br />
1. J. D. Haynes and A. I. Weiss. Modeling pharmacokinetic doseproportionality<br />
data. Proceed. Biopharm. Section Amer. Stat. Assoc.<br />
85–89 (1989).<br />
2. L. Yuh, M. G. Eller, and S. J. Ruberg. A stepwise approach <strong>for</strong><br />
analyzing dose proportionality studies. Proceed. Biopharm. Section<br />
Amer. Stat. Assoc. 47–50 (1990).<br />
3. H. I. Patel. <strong>Dose</strong>-response in pharmacokinetics. Commun. Statist.-Theory<br />
Meth. 23:451–465 (1994).<br />
4. K. Gough, M. Hutchison, O. Keene, B. Byrom, S. Ellis, L. Lacey,<br />
and J. McKellar. <strong>Assessment</strong> <strong>of</strong> dose proportionality: Report<br />
from the statisticians in the pharmaceutical industry/pharmacokinetics<br />
UK joint working party. Drug Info. J. 29:1039–1048<br />
(1995).<br />
5. J. T. Lettieri, M. C. Rogge, L. Kaiser, R. M. Echols, and A. H.<br />
Heller. Pharmacokinetic pr<strong>of</strong>iles <strong>of</strong> cipr<strong>of</strong>loxacin after single intravenous<br />
and oral doses. Antimicrob. Agents Chemother. 36:993–<br />
996 (1992).<br />
6. W. Cawello, A. Leonhardt, H. Schweer, H. W. Seyberth, R.<br />
Bonn, and A. L. Lomeli. <strong>Dose</strong> proportional pharmacokinetics <strong>of</strong><br />
alprostadil (prostaglandin E1) in healthy volunteers following intravenous<br />
infusion. Br. J. Clin. Pharmacol. 40:273–276 (1995).<br />
7. D. R. Brocks, A. W. Meikle, S. C. Boike, N. A. Mazer, N. Zariffa,<br />
P. R. Audet, and D. K. Jorkasky. Pharmacokinetics <strong>of</strong> Testosterone<br />
in hypogonadal men after transdermal delivery: Influence <strong>of</strong><br />
dose. J. Clin. Pharmacol. 36:732–739 (1996).<br />
8. T. M. Ludden, D. A. Boyle, D. Gieseker, G. T. Kennedy, M. H.<br />
Craw<strong>for</strong>d, L. K. Ludden, and W. A. Clement. Absolute bioavailability<br />
and dose proportionality <strong>of</strong> betaxolol in normal healthy<br />
subjects. J. Pharm. Sci. 77:779–782 (1988).<br />
9. K. J. Klamerus, K. Maloney, R. L. Rudolph, S. F. Sisenwine,<br />
W. J. Jusko, and S. T. Chiang. Introduction <strong>of</strong> a composite parameter<br />
to the pharmacokinetics <strong>of</strong> Venalfaxine and its active<br />
O-desmethyl metabolite. J. Clin. Pharmacol. 32:716–724 (1992).<br />
10. M.-L. Chen and R. Patnaik. Statistical Procedures <strong>for</strong> Bioequivalence<br />
Studies Using a Standard Two-Treatment Crossover Design.<br />
Division <strong>of</strong> Bioequivalence, Office <strong>of</strong> Generic Drugs, Food<br />
and Drug Administration 1992.<br />
11. D. J. Finney. Statistical Method in Biological Assay, Third Edition,<br />
Charles Griffin & Company Ltd, London, 1978.<br />
12. J. G. Wagner. Properties <strong>of</strong> the Michaelis-Menton equation and<br />
its integrated <strong>for</strong>m which are useful in pharmacokinetics. J. Pharmacokin.<br />
Biopharm. 1:103–120 (1973).<br />
13. N. P. Chau. Area-dose relationships in nonlinear models. J. Pharmacokin.<br />
Biopharm. 4:537–551 (1976).<br />
14. T. A. Sheppard, N. Lordi, and P. E. Sparrow. Influence <strong>of</strong> dose<br />
range on degree <strong>of</strong> nonlinearity detected in dose-proportionality<br />
studies <strong>for</strong> drugs with saturable elimination: single-dose and<br />
steady-state studies. Pharm. Res. 10:289–293 (1993).