FSBstats: A First Look
FSBstats: A First Look
FSBstats: A First Look
- No tags were found...

Create successful ePaper yourself
Turn your PDF publications into a flip-book with our unique Google optimized e-Paper software.
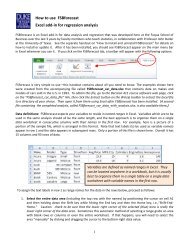
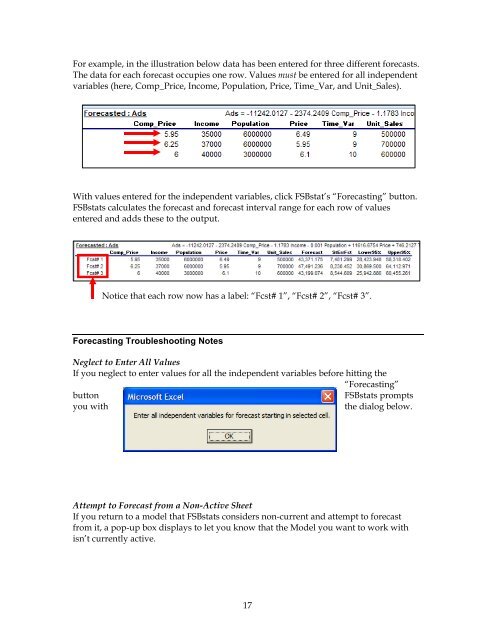
For example, in the illustration below data has been entered for three different forecasts.The data for each forecast occupies one row. Values must be entered for all independentvariables (here, Comp_Price, Income, Population, Price, Time_Var, and Unit_Sales).With values entered for the independent variables, click FSBstat’s “Forecasting” button.<strong>FSBstats</strong> calculates the forecast and forecast interval range for each row of valuesentered and adds these to the output.Notice that each row now has a label: “Fcst# 1”, “Fcst# 2”, “Fcst# 3”.Forecasting Troubleshooting NotesNeglect to Enter All ValuesIf you neglect to enter values for all the independent variables before hitting the“Forecasting”button<strong>FSBstats</strong> promptsyou withthe dialog below.Attempt to Forecast from a Non-Active SheetIf you return to a model that <strong>FSBstats</strong> considers non-current and attempt to forecastfrom it, a pop-up box displays to let you know that the Model you want to work withisn’t currently active.17