ALBERTA PERMANENT CLINICAL IMPAIRMENT GUIDE - Workers ...
ALBERTA PERMANENT CLINICAL IMPAIRMENT GUIDE - Workers ...
ALBERTA PERMANENT CLINICAL IMPAIRMENT GUIDE - Workers ...

You also want an ePaper? Increase the reach of your titles
YUMPU automatically turns print PDFs into web optimized ePapers that Google loves.
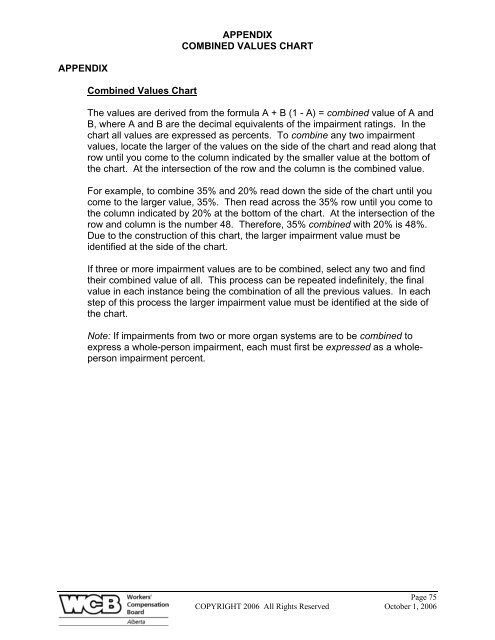
APPENDIXCOMBINED VALUES CHARTAPPENDIXCombined Values ChartThe values are derived from the formula A + B (1 - A) = combined value of A andB, where A and B are the decimal equivalents of the impairment ratings. In thechart all values are expressed as percents. To combine any two impairmentvalues, locate the larger of the values on the side of the chart and read along thatrow until you come to the column indicated by the smaller value at the bottom ofthe chart. At the intersection of the row and the column is the combined value.For example, to combine 35% and 20% read down the side of the chart until youcome to the larger value, 35%. Then read across the 35% row until you come tothe column indicated by 20% at the bottom of the chart. At the intersection of therow and column is the number 48. Therefore, 35% combined with 20% is 48%.Due to the construction of this chart, the larger impairment value must beidentified at the side of the chart.If three or more impairment values are to be combined, select any two and findtheir combined value of all. This process can be repeated indefinitely, the finalvalue in each instance being the combination of all the previous values. In eachstep of this process the larger impairment value must be identified at the side ofthe chart.Note: If impairments from two or more organ systems are to be combined toexpress a whole-person impairment, each must first be expressed as a wholepersonimpairment percent.Page 75COPYRIGHT 2006 All Rights Reserved October 1, 2006