

Regional warming changes fish species richness in the eastern ...
Regional warming changes fish species richness in the eastern ...
Regional warming changes fish species richness in the eastern ...

You also want an ePaper? Increase the reach of your titles
YUMPU automatically turns print PDFs into web optimized ePapers that Google loves.
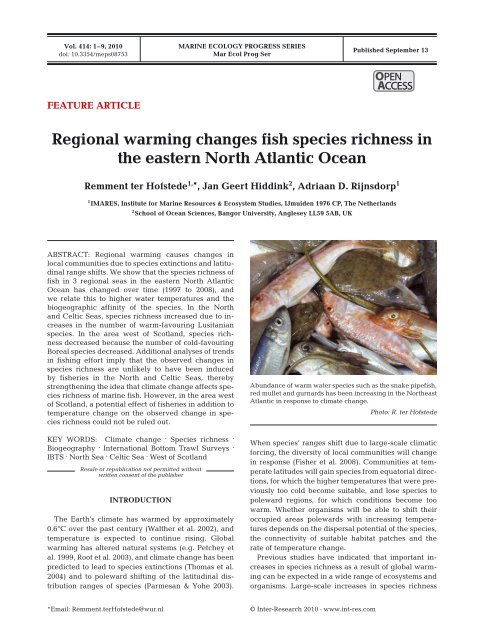
Vol. 414: 1–9, 2010doi: 10.3354/meps08753FEATURE ARTICLEMARINE ECOLOGY PROGRESS SERIESMar Ecol Prog SerPublished September 13OPENACCESS<strong>Regional</strong> <strong>warm<strong>in</strong>g</strong> <strong>changes</strong> <strong>fish</strong> <strong>species</strong> <strong>richness</strong> <strong>in</strong><strong>the</strong> <strong>eastern</strong> North Atlantic OceanRemment ter Hofstede 1, *, Jan Geert Hidd<strong>in</strong>k 2 , Adriaan D. Rijnsdorp 11 IMARES, Institute for Mar<strong>in</strong>e Resources & Ecosystem Studies, IJmuiden 1976 CP, The Ne<strong>the</strong>rlands2 School of Ocean Sciences, Bangor University, Anglesey LL59 5AB, UKABSTRACT: <strong>Regional</strong> <strong>warm<strong>in</strong>g</strong> causes <strong>changes</strong> <strong>in</strong>local communities due to <strong>species</strong> ext<strong>in</strong>ctions and latitud<strong>in</strong>alrange shifts. We show that <strong>the</strong> <strong>species</strong> <strong>richness</strong> of<strong>fish</strong> <strong>in</strong> 3 regional seas <strong>in</strong> <strong>the</strong> <strong>eastern</strong> North AtlanticOcean has changed over time (1997 to 2008), andwe relate this to higher water temperatures and <strong>the</strong>biogeographic aff<strong>in</strong>ity of <strong>the</strong> <strong>species</strong>. In <strong>the</strong> Northand Celtic Seas, <strong>species</strong> <strong>richness</strong> <strong>in</strong>creased due to <strong>in</strong>creases<strong>in</strong> <strong>the</strong> number of warm-favour<strong>in</strong>g Lusitanian<strong>species</strong>. In <strong>the</strong> area west of Scotland, <strong>species</strong> <strong>richness</strong>decreased because <strong>the</strong> number of cold-favour<strong>in</strong>gBoreal <strong>species</strong> decreased. Additional analyses of trends<strong>in</strong> <strong>fish</strong><strong>in</strong>g effort imply that <strong>the</strong> observed <strong>changes</strong> <strong>in</strong><strong>species</strong> <strong>richness</strong> are unlikely to have been <strong>in</strong>ducedby <strong>fish</strong>eries <strong>in</strong> <strong>the</strong> North and Celtic Seas, <strong>the</strong>rebystreng<strong>the</strong>n<strong>in</strong>g <strong>the</strong> idea that climate change affects <strong>species</strong><strong>richness</strong> of mar<strong>in</strong>e <strong>fish</strong>. However, <strong>in</strong> <strong>the</strong> area westof Scotland, a potential effect of <strong>fish</strong>eries <strong>in</strong> addition totemperature change on <strong>the</strong> observed change <strong>in</strong> <strong>species</strong><strong>richness</strong> could not be ruled out.KEY WORDS: Climate change . Species <strong>richness</strong> .Biogeography . International Bottom Trawl Surveys .IBTS . North Sea . Celtic Sea . West of ScotlandResale or republication not permitted withoutwritten consent of <strong>the</strong> publisherINTRODUCTIONThe Earth’s climate has warmed by approximately0.6°C over <strong>the</strong> past century (Wal<strong>the</strong>r et al. 2002), andtemperature is expected to cont<strong>in</strong>ue ris<strong>in</strong>g. Global<strong>warm<strong>in</strong>g</strong> has altered natural systems (e.g. Petchey etal. 1999, Root et al. 2003), and climate change has beenpredicted to lead to <strong>species</strong> ext<strong>in</strong>ctions (Thomas et al.2004) and to poleward shift<strong>in</strong>g of <strong>the</strong> latitud<strong>in</strong>al distributionranges of <strong>species</strong> (Parmesan & Yohe 2003).Abundance of warm water <strong>species</strong> such as <strong>the</strong> snake pipe<strong>fish</strong>,red mullet and gurnards has been <strong>in</strong>creas<strong>in</strong>g <strong>in</strong> <strong>the</strong> Nor<strong>the</strong>astAtlantic <strong>in</strong> response to climate change.Photo: R. ter HofstedeWhen <strong>species</strong>’ ranges shift due to large-scale climaticforc<strong>in</strong>g, <strong>the</strong> diversity of local communities will change<strong>in</strong> response (Fisher et al. 2008). Communities at temperatelatitudes will ga<strong>in</strong> <strong>species</strong> from equatorial directions,for which <strong>the</strong> higher temperatures that were previouslytoo cold become suitable, and lose <strong>species</strong> topoleward regions, for which conditions become toowarm. Whe<strong>the</strong>r organisms will be able to shift <strong>the</strong>iroccupied areas polewards with <strong>in</strong>creas<strong>in</strong>g temperaturesdepends on <strong>the</strong> dispersal potential of <strong>the</strong> <strong>species</strong>,<strong>the</strong> connectivity of suitable habitat patches and <strong>the</strong>rate of temperature change.Previous studies have <strong>in</strong>dicated that important <strong>in</strong>creases<strong>in</strong> <strong>species</strong> <strong>richness</strong> as a result of global <strong>warm<strong>in</strong>g</strong>can be expected <strong>in</strong> a wide range of ecosystems andorganisms. Large-scale <strong>in</strong>creases <strong>in</strong> <strong>species</strong> <strong>richness</strong>*Email: Remment.terHofstede@wur.nl© Inter-Research 2010 · www.<strong>in</strong>t-res.com
2Mar Ecol Prog Ser 414: 1–9, 2010have been recorded for butterflies (Menéndez et al.2006), freshwater <strong>fish</strong> (Daufresne & Boet 2007,Daufresne et al. 2004) and mar<strong>in</strong>e <strong>fish</strong> (Henderson2007, Hidd<strong>in</strong>k & ter Hofstede 2008). In each of <strong>the</strong>sestudies, <strong>the</strong> number of warm-favour<strong>in</strong>g <strong>species</strong> <strong>in</strong>creased,while only few cold-favour<strong>in</strong>g <strong>species</strong> werelost. A consensus has emerged that many <strong>species</strong> areexpand<strong>in</strong>g <strong>the</strong>ir distributions towards <strong>the</strong> poles and tohigher elevations <strong>in</strong> response to climate change, butcorrespond<strong>in</strong>g evidence for range retractions at low latitudeand low elevation boundaries has been comparativelyweak. It is unclear why not more <strong>species</strong> are observedretreat<strong>in</strong>g <strong>in</strong> <strong>the</strong>se regions (Thomas et al. 2006).Coastal mar<strong>in</strong>e ecosystems are among <strong>the</strong> most socio-economicallyand ecologically important habitats,and <strong>the</strong>se ecosystems are <strong>warm<strong>in</strong>g</strong> at a much faster ratethan many o<strong>the</strong>r ecosystems (MacKenzie & Schiedek2007). With<strong>in</strong> <strong>the</strong> mar<strong>in</strong>e environment, climate changeis suggested to affect <strong>the</strong> distribution, abundance andassemblage composition of <strong>fish</strong>. Future climate changeis predicted to lead to dramatic <strong>species</strong> turnovers of <strong>the</strong>present biodiversity, imply<strong>in</strong>g serious ecological disturbancesof <strong>the</strong> mar<strong>in</strong>e environment (Cheung et al. 2009).Such processes will <strong>in</strong>fluence <strong>the</strong> nature and value ofcommercial <strong>fish</strong>eries <strong>in</strong> <strong>the</strong>se ecosystems.A regional change <strong>in</strong> water temperature may lead to<strong>changes</strong> <strong>in</strong> <strong>the</strong> local <strong>fish</strong> community because of immigrationand/or emigration of <strong>species</strong> with differenttemperature preferences (Blanchard et al. 2005).Macpherson (2002) showed a clear latitud<strong>in</strong>al gradient<strong>in</strong> mar<strong>in</strong>e <strong>species</strong> <strong>richness</strong> to <strong>in</strong>crease from <strong>the</strong> polesto <strong>the</strong> Equator, and subsequently it is expected thathigher water temperatures will result <strong>in</strong> <strong>in</strong>creas<strong>in</strong>gmar<strong>in</strong>e <strong>fish</strong> <strong>species</strong> <strong>richness</strong>. In general, a <strong>warm<strong>in</strong>g</strong>environment would result <strong>in</strong> poleward advances of<strong>species</strong> with an aff<strong>in</strong>ity to warm water (Lusitanian)and retreats of <strong>species</strong> with an aff<strong>in</strong>ity to cooler water(Boreal) (Brander et al. 2003, Southward et al. 2005,Stefansdottir et al. 2010).The ecological effects of climate change are likely tobe region-specific and may vary widely depend<strong>in</strong>g on<strong>species</strong> and community characteristics and specificregional conditions (Wal<strong>the</strong>r et al. 2002). To date, moststudies of <strong>the</strong> ecological effect of climate change onmar<strong>in</strong>e <strong>fish</strong> have largely concentrated on <strong>the</strong> impact at<strong>the</strong> <strong>in</strong>dividual <strong>species</strong> level (e.g. Attrill & Power 2002,Perry et al. 2005, Dulvy et al. 2008, Nye et al. 2009)ra<strong>the</strong>r than on community metrics such as <strong>species</strong> <strong>richness</strong>(i.e. <strong>the</strong> number of <strong>species</strong> observed). In thisstudy, we compared trends <strong>in</strong> <strong>fish</strong> <strong>species</strong> <strong>richness</strong>among 3 regions <strong>in</strong> <strong>the</strong> <strong>eastern</strong> Atlantic Ocean, namely(1) <strong>the</strong> North Sea, (2) <strong>the</strong> Celtic Sea, and (3) off <strong>the</strong>west coast of Scotland. Differences <strong>in</strong> <strong>the</strong> local physicalenvironment such as variation <strong>in</strong> summer and w<strong>in</strong>tertemperatures, and depth ranges, clearly cause differences<strong>in</strong> <strong>species</strong> <strong>richness</strong> among <strong>the</strong> 3 regions. We<strong>the</strong>refore exam<strong>in</strong>ed area-specific <strong>changes</strong> <strong>in</strong> <strong>species</strong><strong>richness</strong>. Trends <strong>in</strong> <strong>species</strong> <strong>richness</strong> for mar<strong>in</strong>e <strong>fish</strong> <strong>in</strong><strong>the</strong> North Sea have been related to temperature <strong>in</strong> aprevious study (Hidd<strong>in</strong>k & ter Hofstede 2008); <strong>the</strong>sedata were reanalysed us<strong>in</strong>g a shorter time series tostandardise <strong>the</strong> analyses between <strong>the</strong> different areasused. Our objective was to determ<strong>in</strong>e whe<strong>the</strong>r <strong>species</strong><strong>richness</strong> of mar<strong>in</strong>e <strong>fish</strong> <strong>in</strong> <strong>the</strong> 3 different regions displayssimilar trends through time and whe<strong>the</strong>r it has aconsistent relation to bottom temperature. If <strong>warm<strong>in</strong>g</strong>is <strong>the</strong> cause of <strong>changes</strong> <strong>in</strong> <strong>fish</strong> <strong>species</strong> composition, itcan be expected that <strong>the</strong> change <strong>in</strong> <strong>species</strong> <strong>richness</strong>relates to <strong>the</strong> biogeographic aff<strong>in</strong>ity of <strong>species</strong>, suchthat Boreal (cold-favour<strong>in</strong>g) <strong>species</strong> decrease <strong>in</strong> abundance,while Lusitanian (warm-favour<strong>in</strong>g) <strong>species</strong><strong>in</strong>crease <strong>in</strong> abundance. A consistent relationship betweentemperature change and <strong>changes</strong> <strong>in</strong> <strong>species</strong><strong>richness</strong> will <strong>in</strong>dicate that large-scale <strong>in</strong>creases <strong>in</strong> <strong>species</strong>can be expected <strong>in</strong> temperate mar<strong>in</strong>e ecosystems.MATERIALS AND METHODSSurvey data. Annual data describ<strong>in</strong>g <strong>the</strong> <strong>fish</strong> distribution(<strong>in</strong>clud<strong>in</strong>g elasmobranchs) <strong>in</strong> <strong>the</strong> 3 differentstudy areas dur<strong>in</strong>g <strong>the</strong> w<strong>in</strong>ter were taken from 3 InternationalBottom Trawl Surveys (IBTS) coord<strong>in</strong>ated by<strong>the</strong> International Council for <strong>the</strong> Exploration of <strong>the</strong> Sea(ICES), namely <strong>the</strong> first quarter IBTS <strong>in</strong> <strong>the</strong> North Sea,<strong>the</strong> first quarter Western Division Bottom Trawl Survey<strong>in</strong> <strong>the</strong> Inland Sea off <strong>the</strong> west coast of Scotland, and <strong>the</strong>fourth quarter French Ground<strong>fish</strong> Survey <strong>in</strong> <strong>the</strong> CelticSea. These surveys aimed for coherence and consistency<strong>in</strong> <strong>the</strong> collected data by standardis<strong>in</strong>g <strong>the</strong>ir sampl<strong>in</strong>gmethods and protocols (ICES 2008a). All surveysused a standard bottom-trawl net (chalut à grandeouverture verticale, GOV-trawl), a gear that is specificallydesigned to sample <strong>fish</strong> that live at and above<strong>the</strong> seabed (Heessen et al. 1997).When compar<strong>in</strong>g surveys, differences <strong>in</strong> sampl<strong>in</strong>gmethod (gear) contribute more to <strong>the</strong> variance <strong>in</strong> abundanceestimates compared to survey period (quarter)(Trenkel et al. 2004). S<strong>in</strong>ce <strong>the</strong> 3 studied areas weresampled accord<strong>in</strong>g to a correspond<strong>in</strong>g standard IBTSprotocol, and both studied quarters (1 and 4) compriseda cold season, we considered it appropriate tocompare <strong>the</strong> surveys from <strong>the</strong>se 3 regions.The IBTS <strong>in</strong> <strong>the</strong> North Sea and west of Scotland followeda sampl<strong>in</strong>g strategy accord<strong>in</strong>g to a grid of ICESrectangles (0.5° latitude; 1° longitude; approximately56 × 56 km). The IBTS <strong>in</strong> <strong>the</strong> Celtic Sea is <strong>in</strong> pr<strong>in</strong>cipledepth-stratified, but to allow a uniform analysis, <strong>the</strong>aggregation was performed follow<strong>in</strong>g <strong>the</strong> grid of ICESrectangles. Details of <strong>the</strong> gear and sampl<strong>in</strong>g strategies
ter Hofstede et al.: <strong>Regional</strong> <strong>warm<strong>in</strong>g</strong> <strong>changes</strong> <strong>fish</strong> <strong>species</strong> <strong>richness</strong>3Fig. 1. Location of <strong>the</strong> 3 studied areas (NS: North Sea; CS:Celtic Sea; WS: west of Scotland). Open circles represent surveyedInternational Council for <strong>the</strong> Exploration of <strong>the</strong> Sea(ICES) rectangles; grey circles show <strong>the</strong> ICES rectangles used<strong>in</strong> <strong>the</strong> analyses (>75% annual coverage). Black dots <strong>in</strong>dicateICES rectangles that were used for <strong>the</strong> calculation of averagebottom temperaturescan be found <strong>in</strong> <strong>the</strong> manuals for <strong>the</strong> 3 surveys (ICES2002, 2006). The data were extracted from <strong>the</strong> ICESDatabase for Trawl Surveys (DATRAS, downloaded 17July 2009; http://datras.ices.dk).Fish data. Catch rates were standardised to <strong>the</strong> numberof <strong>in</strong>dividuals caught per 60 m<strong>in</strong> tow. The timeperiod dur<strong>in</strong>g which all surveys had an overlap <strong>in</strong>sound coverage of <strong>the</strong> different areas comprised morethan a decade (1997 to 2008). Such a time series is ofsufficient power to detect trends <strong>in</strong> both common andrare <strong>fish</strong> <strong>species</strong> (Maxwell & Jenn<strong>in</strong>gs 2005).To avoid <strong>the</strong> <strong>in</strong>troduction of temporal trends thatmay be related to differences <strong>in</strong> <strong>the</strong> sampled surveyarea over time, only rectangles <strong>fish</strong>ed <strong>in</strong> at least 75%of <strong>the</strong> years were used (Fig. 1). In total, 210 of <strong>the</strong> 262<strong>fish</strong>ed ICES rectangles were used <strong>in</strong> <strong>the</strong> analysis.The number of hauls per rectangle was distributedunevenly with<strong>in</strong> each area, rang<strong>in</strong>g between 1 and6 hauls yr –1 , on average 2.1 ± 0.8 hauls per rectangle <strong>in</strong><strong>the</strong> North Sea, 2.0 ± 1.0 <strong>in</strong> <strong>the</strong> Celtic Sea, and 1.3 ± 0.6<strong>in</strong> <strong>the</strong> west of Scotland. S<strong>in</strong>ce <strong>the</strong> number of <strong>species</strong>caught is positively correlated to <strong>the</strong> number of hauls<strong>fish</strong>ed (Daan 2006), <strong>the</strong> dataset was balanced beforeus<strong>in</strong>g it for fur<strong>the</strong>r analyses by apply<strong>in</strong>g <strong>the</strong> MonteCarlo resampl<strong>in</strong>g strategy. For each ICES rectangleand year, 1 haul was randomly selected, and this processwas repeated 100 times. These 100 random selectionswere averaged, result<strong>in</strong>g <strong>in</strong> 1 balanced dataseton which fur<strong>the</strong>r analyses were performed.Fish were identified to <strong>the</strong> lowest possible taxonomiclevel, which was mostly to <strong>species</strong> level; however,for consistency, we refer to all taxa as <strong>species</strong>. All<strong>species</strong> were labelled with <strong>the</strong>ir biogeographic aff<strong>in</strong>ity,i.e. Atlantic (widespread), Boreal (nor<strong>the</strong>rn, coldfavour<strong>in</strong>g)or Lusitanian (sou<strong>the</strong>rn, warm-favour<strong>in</strong>g),which was derived from <strong>the</strong> literature follow<strong>in</strong>g <strong>the</strong>approach of Yang (1982), with <strong>in</strong>clusion of <strong>fish</strong> <strong>species</strong>that have been recorded s<strong>in</strong>ce <strong>the</strong>n (Wheeler 1992,Froese & Pauly 2009, Wheeler et al. 2004, Ellis et al.2010). In Europe, Boreal <strong>fish</strong>es are those considered tobe nor<strong>the</strong>rly taxa which extend northwards to <strong>the</strong> NorwegianSea and Icelandic waters. These <strong>fish</strong>es oftenhave <strong>the</strong>ir sou<strong>the</strong>rn limits of distribution around <strong>the</strong>British Isles or west of Brittany, although some maystill occur fur<strong>the</strong>r south, ei<strong>the</strong>r <strong>in</strong> low numbers or asvagrants. Lusitanian <strong>fish</strong>es are those that tend to beabundant from <strong>the</strong> Iberian Pen<strong>in</strong>sula (<strong>in</strong>clud<strong>in</strong>g <strong>the</strong>Mediterranean Sea) to as far north as <strong>the</strong> British Isles,and may have nor<strong>the</strong>rly limits <strong>in</strong> <strong>the</strong> sou<strong>the</strong>rn or centralNorth Sea (although many such <strong>species</strong> do extendto more nor<strong>the</strong>rly latitudes on <strong>the</strong> western seaboards of<strong>the</strong> British Isles, and so can also occur <strong>in</strong> <strong>the</strong> northwesternNorth Sea). Many of <strong>the</strong>se <strong>species</strong> have distributionsextend<strong>in</strong>g <strong>in</strong>to <strong>the</strong> Mediterranean Sea and off<strong>the</strong> coast of northwest Africa. Atlantic <strong>species</strong> arethose (often pelagic or deep-water) <strong>species</strong> that arewidespread <strong>in</strong> <strong>the</strong> North Atlantic, and <strong>in</strong>clude many of<strong>the</strong> deeper-water or mesopelagic <strong>species</strong> that may bewidely distributed along <strong>the</strong> cont<strong>in</strong>ental slope.Corrections for misidentifications were made follow<strong>in</strong>g<strong>the</strong> approach of ter Hofstede & Daan (2008). Inaddition, some <strong>fish</strong> <strong>in</strong> <strong>the</strong> families Myctophidae, Serranidae,Percichthyidae, Blenniidae, Stichtaeidae, Callionymidae,Gobiidae, Bothidae and Rajidae were onlyidentified to <strong>the</strong> family level. To avoid mis<strong>in</strong>terpretationfor non-exist<strong>in</strong>g <strong>species</strong>, <strong>the</strong>se records were not<strong>in</strong>cluded <strong>in</strong> <strong>the</strong> analysis. The f<strong>in</strong>al list of taxa that couldbe characterised conta<strong>in</strong>ed 117 <strong>fish</strong> <strong>species</strong> for <strong>the</strong>North Sea (8 Atlantic, 48 Boreal, 61 Lusitanian), 115<strong>species</strong> for <strong>the</strong> Celtic Sea (17 Atlantic, 25 Boreal, 73Lusitanian), and 100 <strong>species</strong> for <strong>the</strong> area west of Scotland(9 Atlantic, 34 Boreal, 57 Lusitanian).Temperature data. Bottom temperature data wereobta<strong>in</strong>ed from <strong>the</strong> ICES Oceanographic Database(downloaded 29 June 2009; www.ices.dk/ocean), for<strong>the</strong> areas and quarters correspond<strong>in</strong>g to those <strong>in</strong> which<strong>the</strong> 3 surveys were executed. The time series of <strong>the</strong>sew<strong>in</strong>ter temperature data was available <strong>in</strong> higher quantities,<strong>in</strong> particular spatially, than for <strong>the</strong> o<strong>the</strong>r seasons;<strong>the</strong>refore, we chose to work only with data from <strong>the</strong>w<strong>in</strong>ter period. Bottom data were def<strong>in</strong>ed as <strong>the</strong> deepestmeasurement taken with a vertical CTD cast, <strong>in</strong>
4Mar Ecol Prog Ser 414: 1–9, 2010general around 5 m above <strong>the</strong> bottom. The data wereaveraged per quarter by ICES rectangle. To ensure abalanced dataset, miss<strong>in</strong>g data were <strong>in</strong>terpolated fromadjacent data by averag<strong>in</strong>g <strong>the</strong> mean bottom temperatureof <strong>the</strong> 8 surround<strong>in</strong>g rectangles. This <strong>in</strong>terpolationwas performed for less than 14% of <strong>the</strong> year–rectanglecomb<strong>in</strong>ations. The bottom temperature data seriescovers <strong>the</strong> time period 1993 to 2008 to allow for <strong>the</strong> calculationof 5 yr runn<strong>in</strong>g means. For <strong>the</strong> Celtic Sea, datawere miss<strong>in</strong>g dur<strong>in</strong>g <strong>the</strong> years 1995, 2007 and 2008,and <strong>in</strong> <strong>the</strong> area west of Scotland dur<strong>in</strong>g <strong>the</strong> years 1997to 1999. Fur<strong>the</strong>rmore, <strong>in</strong> <strong>the</strong> surveyed area west ofScotland, <strong>the</strong> available temperature data did not spatiallycover <strong>the</strong> area sufficiently for use <strong>in</strong> <strong>the</strong> analysis;<strong>the</strong>refore, 8 ICES rectangles (42E0 to 42E3 and 43E0 to43E3) that lie <strong>in</strong> <strong>the</strong> centre of <strong>the</strong> area and for whichdata are sufficiently available were selected to represent<strong>the</strong> entire area.Temporal trends <strong>in</strong> <strong>species</strong> <strong>richness</strong> for all <strong>fish</strong> <strong>species</strong>,Boreal <strong>species</strong>, and Lusitanian <strong>species</strong> wereanalysed us<strong>in</strong>g l<strong>in</strong>ear regression. Species <strong>richness</strong> wasrelated to <strong>the</strong> 5 yr runn<strong>in</strong>g average bottom temperature,calculated from <strong>the</strong> current year and <strong>the</strong> 4 previousyears, to allow for potential lagged effects. Us<strong>in</strong>g atime lag is a fairly common method to approximate <strong>the</strong>lifetime environmental experience of a <strong>fish</strong> (e.g. Perryet al. 2005, Dulvy et al. 2008), and <strong>species</strong> <strong>richness</strong>responded most significantly to 5 yr runn<strong>in</strong>g means ofw<strong>in</strong>ter bottom temperature. In case of years with miss<strong>in</strong>gtemperature data, <strong>the</strong> 5 yr runn<strong>in</strong>g means werebased on <strong>the</strong> available years only. The relation between<strong>richness</strong> and temperature was tested us<strong>in</strong>g Pearson’scorrelation coefficient (r), on a year basis.Fish<strong>in</strong>g effort data. To discuss whe<strong>the</strong>r observed<strong>changes</strong> <strong>in</strong> <strong>species</strong> <strong>richness</strong> may have been <strong>in</strong>duced by<strong>fish</strong>eries, we checked for <strong>changes</strong> <strong>in</strong> <strong>fish</strong><strong>in</strong>g effort <strong>in</strong><strong>the</strong> 3 different areas. We assumed that <strong>changes</strong> <strong>in</strong> <strong>fish</strong><strong>in</strong>geffort are reflected <strong>in</strong> <strong>the</strong> average <strong>fish</strong><strong>in</strong>g mortalitiesof <strong>the</strong> dom<strong>in</strong>ant commercial <strong>fish</strong> stocks estimatedby ICES assessment work<strong>in</strong>g groups (ICES 2008b,2009). Only <strong>the</strong> demersal <strong>fish</strong>eries that are of ma<strong>in</strong>importance <strong>in</strong> terms of effort were considered, whichare plaice, sole, cod, Norway pout, haddock and sai<strong>the</strong><strong>in</strong> <strong>the</strong> North Sea (ICES 2009); plaice, sole and cod <strong>in</strong><strong>the</strong> Celtic Sea (ICES 2008b), and haddock, sai<strong>the</strong> andcod <strong>in</strong> <strong>the</strong> area west of Scotland (ICES 2008b). Theresponse of <strong>fish</strong> to <strong>changes</strong> <strong>in</strong> exploitation is expectedto show a time lag; for example, Daan et al. (2005)noted a response time of 6 yr for an <strong>in</strong>crease <strong>in</strong> <strong>species</strong><strong>richness</strong> <strong>in</strong> relation to an <strong>in</strong>crease <strong>in</strong> <strong>fish</strong><strong>in</strong>g effort. Inour case, when ignor<strong>in</strong>g a time lag, we observed nocorrelation between <strong>fish</strong>eries effects and <strong>species</strong> <strong>richness</strong>.To allow for potential lagged effects, <strong>species</strong> <strong>richness</strong>was <strong>the</strong>refore related to <strong>the</strong> 6 yr runn<strong>in</strong>g average<strong>fish</strong><strong>in</strong>g mortality, calculated from <strong>the</strong> current year and<strong>the</strong> 5 previous years for <strong>the</strong> period 1992 to 2008. Therelation between <strong>species</strong> <strong>richness</strong> and <strong>fish</strong><strong>in</strong>g mortalitywas tested us<strong>in</strong>g Pearson’s correlation coefficient (r),on a year basis.Autocorrelation. Autocorrelation <strong>in</strong> <strong>fish</strong> and environmentaldata may complicate statistical <strong>in</strong>ference <strong>in</strong>correlation analyses (Pyper & Peterman 1998). Weused <strong>the</strong> Durb<strong>in</strong>-Watson statistic (D) on all of our timeseries to detect <strong>the</strong> presence of autocorrelation <strong>in</strong> <strong>the</strong>residuals from <strong>the</strong> regression analysis. In general, wefound no reason for concern that our data were autocorrelated,<strong>the</strong>reby justify<strong>in</strong>g our analyses for correlationbetween <strong>species</strong> <strong>richness</strong> versus temperature and<strong>fish</strong><strong>in</strong>g effort (bottom temperature: North Sea, NS, D =1.94; Celtic Sea, CS, D = 1.07; west of Scotland, WS,D = 1.98; <strong>fish</strong><strong>in</strong>g effort: NS, D = 1.70; CS, D = 0.56; WS,D = 1.47; total <strong>species</strong> <strong>richness</strong>: NS, D = 2.67; CS, D =2.48; WS, D = 2.43; Boreal <strong>species</strong> <strong>richness</strong>: NS, D =2.68; CS, D = 2.13; WS, D = 2.06; Lusitanian <strong>species</strong><strong>richness</strong>: NS, D = 1.51; CS, D = 2.20; WS, D = 2.06).RESULTSTemperatureW<strong>in</strong>ter bottom temperatures have <strong>in</strong>creased significantlys<strong>in</strong>ce 1993 <strong>in</strong> all 3 studied regions <strong>in</strong> <strong>the</strong> <strong>eastern</strong>Atlantic Ocean, <strong>in</strong> <strong>the</strong> North Sea by 0.09°C yr –1 (F 1,15 =12.01, p = 0.003), <strong>in</strong> <strong>the</strong> Celtic Sea by 0.04°C yr –1 (F 1,12 =6.46, p = 0.025), and <strong>in</strong> <strong>the</strong> central part of <strong>the</strong> area westof Scotland by 0.09°C yr –1 (F 1,12 = 0.005, p = 12.03;Fig. 2a). Surface temperatures from <strong>the</strong> same areas,obta<strong>in</strong>ed from <strong>the</strong> ICES Oceanographic Database andanalysed similarly to <strong>the</strong> CTD bottom temperaturedata, showed similar trends, although <strong>the</strong> rates ofchange differed slightly (NS: 0.10°C yr –1 , F 1,15 = 13.71,p = 0.002; CS: 0.09°C yr –1 , F 1,12 = 4.65, p = 0.052; WS:0.06°C yr –1 , F 1,12 = 7.76, p = 0.017). Surface temperatureswere highly correlated to bottom temperatures(NS: r = 0.96, p < 0.001; CS: r = 0.57, p < 0.001; WS: r =0.77, p < 0.001), <strong>the</strong>reby emphasis<strong>in</strong>g <strong>the</strong> strength of<strong>the</strong> bottom temperature data as used <strong>in</strong> our analyses.Species <strong>richness</strong>The annual <strong>species</strong> <strong>richness</strong> of <strong>the</strong> <strong>fish</strong> fauna <strong>in</strong> <strong>the</strong>North Sea (Fig. 3a) and Celtic Sea (Fig. 3b) <strong>in</strong>creasedsignificantly dur<strong>in</strong>g <strong>the</strong> studied period (NS: F 1,10 =10.91, p = 0.008); CS: F 1,9 = 15.56, p = 0.003), whereasa significant decrease was apparent west of Scotland(F 1,10 = 8.28, p = 0.016; Fig. 3c). Tak<strong>in</strong>g <strong>in</strong>to account <strong>the</strong>biogeographic aff<strong>in</strong>ity of <strong>the</strong> <strong>fish</strong> fauna, <strong>the</strong> <strong>richness</strong> ofBoreal <strong>fish</strong> <strong>species</strong> decreased <strong>in</strong> <strong>the</strong> area west of Scot-
ter Hofstede et al.: <strong>Regional</strong> <strong>warm<strong>in</strong>g</strong> <strong>changes</strong> <strong>fish</strong> <strong>species</strong> <strong>richness</strong>5Bottom temperature (°C)141210864CSWSNS1992 1994 1996 1998 2000 2002 2004 2006 2008aFish<strong>in</strong>g effortChanges <strong>in</strong> average <strong>fish</strong><strong>in</strong>g mortalities by area over<strong>the</strong> period 1992 to 2008 were calculated us<strong>in</strong>g <strong>the</strong> ma<strong>in</strong>demersal <strong>fish</strong>eries. The average <strong>fish</strong><strong>in</strong>g mortality of<strong>the</strong>se <strong>fish</strong>eries showed a significant decl<strong>in</strong>e <strong>in</strong> eacharea over <strong>the</strong> period 1992 to 2008 (CS: F 1,15 = 7.38, p =0.016; NS: F 1,15 = 185.25, p < 0.001; WS: F 1,15 = 33.51,p < 0.001; Fig. 2b).Fish<strong>in</strong>g mortality1.51.31.10.90.70.51992 1994 1996 1998 2000 2002 2004 2006 2008YearFig. 2. (a) Average w<strong>in</strong>ter bottom temperature and (b) average<strong>fish</strong><strong>in</strong>g mortality for major demersal <strong>species</strong> based on <strong>the</strong>ma<strong>in</strong> demersal <strong>fish</strong>eries <strong>in</strong> terms of effort <strong>in</strong> <strong>the</strong> North Sea(NS), Celtic Sea (CS), and west of Scotland (WS) for <strong>the</strong> period1992 to 2008. L<strong>in</strong>es <strong>in</strong>dicate significant trends (NS: dashed;CS: grey; WS: black)land (F 1,10 = 13.53, p = 0.004), while no trend wasobserved <strong>in</strong> <strong>the</strong> North Sea (F 1,10 = 0.06, p = 0.818) andCeltic Sea (F 1,9 = 3.51, p = 0.093; Fig. 3a–c). The <strong>richness</strong>of Lusitanian <strong>species</strong> significantly <strong>in</strong>creased <strong>in</strong><strong>the</strong> North Sea (F 1,10 = 19.68, p = 0.001) and Celtic Sea(F 1,9 = 17.50, p = 0.002), and did not show a significantchange west of Scotland (F 1,10 = 0.08, p = 0.780).Species <strong>richness</strong> versus temperatureSpecies <strong>richness</strong> was significantly positively correlatedto <strong>the</strong> 5 yr runn<strong>in</strong>g means <strong>in</strong> bottom temperature<strong>in</strong> <strong>the</strong> North Sea (r = 0.69, p = 0.012; Fig. 3d) and CelticSea (r = 0.78, p = 0.007; Fig. 3e), while a negative relationshipbetween <strong>species</strong> <strong>richness</strong> and temperaturewas found west of Scotland (r = –0.55, p = 0.059; Fig.3f). The <strong>richness</strong> of Boreal <strong>species</strong> was negatively correlatedwith temperature west of Scotland (r = –13.53,p = 0.004), while no relation was observed <strong>in</strong> <strong>the</strong> NorthSea (r = 0.06, p = 0.818) and <strong>in</strong> <strong>the</strong> Celtic Sea (r = 3.51,p = 0.093; Fig. 3d–f). The <strong>richness</strong> of Lusitanian <strong>fish</strong><strong>species</strong> was significantly positively related to bottomtemperature <strong>in</strong> <strong>the</strong> North Sea (r = 0.82, p = 0.001) andCeltic Sea (r = 0.75, p = 0.011), and did not have a relationwith bottom temperature west of Scotland (r =0.03, p = 0.906; Fig. 3d–f).bSpecies <strong>richness</strong> versus <strong>fish</strong><strong>in</strong>g effortSpecies <strong>richness</strong> was significantly negatively correlatedto <strong>the</strong> 6 yr runn<strong>in</strong>g means <strong>in</strong> average <strong>fish</strong><strong>in</strong>g mortality<strong>in</strong> <strong>the</strong> North Sea over <strong>the</strong> period 1997 to 2008 (r =–0.77, p = 0.003; Fig. 3g); no relationship was found <strong>in</strong><strong>the</strong> Celtic Sea (r = –0.49, p = 0.127; Fig. 3h), and a significantpositive relationship was found <strong>in</strong> <strong>the</strong> areawest of Scotland (r = 0.64, p = 0.025) (Fig. 3i). Tak<strong>in</strong>g<strong>in</strong>to consideration <strong>the</strong> biogeographical guild, for Boreal<strong>species</strong> a significant positive relationship between<strong>species</strong> <strong>richness</strong> and <strong>fish</strong><strong>in</strong>g mortality was found <strong>in</strong> <strong>the</strong>area west of Scotland (r = 0.77, p = 0.003), while norelationship was observed <strong>in</strong> <strong>the</strong> o<strong>the</strong>r areas (NS: r =–0.13, p = 0.695; CS: r = –0.28, p = 0.408; Fig. 3g–i). ForLusitanian <strong>species</strong>, <strong>species</strong> <strong>richness</strong> was negativelycorrelated to <strong>fish</strong><strong>in</strong>g mortality <strong>in</strong> <strong>the</strong> North Sea (r =–0.91, p < 0.001), while no relationship was found <strong>in</strong><strong>the</strong> Celtic Sea and west of Scotland (CS: r = –0.54, p =0.083; WS: r = 0.06, p = 0.850; Fig. 3g–i).DISCUSSIONW<strong>in</strong>ter bottom temperatures significantly <strong>in</strong>creased<strong>in</strong> <strong>the</strong> North Sea and west of Scotland dur<strong>in</strong>g <strong>the</strong>period 1993 to 2008, and <strong>in</strong> <strong>the</strong> Celtic Sea dur<strong>in</strong>g <strong>the</strong>period 1993 to 2006, which is <strong>in</strong> accordance withrecent f<strong>in</strong>d<strong>in</strong>gs of o<strong>the</strong>r studies of sea water temperatures<strong>in</strong> <strong>the</strong> Nor<strong>the</strong>ast Atlantic (e.g. MacKenzie &Schiedek 2007, Philippart et al. 2007, Hidd<strong>in</strong>k & terHofstede 2008). Sea surface temperatures <strong>in</strong>creasedcorrespond<strong>in</strong>gly <strong>in</strong> <strong>the</strong> areas. Although <strong>the</strong> observedregional <strong>in</strong>creases <strong>in</strong> temperature are consistent with<strong>the</strong> expected <strong>in</strong>crease due to global <strong>warm<strong>in</strong>g</strong>, <strong>the</strong>y aresubstantially higher than <strong>the</strong> <strong>in</strong>crease expected fromglobal climate change. This discrepancy is likelyrelated to <strong>the</strong> effect of regional processes, <strong>in</strong> particular<strong>the</strong> Atlantic Multidecadal Oscillation, which shifted toa warm phase dur<strong>in</strong>g our study period (Enfield et al.2001, 2010). Fur<strong>the</strong>rmore, regional climate-<strong>changes</strong>cenarios around <strong>the</strong> North Sea predict an <strong>in</strong>crease <strong>in</strong>air temperature of 2 to 3.5°C by <strong>the</strong> 2080s, and watertemperatures will also <strong>in</strong>crease, but not as rapidly as
6Mar Ecol Prog Ser 414: 1–9, 2010a908070605040302010NS1998 2000 2002 2004 2006 2008dAll Boreal Lusitanian90 NS80706050403020106 6.2 6.4 6.6 6.8 7 7.2g90 NS80706050403020100.6 0.7 0.8 0.9 1 1.1 1.2 1.3Species <strong>richness</strong>b9080706050403020CSe9080706050403020CSh9080706050403020CS101998 2000 2002 2004 2006 20081011 11.2 11.4 11.6 11.8 12 12.2100.6 0.7 0.8 0.9 1 1.1 1.2 1.3c908070605040302010WS1998 2000 2002 2004 2006 2008f9080706050403020WS108 8.2 8.4 8.6 8.8 9 9.2YearTemperature (°C)Fish<strong>in</strong>g mortalityFig. 3. Change <strong>in</strong> <strong>fish</strong> <strong>species</strong> <strong>richness</strong> over time (1997 to 2008) and with temperature. Species <strong>richness</strong> per year for All, Boreal,and Lusitanian <strong>fish</strong> <strong>species</strong> <strong>in</strong> <strong>the</strong> (a) North Sea (NS), (b) Celtic Sea (CS) and (c) west of Scotland (WS). Species <strong>richness</strong> for All,Boreal, and Lusitanian <strong>species</strong> versus <strong>the</strong> average bottom temperature over <strong>the</strong> previous 5 yr <strong>in</strong> (d) NS, (e) CS and (f) WS.Species <strong>richness</strong> for All, Boreal, and Lusitanian <strong>species</strong> versus <strong>the</strong> average <strong>fish</strong>ery mortality for major demersal <strong>species</strong> over <strong>the</strong>previous 6 yr <strong>in</strong> (g) NS, (h) CS and (i) WS. L<strong>in</strong>es <strong>in</strong>dicate significant correlations (All: black; Boreal: dashed; Lusitanian: grey)i9080706050403020WS100.6 0.7 0.8 0.9 1 1.1 1.2 1.3over land (e.g. Hulme et al. 2002). The fast regional<strong>warm<strong>in</strong>g</strong> as observed around <strong>the</strong> British Isles is likelydue to regional processes, not only global ones, andmay be attributed to a comb<strong>in</strong>ation of anthropogenicand natural <strong>in</strong>fluences (Stone et al. 2009).Our analyses showed a significant <strong>in</strong>crease <strong>in</strong> <strong>species</strong><strong>richness</strong> of mar<strong>in</strong>e <strong>fish</strong> <strong>in</strong> <strong>the</strong> North Sea dur<strong>in</strong>g <strong>the</strong> years1997 to 2008, and Celtic Sea over <strong>the</strong> period 1997 to2007, areas <strong>in</strong> which <strong>the</strong> water temperature had <strong>in</strong>creasedsignificantly dur<strong>in</strong>g <strong>the</strong> same period. In both <strong>the</strong>North and Celtic Seas, <strong>the</strong> positive change <strong>in</strong> <strong>species</strong><strong>richness</strong> is significantly related to <strong>the</strong>se higher watertemperatures, follow<strong>in</strong>g <strong>the</strong> expectations that mar<strong>in</strong>e<strong>fish</strong> <strong>species</strong> <strong>richness</strong> correlates positively with temperature(Macpherson 2002, Macpherson & Duarte 2006).However, <strong>in</strong> <strong>the</strong> area west of Scotland, a decrease <strong>in</strong> <strong>species</strong><strong>richness</strong> was observed, which also significantly correlatedto <strong>in</strong>creas<strong>in</strong>g water temperatures. Such f<strong>in</strong>d<strong>in</strong>gsare unexpected, but may be expla<strong>in</strong>ed when tak<strong>in</strong>g <strong>in</strong>toaccount <strong>the</strong> biogeographic aff<strong>in</strong>ity of <strong>fish</strong> <strong>species</strong>.In general, a <strong>warm<strong>in</strong>g</strong> environment is expected toresult <strong>in</strong> poleward advances of warm-favour<strong>in</strong>g Lusi-
ter Hofstede et al.: <strong>Regional</strong> <strong>warm<strong>in</strong>g</strong> <strong>changes</strong> <strong>fish</strong> <strong>species</strong> <strong>richness</strong>7tanian <strong>species</strong> and retreats of cold-favour<strong>in</strong>g Boreal<strong>species</strong> (Brander et al. 2003, Southward et al. 2005,Rijnsdorp et al. 2009). In <strong>the</strong> North and Celtic Seas,where bottom temperatures are ris<strong>in</strong>g, a significant<strong>in</strong>crease <strong>in</strong> Lusitanian <strong>species</strong> <strong>richness</strong> has been observed,and <strong>in</strong> both areas <strong>the</strong> <strong>in</strong>crease <strong>in</strong> Lusitanian<strong>species</strong> <strong>richness</strong> was found to be significantly relatedto bottom temperature. While Lusitanian <strong>species</strong> arethought to be positively affected by ris<strong>in</strong>g water temperatures,<strong>the</strong> opposite is expected for Boreal <strong>species</strong>.In <strong>the</strong> North and Celtic Seas, no trend <strong>in</strong> Boreal <strong>species</strong><strong>richness</strong> was observed. However, <strong>in</strong> <strong>the</strong> area west ofScotland, although no trend <strong>in</strong> Lusitanian <strong>species</strong> <strong>richness</strong>was observed, <strong>the</strong> <strong>richness</strong> of Boreal <strong>species</strong>showed a significant decrease dur<strong>in</strong>g <strong>the</strong> period 1997to 2008, and this decrease was found to be significantlycorrelated to <strong>the</strong> rise <strong>in</strong> water temperature. This strongdecl<strong>in</strong>e <strong>in</strong> Boreal <strong>species</strong> <strong>richness</strong> <strong>in</strong> <strong>the</strong> area west ofScotland, <strong>in</strong> comb<strong>in</strong>ation with <strong>the</strong> lack of a trend <strong>in</strong>Lusitanian <strong>species</strong> <strong>richness</strong>, expla<strong>in</strong>s <strong>the</strong> overall decl<strong>in</strong>e<strong>in</strong> <strong>species</strong> <strong>richness</strong> <strong>in</strong> this area <strong>in</strong> relation to<strong>in</strong>creas<strong>in</strong>g water temperatures.Temperature change <strong>in</strong>fluences <strong>the</strong> local <strong>species</strong>diversity by chang<strong>in</strong>g <strong>species</strong> distribution over shorttime scales, even <strong>in</strong>terannually (Fisher et al. 2008),which may expla<strong>in</strong> <strong>in</strong> our results <strong>the</strong> lack of a genericresponse to <strong>warm<strong>in</strong>g</strong> of <strong>the</strong> 3 local mar<strong>in</strong>e <strong>fish</strong> communities.Contrast<strong>in</strong>g responses <strong>in</strong> <strong>richness</strong> of mar<strong>in</strong>e <strong>fish</strong>to <strong>in</strong>creas<strong>in</strong>g water temperatures have also been foundaround Iceland over <strong>the</strong> period 1996 to 2007. Species<strong>richness</strong> <strong>in</strong>creased with temperature and time southwestof Iceland, but decreased nor<strong>the</strong>ast of <strong>the</strong> country(Stefansdottir et al. 2010). The difference <strong>in</strong> trendsillustrates <strong>the</strong> importance of perform<strong>in</strong>g analyses at<strong>the</strong> appropriate scale; however, no clear explanationsfor <strong>the</strong> observation were given, and it was only expectedthat both <strong>fish</strong>eries and <strong>the</strong> functional characteristicsof <strong>the</strong> ecosystem, such as food-web <strong>in</strong>teractions,are <strong>the</strong> ma<strong>in</strong> causal factors of <strong>the</strong> different trends <strong>in</strong><strong>richness</strong> with<strong>in</strong> <strong>the</strong> Icelandic <strong>fish</strong> community.The fact that <strong>the</strong> relationship between climate andmar<strong>in</strong>e life is difficult to generalise is also illustrated bya comparison of <strong>the</strong> planktonic assemblage <strong>in</strong> relationto hydroclimatic features among 3 different Europeanseas (Beaugrand et al. 2000): A strong negative relationshipbetween <strong>the</strong> abundance of plankton and airtemperature was found <strong>in</strong> <strong>the</strong> English Channel; it wasweaker <strong>in</strong> <strong>the</strong> Celtic Sea and no relationship was found<strong>in</strong> <strong>the</strong> Bay of Biscay. The observed differences wereattributed to variation <strong>in</strong> <strong>the</strong> local physical environmentand <strong>the</strong> biological composition of <strong>the</strong> regions(Beaugrand et al. 2000).Changes <strong>in</strong> <strong>the</strong> structure of <strong>fish</strong> communities areoften considered to be <strong>fish</strong>eries-<strong>in</strong>duced (e.g. Pauly etal. 1998, Lev<strong>in</strong> et al. 2006), and <strong>fish</strong>eries may haveplayed a role <strong>in</strong> <strong>the</strong> observed <strong>changes</strong> <strong>in</strong> <strong>the</strong> <strong>fish</strong> communities<strong>in</strong> <strong>the</strong> North Sea, Celtic Sea, and <strong>the</strong> areawest of Scotland. The <strong>in</strong>tensive exploitation of <strong>fish</strong>communities often leads to substantial reductions <strong>in</strong><strong>the</strong> abundance of target <strong>species</strong>, <strong>in</strong> particular <strong>the</strong>larger predatory <strong>species</strong>, and <strong>changes</strong> <strong>in</strong> <strong>species</strong> composition(Greenstreet & Hall 1996, Rice & Gislason1996, Daan et al. 2005).Fish<strong>in</strong>g will alter <strong>fish</strong> communities by remov<strong>in</strong>g<strong>species</strong> with a high longevity and a large body size(Genner et al. 2010), <strong>the</strong>reby <strong>in</strong>creas<strong>in</strong>g <strong>the</strong> opportunitiesfor smaller-sized <strong>species</strong> to <strong>in</strong>vade <strong>the</strong> area, amplify<strong>in</strong>g<strong>the</strong> positive circumstances for <strong>the</strong> generally smallLusitanian <strong>species</strong> <strong>in</strong> times of global <strong>warm<strong>in</strong>g</strong>.Recent studies have argued that <strong>changes</strong> <strong>in</strong> mar<strong>in</strong>e<strong>fish</strong> communities are likely to be caused by <strong>the</strong> <strong>in</strong>teract<strong>in</strong>geffects of climate change and <strong>fish</strong>eries, ra<strong>the</strong>rthan by ei<strong>the</strong>r of <strong>the</strong>se drivers separately or by simpleadditive effects (e.g. Perry et al. 2010, Planque et al.2010). Climate is chang<strong>in</strong>g globally, and it is likely thatan <strong>in</strong>crease <strong>in</strong> temperature is contribut<strong>in</strong>g to <strong>the</strong> <strong>in</strong>crease<strong>in</strong> Lusitanian <strong>species</strong> or <strong>the</strong> decrease <strong>in</strong> Boreal<strong>species</strong>. However, <strong>fish</strong><strong>in</strong>g activities often develop concurrently,mak<strong>in</strong>g it hard to disentangle <strong>the</strong>ir effectfrom climate change. For example, Daan (2006) arguedthat although climate change may have had add-oneffects, an <strong>in</strong>crease <strong>in</strong> <strong>species</strong> <strong>richness</strong> <strong>in</strong> <strong>the</strong> NorthSea <strong>in</strong> <strong>the</strong> period 1977 to 2005 was an <strong>in</strong>direct effectof overexploitation. The decrease <strong>in</strong> larger predatory<strong>species</strong> was considered to allow smaller prey <strong>species</strong> to<strong>in</strong>crease <strong>in</strong> abundance due to a reduction <strong>in</strong> predationmortality and/or competition. In our study areas, <strong>fish</strong><strong>in</strong>gmortality of <strong>the</strong> ma<strong>in</strong> demersal <strong>fish</strong> <strong>species</strong> decreasedover <strong>the</strong> period 1992 to 2008 (Fig. 2b). Theobserved <strong>in</strong>crease <strong>in</strong> <strong>species</strong> <strong>richness</strong> <strong>in</strong> <strong>the</strong> Celtic andNorth Seas co<strong>in</strong>cided with a decrease <strong>in</strong> <strong>fish</strong><strong>in</strong>g effort,contradict<strong>in</strong>g Daan (2006). In fact, we observed norelationship between trends <strong>in</strong> <strong>species</strong> <strong>richness</strong> and<strong>fish</strong><strong>in</strong>g mortality <strong>in</strong> <strong>the</strong> Celtic Sea, and even a significantnegative relationship was shown <strong>in</strong> <strong>the</strong> North Sea,both for <strong>the</strong> overall and Lusitanian <strong>species</strong> <strong>richness</strong>.The <strong>in</strong>crease <strong>in</strong> Lusitanian <strong>species</strong> <strong>richness</strong> is lesslikely to have been caused by a decrease <strong>in</strong> <strong>fish</strong>eries,s<strong>in</strong>ce <strong>the</strong> opposite would be expected, mean<strong>in</strong>g an<strong>in</strong>crease <strong>in</strong> <strong>fish</strong>eries would favour small-sized <strong>fish</strong>(Genner et al. 2010), and on average Lusitanian <strong>species</strong>are smaller than Boreal <strong>species</strong>. In <strong>the</strong> area west ofScotland, we observed a positive relation between <strong>species</strong><strong>richness</strong> (overall and Boreal) and <strong>fish</strong><strong>in</strong>g mortality,mean<strong>in</strong>g that <strong>the</strong> decrease <strong>in</strong> overall and Boreal <strong>species</strong><strong>richness</strong> may have been driven by <strong>the</strong> decl<strong>in</strong>e <strong>in</strong><strong>fish</strong><strong>in</strong>g mortality. Therefore, besides <strong>the</strong> relationship of<strong>species</strong> <strong>richness</strong> with <strong>in</strong>creas<strong>in</strong>g bottom temperatures,<strong>fish</strong>eries may also have had effects on <strong>the</strong> <strong>richness</strong> ofmar<strong>in</strong>e <strong>fish</strong> <strong>in</strong> <strong>the</strong> area west of Scotland. However,
8Mar Ecol Prog Ser 414: 1–9, 2010notwithstand<strong>in</strong>g <strong>the</strong> observations <strong>in</strong> <strong>the</strong> area west ofScotland, our f<strong>in</strong>d<strong>in</strong>gs support <strong>the</strong> idea that <strong>the</strong>observed <strong>changes</strong> <strong>in</strong> <strong>species</strong> <strong>richness</strong> <strong>in</strong> <strong>the</strong> North andCeltic Seas are likely to be more strongly climate driventhan <strong>fish</strong>eries <strong>in</strong>duced. This would be <strong>in</strong> l<strong>in</strong>e with<strong>the</strong> observations <strong>in</strong> o<strong>the</strong>r taxa throughout <strong>the</strong> world,viz. that as temperature rises, <strong>species</strong> <strong>richness</strong> <strong>in</strong>creasesdue a positive correlation between <strong>richness</strong>and temperature observed along latitud<strong>in</strong>al gradients.Such <strong>in</strong>creases have been reported for a variety ofcommunities <strong>in</strong>clud<strong>in</strong>g terrestrial taxa, such as plants(Klanderud & Birks 2003), birds (La Sorte et al. 2009)and butterflies (Menéndez et al. 2006), for all of whichrecent climatic change is considered to be <strong>the</strong> mostlikely major driv<strong>in</strong>g factor. In <strong>the</strong> mar<strong>in</strong>e environment,for example, long-term <strong>changes</strong> <strong>in</strong> <strong>species</strong> compositionand diversity of <strong>the</strong> copepod community have beenrelated to hydroclimatic <strong>changes</strong> <strong>in</strong> <strong>the</strong> Nor<strong>the</strong>astAtlantic, <strong>in</strong> particular to <strong>the</strong> variation <strong>in</strong> decadal oscillations(Beaugrand 2003). Dur<strong>in</strong>g <strong>the</strong> positive phase of<strong>the</strong> North Atlantic Oscillation, which occurred <strong>in</strong> <strong>the</strong>1990s, sea temperatures <strong>in</strong>creased, and <strong>the</strong> planktoncommunity of <strong>the</strong> temperate waters was replaced by asou<strong>the</strong>rn community.It is generally accepted that major <strong>changes</strong> haveoccurred <strong>in</strong> <strong>the</strong> <strong>fish</strong> communities of <strong>the</strong> Nor<strong>the</strong>astAtlantic dur<strong>in</strong>g recent decades (e.g. Pauly et al. 1998,Attrill & Power 2002). Assum<strong>in</strong>g that <strong>the</strong> sea temperature<strong>warm<strong>in</strong>g</strong> rates will follow <strong>the</strong> global consensusview of <strong>warm<strong>in</strong>g</strong> (Kerr 2004), <strong>the</strong> general polewarddecl<strong>in</strong>e <strong>in</strong> <strong>species</strong> <strong>richness</strong> will decrease (Fisher et al.2008), and regionally <strong>the</strong> recent observed <strong>in</strong>creases <strong>in</strong><strong>fish</strong> <strong>species</strong> <strong>richness</strong> <strong>in</strong> <strong>the</strong> North and Celtic Seas willcont<strong>in</strong>ue. Such <strong>changes</strong> <strong>in</strong> <strong>species</strong> biogeography,<strong>in</strong>clud<strong>in</strong>g <strong>the</strong> change <strong>in</strong> composition of <strong>the</strong> <strong>fish</strong> communities(fewer Boreal and more Lusitanian <strong>species</strong>),will undoubtedly have implications for commercial<strong>fish</strong>eries and on <strong>the</strong> implementation of effective conservationand environmental monitor<strong>in</strong>g strategies.Acknowledgements. This study was carried out as part of <strong>the</strong>European Union FP6 project RECLAIM (Contract 044133).We acknowledge <strong>the</strong> International Council for <strong>the</strong> Explorationof <strong>the</strong> Sea (ICES) for supply<strong>in</strong>g data from <strong>the</strong> ICEShydrographic database and from <strong>the</strong> database for trawl surveys(DATRAS), and N. H<strong>in</strong>tzen for assist<strong>in</strong>g <strong>in</strong> <strong>in</strong>terpolat<strong>in</strong>g<strong>the</strong> temperature datasets. Comments provided by 3 anonymousreferees helped to improve <strong>the</strong> quality of <strong>the</strong> manuscript.LITERATURE CITEDAttrill MJ, Power AJ (2002) Climatic <strong>in</strong>fluence on a mar<strong>in</strong>e<strong>fish</strong> assemblage. Nature 417:275–278Beaugrand G (2003) Long-term <strong>changes</strong> <strong>in</strong> copepod abundanceand diversity <strong>in</strong> <strong>the</strong> north-east Atlantic <strong>in</strong> relationto fluctuations <strong>in</strong> <strong>the</strong> hydroclimatic environment. FishOceanogr 12:270–283Beaugrand G, Ibañez F, Reid PC (2000) Spatial, seasonal andlong-term fluctuations of plankton <strong>in</strong> relation to hydroclimaticfeatures <strong>in</strong> <strong>the</strong> English Channel, Celtic Sea andBay of Biscay. Mar Ecol Prog Ser 200:93–102Blanchard JL, Dulvy NK, Jenn<strong>in</strong>gs S, Ellis JR, P<strong>in</strong>negar JK,Tidd A, Kell LT (2005) Do climate and <strong>fish</strong><strong>in</strong>g <strong>in</strong>fluencesize-based <strong>in</strong>dicators of Celtic Sea <strong>fish</strong> community structure?ICES J Mar Sci 62:405–411Brander K, Blom G, Borges MF, Erz<strong>in</strong>i K and o<strong>the</strong>rs (2003)Changes <strong>in</strong> <strong>fish</strong> distribution <strong>in</strong> <strong>the</strong> <strong>eastern</strong> North Atlantic:Are we see<strong>in</strong>g a coherent response to chang<strong>in</strong>g temperature?ICES Mar Sci Symp 219:261–270Cheung WWL, Lam VWY, Sarmiento JL, Kearny K, Watson R,Pauly D (2009) Project<strong>in</strong>g global mar<strong>in</strong>e biodiversityimpacts under climate change senarios. Fish Fish 10:235–251Daan N (2006) Spatial and temporal trends <strong>in</strong> <strong>species</strong> <strong>richness</strong>and abundance for <strong>the</strong> sou<strong>the</strong>rly and nor<strong>the</strong>rly componentsof <strong>the</strong> North Sea <strong>fish</strong> community separately, basedon IBTS data 1977–2005. ICES CM 2006/D:02. ICES,CopenhagenDaan N, Gislason H, Pope JG, Rice JC (2005) Changes <strong>in</strong> <strong>the</strong>North Sea <strong>fish</strong> community: evidence of <strong>in</strong>direct <strong>fish</strong><strong>in</strong>g?ICES J Mar Sci 62:177–188Daufresne M, Boet P (2007) Climate change impacts on structureand diversity of <strong>fish</strong> communities <strong>in</strong> rivers. GlobChange Biol 13:2467–2478Daufresne M, Roger MC, Capra H, Lamouroux N (2004)Long-term <strong>changes</strong> with<strong>in</strong> <strong>the</strong> <strong>in</strong>vertebrate and <strong>fish</strong> communitiesof <strong>the</strong> Upper Rhône River: effects of climaticfactors. Glob Change Biol 10:124–140Dulvy NK, Rogers SI, Jenn<strong>in</strong>gs S, Stelzenmüller V, Dye SR,Sjkoldal HR (2008) Climate change and deepen<strong>in</strong>g of <strong>the</strong>North Sea <strong>fish</strong> assemblage: a biotic <strong>in</strong>dicator of <strong>warm<strong>in</strong>g</strong>seas. J Appl Ecol 45:1029–1039Ellis JR, Engelhard GH, P<strong>in</strong>negar JK (2010) Ecotypes. In:Rijnsdorp AD, Peck MA, Engelhard GH, Möllmann C, P<strong>in</strong>negarJK (eds) Resolv<strong>in</strong>g climate impacts on <strong>fish</strong> stocks.ICES Coop Res Rep 301, ICES, Copenhagen, p 10–20Enfield DB, Cid-Serrano L (2010) Secular and multidecadal<strong>warm<strong>in</strong>g</strong>s <strong>in</strong> <strong>the</strong> North Atlantic and <strong>the</strong>ir relationshipswith major hurricane activity. Int J Climatol 30:174–184Enfield DB, Mestas-Nunez AM, Trimble PJ (2001) TheAtlantic Multidecadal Oscillation and its relationship tora<strong>in</strong>fall and river flows <strong>in</strong> <strong>the</strong> cont<strong>in</strong>ental U.S. GeophysRes Lett 28:2077–2080Fisher JAD, Frank KT, Petrie B, Leggett WC, Shackell NL(2008) Temporal dynamics with<strong>in</strong> a contemporary latitud<strong>in</strong>aldiversity gradient. Ecol Lett 11:883–897Froese R, Pauly D (eds) (2009) FishBase. www.<strong>fish</strong>base.orgGenner MJ, Sims DW, Southward AJ, Budd GC and o<strong>the</strong>rs(2010) Body size-dependent responses of a mar<strong>in</strong>e <strong>fish</strong>assemblage to climate change and <strong>fish</strong><strong>in</strong>g over a centurylongscale. Glob Change Biol 16:517–527Greenstreet SPR, Hall SJ (1996) Fish<strong>in</strong>g and <strong>the</strong> ground-<strong>fish</strong>assemblage structure <strong>in</strong> <strong>the</strong> north-western North Sea: ananalysis of long-term and spatial trends. Glob Change Biol65:577–598Heessen HJL, Dalskov J, Cook RM (1997) The <strong>in</strong>ternationalbottom trawl survey <strong>in</strong> <strong>the</strong> North Sea, <strong>the</strong> Skagerrak andKattegat. ICES CM 1997/Y:31. ICES, CopenhagenHenderson PA (2007) Discrete and cont<strong>in</strong>uous change <strong>in</strong> <strong>the</strong><strong>fish</strong> community of <strong>the</strong> Bristol Channel <strong>in</strong> response to climatechange. J Mar Biol Assoc UK 87:589–598Hidd<strong>in</strong>k JG, ter Hofstede R (2008) Climate <strong>in</strong>duced <strong>in</strong>creases<strong>in</strong> <strong>species</strong> <strong>richness</strong> of mar<strong>in</strong>e <strong>fish</strong>es. Glob Change Biol14:453–460
ter Hofstede et al.: <strong>Regional</strong> <strong>warm<strong>in</strong>g</strong> <strong>changes</strong> <strong>fish</strong> <strong>species</strong> <strong>richness</strong>9Hulme M, Jenk<strong>in</strong>s GL, Lu X, Turnpenny JR and o<strong>the</strong>rs (2002)Climate change scenarios for <strong>the</strong> United K<strong>in</strong>gdom: <strong>the</strong>UKCIP02 scientific report. Tyndall Centre for ClimateChange Research, School of Environmental Sciences, Universityof East Anglia, NorwichICES (International Council for <strong>the</strong> Exploration of <strong>the</strong> Sea)(2002) Manual for <strong>the</strong> International Bottom Trawl Surveys<strong>in</strong> <strong>the</strong> western and sou<strong>the</strong>rn areas. Revision II. Addendumto Report of <strong>the</strong> International Bottom Trawl Survey Work<strong>in</strong>gGroup (IBTSWG). ICES CM2002/D:03. ICES, CopenhagenICES (2006) Manual for <strong>the</strong> International Bottom Trawl Surveys.Revision VII. Addendum to Report of <strong>the</strong> InternationalBottom Trawl Survey Work<strong>in</strong>g Group (IBTSWG).ICES CM 2006/RCM:03. ICES, CopenhagenICES (2008a) Report of <strong>the</strong> International Bottom Trawl SurveyWork<strong>in</strong>g Group (IBTSWG), 31 March – 4 April 2008, Vigo,Spa<strong>in</strong>. ICES CM 2008 RMC:02. ICES, CopenhagenICES (2008b) Report of <strong>the</strong> Work<strong>in</strong>g Group on <strong>the</strong> Assessmentof Nor<strong>the</strong>rn Shelf Demersal Stock (WGNSDS), 15–21 May2008, Copenhagen, Denmark. ICES CM 2008/ACOM:08.ICES, CopenhagenICES (2009) Report of <strong>the</strong> Work<strong>in</strong>g Group on <strong>the</strong> Assessmentof Demersal Stocks <strong>in</strong> <strong>the</strong> North Sea and Skagerrak(WGNSSK), 6–12 May 2009, ICES Headquarters, Copenhagen.ICES CM 2009/ACOM:10. ICES, CopenhagenKerr RA (2004) Three degrees of consensus. Science 305:932–934Klanderud K, Birks HJB (2003) Recent <strong>in</strong>creases <strong>in</strong> <strong>species</strong><strong>richness</strong> and shifts <strong>in</strong> altitud<strong>in</strong>al distributions of Norwegianmounta<strong>in</strong> plants. Holocene 13:1–6La Sorte FA, Lee TM, Wilman H, Jetz W (2009) Disparitiesbetween observed and predicted impacts of climatechange on w<strong>in</strong>ter bird assemblages. Proc Biol Sci 276:3167–3174Lev<strong>in</strong> PS, Holmes EE, P<strong>in</strong>er KR, Harvey CJ (2006) Shifts <strong>in</strong> aPacific Ocean <strong>fish</strong> assemblage: <strong>the</strong> potential <strong>in</strong>fluence ofexploitation. Conserv Biol 20:1181–1190MacKenzie BR, Schiedek D (2007) Daily ocean monitor<strong>in</strong>gs<strong>in</strong>ce <strong>the</strong> 1860s shows record <strong>warm<strong>in</strong>g</strong> of nor<strong>the</strong>rn Europeanseas. Glob Change Biol 13:1335–1347Macpherson E (2002) Large-scale <strong>species</strong>-<strong>richness</strong> gradients<strong>in</strong> <strong>the</strong> Atlantic Ocean. Proc Biol Sci 269:1715–1720Macpherson E, Duarte CM (2006) Patterns <strong>in</strong> <strong>species</strong> <strong>richness</strong>,size, and latitud<strong>in</strong>al range of East Atlantic <strong>fish</strong>es.Ecography 17:242–248Maxwell D, Jenn<strong>in</strong>gs S (2005) Power of monitor<strong>in</strong>g programmesto detect decl<strong>in</strong>e and recovery of rare and vulnerable<strong>fish</strong>. J Appl Ecol 42:25–37Menéndez R, Megías AG, Hill JK, Braschler B and o<strong>the</strong>rs(2006) Species <strong>richness</strong> <strong>changes</strong> lag beh<strong>in</strong>d climatechange. Proc Biol Sci 273:1465–1470Nye JA, L<strong>in</strong>k JS, Hare JA, Overholtz WJ (2009) Chang<strong>in</strong>gspatial distribution of <strong>fish</strong> stocks <strong>in</strong> relation to climate andpopulation size on <strong>the</strong> Nor<strong>the</strong>ast United States cont<strong>in</strong>entalshelf. Mar Ecol Prog Ser 393:111–129Parmesan C, Yohe G (2003) A globally coherent f<strong>in</strong>gerpr<strong>in</strong>t ofclimate change impacts across natural systems. Nature421:37–42Pauly D, Christensen V, Dalsgaard J, Froese R, Torres F(1998) Fish<strong>in</strong>g down mar<strong>in</strong>e food webs. Science 279:860–863Perry AL, Low PJ, Ellis JR, Reynolds JD (2005) Climatechange and distribution shifts <strong>in</strong> mar<strong>in</strong>e <strong>fish</strong>es. ScienceEditorial responsibility: Konstant<strong>in</strong>os Stergiou,Thessaloniki, Greece308:1912–1915Perry RI, Cury P, Brander K, Jenn<strong>in</strong>gs S, Mollmann C,Planque B (2010) Sensitivity of mar<strong>in</strong>e systems to climateand <strong>fish</strong><strong>in</strong>g: concepts, issues and management responses.J Mar Syst 79:427–435Petchey OL, McPhearson PT, Casey TM, Mor<strong>in</strong> PJ (1999)Environmental <strong>warm<strong>in</strong>g</strong> alters food-web structure andecosystem function. Nature 402:69–72Philippart CJM, Anadón R, Danovaro R, Dippner JW ando<strong>the</strong>rs (2007) Impacts of climate change on <strong>the</strong> Europeanmar<strong>in</strong>e and coastal environment. Mar<strong>in</strong>e Board ESF PositionPaper 9, Mar<strong>in</strong>e Science Foundation, StrassbourgPlanque B, Froment<strong>in</strong> JM, Cury P, Dr<strong>in</strong>kwater KF, Jenn<strong>in</strong>g S,Perry RI, Kifani S (2010) How does <strong>fish</strong><strong>in</strong>g alter mar<strong>in</strong>epopulations and ecosystems sensitivity to climate? J MarSyst 79:403–417Pyper BJ, Peterman RM (1998) Comparison of methods toaccount for autocorrelation <strong>in</strong> correlation analyses of <strong>fish</strong>data. Can J Fish Aquat Sci 55:2127–2140Rice J, Gislason H (1996) Patterns of change <strong>in</strong> <strong>the</strong> size spectraof numbers and diversity of <strong>the</strong> North Sea <strong>fish</strong> assemblage,as reflected <strong>in</strong> surveys and models. ICES J Mar Sci53:1214–1225Rijnsdorp AD, Peck MA, Engelhard GH, Möllmann C, P<strong>in</strong>negarJK (2009) Resolv<strong>in</strong>g <strong>the</strong> effect of climate change on<strong>fish</strong> populations. ICES J Mar Sci 66:1570–1583Root TL, Price JT, Hall KR, Schneider SH, Rosenzweig C,Pounds A (2003) F<strong>in</strong>gerpr<strong>in</strong>ts of global <strong>warm<strong>in</strong>g</strong> on wildanimals and plants. Nature 421:57–60Southward AJ, Langmead O, Hardman-Mountford NJ, AikenJ and o<strong>the</strong>rs (2005) Long-term oceanographic and ecologicalresearch <strong>in</strong> <strong>the</strong> western English Channel. Adv MarBiol 47:1–105Stefansdottir L, Solmundsson J, Marte<strong>in</strong>sdottir G, Krist<strong>in</strong>ssonKN, Jonasson JP (2010) Ground<strong>fish</strong> <strong>species</strong> diversity andassemblage structure <strong>in</strong> Icelandic waters dur<strong>in</strong>g recentyears of <strong>warm<strong>in</strong>g</strong>. Fish Oceanogr 19:42–62Stone DA, Allen MR, Stott PA, Pall P, M<strong>in</strong> S, Nozawa T, YukimotoS (2009) The detection and attribution of human<strong>in</strong>fluence on climate. Annu Rev Environ Resour 34:1–16ter Hofstede R, Daan N (2008) A proposal for a consistent useof <strong>the</strong> North sea IBTS data. ICES CM 2008/R:25. ICES,CopenhagenThomas CD, Cameron A, Green, RE, Bakkenes M and o<strong>the</strong>rs(2004) Ext<strong>in</strong>ction risk from climate change. Nature 427:145–148Thomas CD, Franco AMA, Hill JK (2006) Range retractionsand ext<strong>in</strong>ction <strong>in</strong> <strong>the</strong> face of climate <strong>warm<strong>in</strong>g</strong>. Trends EcolEvol 21:415–416Trenkel VM, P<strong>in</strong>negar JK, Rochet MJ, Rackham BD (2004)Different surveys provide similar pictures of trends <strong>in</strong> amar<strong>in</strong>e <strong>fish</strong> community but not of <strong>in</strong>dividual <strong>fish</strong> populations.ICES J Mar Sci 61:351–362Wal<strong>the</strong>r GR, Post E, Convey P, Menzel A and o<strong>the</strong>rs (2002)Ecological responses to recent climate change. Nature416:389–395Wheeler A (1992) A list of <strong>the</strong> common and scientific names of<strong>fish</strong>es of <strong>the</strong> British Isles. J Fish Biol 41 (Suppl A):1–37Wheeler AC, Merrett NR, Quigley DTG (2004) Additionalrecords and notes for Wheeler’s (1992) List of <strong>the</strong> commonand scientific names of <strong>fish</strong>es of <strong>the</strong> British Isles. J Fish Biol65 (Suppl 2):1–40Yang J (1982) The dom<strong>in</strong>ant <strong>fish</strong> fauna <strong>in</strong> <strong>the</strong> North Sea andits determ<strong>in</strong>ation. J Fish Biol 20:635–643Submitted: March 17, 2010; Accepted: July 28, 2010Proofs received from author(s): August 20, 2010


