Final Practice Problems (ANOVA and Logistic Regression)
Final Practice Problems (ANOVA and Logistic Regression)
Final Practice Problems (ANOVA and Logistic Regression)

Create successful ePaper yourself
Turn your PDF publications into a flip-book with our unique Google optimized e-Paper software.
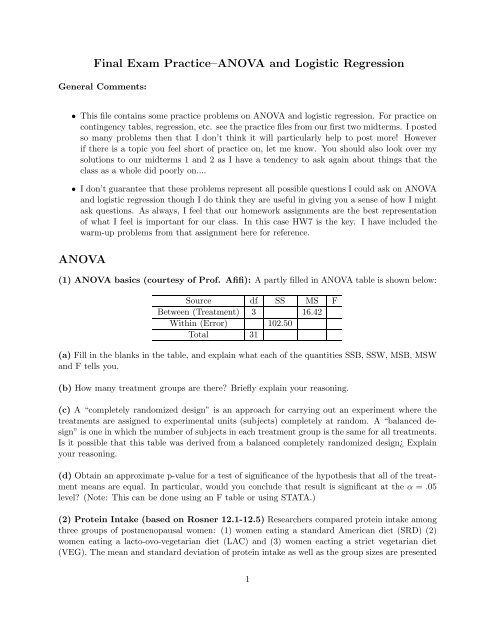
<strong>Final</strong> Exam <strong>Practice</strong>–<strong>ANOVA</strong> <strong>and</strong> <strong>Logistic</strong> <strong>Regression</strong>General Comments:• This file contains some practice problems on <strong>ANOVA</strong> <strong>and</strong> logistic regression. For practice oncontingency tables, regression, etc. see the practice files from our first two midterms. I postedso many problems then that I don’t think it will particularly help to post more! Howeverif there is a topic you feel short of practice on, let me know. You should also look over mysolutions to our midterms 1 <strong>and</strong> 2 as I have a tendency to ask again about things that theclass as a whole did poorly on....• I don’t guarantee that these problems represent all possible questions I could ask on <strong>ANOVA</strong><strong>and</strong> logistic regression though I do think they are useful in giving you a sense of how I mightask questions. As always, I feel that our homework assignments are the best representationof what I feel is important for our class. In this case HW7 is the key. I have included thewarm-up problems from that assignment here for reference.<strong>ANOVA</strong>(1) <strong>ANOVA</strong> basics (courtesy of Prof. Afifi): A partly filled in <strong>ANOVA</strong> table is shown below:Source df SS MS FBetween (Treatment) 3 16.42Within (Error) 102.50Total 31(a) Fill in the blanks in the table, <strong>and</strong> explain what each of the quantities SSB, SSW, MSB, MSW<strong>and</strong> F tells you.(b) How many treatment groups are there? Briefly explain your reasoning.(c) A “completely r<strong>and</strong>omized design” is an approach for carrying out an experiment where thetreatments are assigned to experimental units (subjects) completely at r<strong>and</strong>om. A “balanced design”is one in which the number of subjects in each treatment group is the same for all treatments.Is it possible that this table was derived from a balanced completely r<strong>and</strong>omized design¿ Explainyour reasoning.(d) Obtain an approximate p-value for a test of significance of the hypothesis that all of the treatmentmeans are equal. In particular, would you conclude that result is significant at the α = .05level? (Note: This can be done using an F table or using STATA.)(2) Protein Intake (based on Rosner 12.1-12.5) Researchers compared protein intake amongthree groups of postmenopausal women: (1) women eating a st<strong>and</strong>ard American diet (SRD) (2)women eating a lacto-ovo-vegetarian diet (LAC) <strong>and</strong> (3) women eacting a strict vegetarian diet(VEG). The mean <strong>and</strong> st<strong>and</strong>ard deviation of protein intake as well as the group sizes are presented1
in the table below. Use then to answer the following questions:Group Mean SD Number in groupSTD 75 9 10LAC 57 13 10VEG 47 17 6(a) Perform an overall F test to determine whether there is a significant difference in mean proteinintake between the three groups. Be sure you an state the null <strong>and</strong> alternative hypotheses bothmathematically <strong>and</strong> in words, compute the test statistic by h<strong>and</strong>, get an approximate p-value, <strong>and</strong>explain your real-world conclusions.(b) Obtain 95% confidence intervals for each of the group means. Which groups appear differentfrom one another?(c) Repeat part (b) using pairwise CIs <strong>and</strong> hypothesis tests for whether there are differences inmean protein intake.(d) How would your answers to (c) change if you used the Bonferroni procedure to adjust for thefact that you are performing multiple comparisons (i.e. obtain simultaneous 95% CIs for the means<strong>and</strong> explain how the conclusions to your hypothesis tests would change if at all.)(e) Suppose that you wanted to compare average protein intake on the two vegetarian diets to theprotein intake on the non-vegetarian diet. Explain what contrast you would use to check whetherthese two means are different from one another <strong>and</strong> carry out the appropriate procedure usingeither a CI or hypothesis test.(f) Now suppose that in the general population 70% of vegetarians are lacto-ovo vegetarians whereas30% are strict vegetarians. Perform a statistical procedure to test if the contrast L = .7Ȳ2+.3Ȳ3−Ȳ1is significantly different from 0. What does this contrast mean?(g) Write down the estimated equation you would get if you did this <strong>ANOVA</strong> as a regression withVEG as the reference group. Briefly explain your reasoning.(3) It is widely believed that there are disparities in income between different ethnic groups. Astatistician decides to test this theory by performing an Analysis of Variance. Her STATA printoutis given below along with a table of group means, st<strong>and</strong>ard deviations, <strong>and</strong> a sketch of individualconfidence intervals. Use this to answer the following questions..oneway Income EthnicityAnalysis of VarianceSource SS df MS F Prob > F2
------------------------------------------------------------------------Between groups 13921 3 4640 45.63 0.000Within groups 40272 396 102------------------------------------------------------------------------Total 54193 399Individual 95% CIs For Mean Based onPooled StDevEthnicity N Mean StDev ------+---------+---------+---------+---White 100 67.85 10.84 (---*---)Black 100 60.83 10.70 (---*---)Hispanic 100 59.07 8.53 (---*---)Asian 100 73.90 10.10 (---*---)------+---------+---------+---------+---60.0 65.0 70.0 75.0(a) How many people were included in this study? Explain your reasoning.(b) What fraction of the variability in income is explained by ethnicity? Show your work.(c) State the overall null <strong>and</strong> alternative hypotheses the statistician is testing, both mathematically<strong>and</strong> in words, give the p-value, the test statistic, <strong>and</strong> your real-world conclusions.(d) Based on the printout <strong>and</strong> the accompanying plot, rank the different ethinic groups from highestto lowest income. If multiple groups may have the same income you should indicate this.(e) To do part (d) correctly, you should really do CIs or tests for the difference in means betweentwo groups. Do this analysis to compare the White <strong>and</strong> Black groups <strong>and</strong> explain your findings.(f) To compare all possible pairs of ethnicities would involve multiple testing. What significancelevel α ∗ would the Bonferroni procedure suggest you use to do all possible comparisons of twogroups if you wanted your overall significance level to be α = .05? At this level could you stillbe confident that your results from part (e) for the White <strong>and</strong> Black ethnic groups were correct?Explain.(g) Suppose you wanted to check wither incomes for whites were different from those for otherethnic groups. Write down the linear combination you would use to test this. (Do not worry aboutadjusting for relative population eprcentages of the different ethnic groups though in practice thiswould be an issue). Use either a CI or a hypothesis test to determine whether whites are indeeddifferent from other ethnic groups in terms of income.(h) Suppose we had done this problem as a regression with blacks as the reference group. Writedown the corresponding regression equation.Extra <strong>Practice</strong>–solutions not given Check that you know how to use the group measn <strong>and</strong>st<strong>and</strong>ard deviations to fill in the <strong>ANOVA</strong> table.3
<strong>Logistic</strong> <strong>Regression</strong>(4) Cardiovascular Disease (Based on Rosner 13.58-61): Sudden death is an important,lethal cardiovascular endpoint. Most previous studies of risk factors for sudden death have focusedon men. Looking at this issue for women is important as well. For this purpose, data were usedfrom the Framingham Heart Study. Several potential risk factors, such as age, blood pressure <strong>and</strong>cigarette smoking are of interest <strong>and</strong> need to be controlled for smilutaneously. Therefore a multiplelogistic regression was fitted to these data as shown below. The response is 2-year incidence ofsudden death in females without prior coronary heart disease.Risk Factor <strong>Regression</strong> Coefficient (b j ) St<strong>and</strong>ard Error (se(b j ))Constant -15.3Blood Pressure (mm Hg) .0019 .0070Weight (% of study mean) -.0060 .0100Cholesterol (mg/100 mL) .0056 .0029Glucose (mg/100 mL) .0066 .0038Smoking (cigarettes/day) .0069 .0199Hematocrit (%) .111 .049Vital capacity (centiliters) -.0098 .0036Age (years) .0686 .0225(a) Assess the statistical significance of the individual risk factors <strong>and</strong> explain the practical implicationsof your findings.(b) Give brief interpretations of the age <strong>and</strong> vital capacity coefficients.(c) Compute the odds ratios relating the additional risk of sudden death associated with (i) a100-centiliter decrease in vital capacity <strong>and</strong> (ii) an additional year of age after adjusting for theother risk factors.(d) Provide 95% confidence intervals for the odds ratios in part (c)(e) Predict the probability of sudden death for a 50 year old woman with systolic blood pressureof 120 mmHg, a relative weight of 100% a cholesterol level of 250 mg/100mL, a glucose level of 100mg/100mL, a hematocrit of 40%, <strong>and</strong> a vital capacity of 450 centiliters who smokes 10 cigarettesper day. (Note that these numbers are near average for a healthy woman except for the cholesterollevel which is high, <strong>and</strong> of course the number of cigarettes smoked.)(5): Sports Fanatics My husb<strong>and</strong>, Gareth, is from New Zeal<strong>and</strong> where the national sportspassion is rugby (sort of like American football only better!) The national rugby team is calledthe All Blacks (they wear black) <strong>and</strong> their main rivals are Australia (the Wallabies) <strong>and</strong> SouthAfrica (the Springboks). Gareth realizes that what he really cares about is whether the All Blacks4
win or not. Therefore he decides to perform a logistic regression with the the response variable,Y, being whether or not the All Blacks win (Y = 1 if they win <strong>and</strong> 0 if they lose). The predictors areAB Win%=the percent of the previous ten games that the All Blacks had won going into the gamein question, ranging from 0 to 100OppWin%, (same definition for the opponents last 10 games)Home?, an indicator variable with 1 corresponding to an All Blacks home game <strong>and</strong> 0 an away gameTemperature (the temperature that the game was played at.)Australia? (a dummy variable with 1 corresponding to a game against archrival Australia <strong>and</strong> 0 agame against another team.)Below are the p-value for the likelihood ratio chi-square test along with a table of coefficients, t<strong>and</strong>arderrors, Z scores <strong>and</strong> p-values for the various variables. Use them to answer the questions below.LR chi2 p-Value < 0.0001Coef SE Z p-valueConstant -25.30 10.54 -2.40 0.0163AB Win % 0.466 0.176 2.65 0.0082Opp Win % -0.170 0.643 -2.65 0.0081Home? 1.45 0.66 2.20 0.0278Temperature 0.115 0.045 2.55 0.0108Australia? -0.245 1.89 -0.13 0.8969(a) Is there evidence that at least one of the variables is a statistically significant predictor ofwhether the All Blacks win? Justify your answer.(b) What does the coefficient for Temperature tell us about the relationship between Temperature<strong>and</strong> the probability that the All Blacks win? Compute the corresponding odds ratio for a 10 degreeincrease in temperature <strong>and</strong> explain what it means. Give a confidence interval for this odds ratio.(c) Which variables are statistically significant? Justify your answer. Do the signs of the variouscoefficients make sense?(d) Estimate the probability of the New Zeal<strong>and</strong> All Blacks winning a game against South Africaplayed in South Africa at 50 degree temperatures where both teams have a winning percentage of70(e) Find a confidence interval for the coefficient of the Home? variable <strong>and</strong> give a brief interpretation.Also find the odds ratio for the corresponding variable <strong>and</strong> a 95% confidence interval <strong>and</strong>5
interpret those results.(f) The coefficient for the Home? variable seems to indicate that the All Blacks are more likely towin at home than on the road. However, somewhat surprisingly, the All Blacks turn out to winmore games on the road than at home. One of my husb<strong>and</strong>s MBA students (from that school onthe wrong side of town) looks at these results <strong>and</strong> states that this indicates that there must besome mistake in the analysis. However, you tell them that in fact this apparent inconsistency isentirely possible even if the model is correct. Assuming that the model is correct (i.e. there areno important variables missing from the model or violations of the basic assumptions etc.) <strong>and</strong>the coefficient estimates are exactly correct how could the coefficient for Home? be positive eventhough the All Blacks win more games on the road?6