Biostatistics 100B, Midterm 1, Practice Set 2 - UCLA Biostatistics
Biostatistics 100B, Midterm 1, Practice Set 2 - UCLA Biostatistics
Biostatistics 100B, Midterm 1, Practice Set 2 - UCLA Biostatistics

Create successful ePaper yourself
Turn your PDF publications into a flip-book with our unique Google optimized e-Paper software.
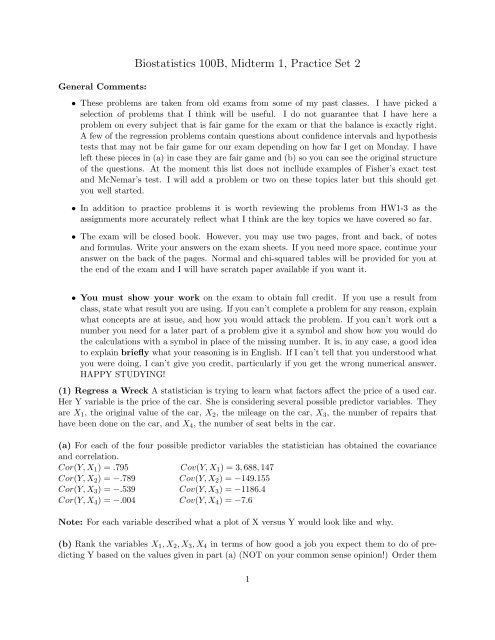
General Comments:<strong>Biostatistics</strong> <strong>100B</strong>, <strong>Midterm</strong> 1, <strong>Practice</strong> <strong>Set</strong> 2• These problems are taken from old exams from some of my past classes. I have picked aselection of problems that I think will be useful. I do not guarantee that I have here aproblem on every subject that is fair game for the exam or that the balance is exactly right.A few of the regression problems contain questions about confidence intervals and hypothesistests that may not be fair game for our exam depending on how far I get on Monday. I haveleft these pieces in (a) in case they are fair game and (b) so you can see the original structureof the questions. At the moment this list does not incllude examples of Fisher’s exact testand McNemar’s test. I will add a problem or two on these topics later but this should getyou well started.• In addition to practice problems it is worth reviewing the problems from HW1-3 as theassignments more accurately reflect what I think are the key topics we have covered so far.• The exam will be closed book. However, you may use two pages, front and back, of notesand formulas. Write your answers on the exam sheets. If you need more space, continue youranswer on the back of the pages. Normal and chi-squared tables will be provided for you atthe end of the exam and I will have scratch paper available if you want it.• You must show your work on the exam to obtain full credit. If you use a result fromclass, state what result you are using. If you can’t complete a problem for any reason, explainwhat concepts are at issue, and how you would attack the problem. If you can’t work out anumber you need for a later part of a problem give it a symbol and show how you would dothe calculations with a symbol in place of the missing number. It is, in any case, a good ideato explain briefly what your reasoning is in English. If I can’t tell that you understood whatyou were doing, I can’t give you credit, particularly if you get the wrong numerical answer.HAPPY STUDYING!(1) Regress a Wreck A statistician is trying to learn what factors affect the price of a used car.Her Y variable is the price of the car. She is considering several possible predictor variables. Theyare X 1 , the original value of the car, X 2 , the mileage on the car, X 3 , the number of repairs thathave been done on the car, and X 4 , the number of seat belts in the car.(a) For each of the four possible predictor variables the statistician has obtained the covarianceand correlation.Cor(Y,X 1 ) = .795 Cov(Y,X 1 ) = 3,688,147Cor(Y,X 2 ) = −.789 Cov(Y,X 2 ) = −149.155Cor(Y,X 3 ) = −.539 Cov(Y,X 3 ) = −1186.4Cor(Y,X 4 ) = −.004 Cov(Y,X 4 ) = −7.6Note: For each variable described what a plot of X versus Y would look like and why.(b) Rank the variables X 1 ,X 2 ,X 3 ,X 4 in terms of how good a job you expect them to do of predictingY based on the values given in part (a) (NOT on your common sense opinion!) Order them1
from best predictor to worst predictor and briefly explain your reasoning.(c) To simplify matters the statistician has fit two regressions, one of price (Y) on mileage (X 2 ) andone of price (Y) on the number of repairs the car has had (X 3 ). Printouts for these regressions aregiven on the following page. Give three numbers from the printouts that tell you which predictor,X 2 or X 3 is doing a better job and briefly explain why that number tells you it is doing a betterjob. Do the numbers confirm your prediction from part (b)? (Note: Comparing R 2 from printout1 to R 2 from printout 2 counts as one number. You should give three pairs/comparisons.)*************************The regression equation isCarPrice = 9258 - 79.8 MileagePredictor Coef SE Coef T PConstant 9257.9 492.2 18.81 0.000Mileage -79.797 8.690 -9.81 0.000Root MSE = 831.7 R-Sq = 63.7% R-Sq(adj) = 63.0%Analysis of VarianceSource DF SS MS F PRegression 1 58320331 58320331 84.32 0.000Residual Error 48 33201346 691695Total 49 91521677************************The regression equation isCarPrice = 5932 - 458 RepairsPredictor Coef SE Coef T PConstant 5932.0 290.5 20.42 0.000Mileage -458.2 103.2 -4.44 0.000Root MSE = 1163 R-Sq = 29.1% R-Sq(adj) = 27.6%Analysis of VarianceSource DF SS MS F PRegression 1 26636185 26636185 19.70Residual Error 48 64885492 1351781 Prob > FTotal 49 91521677 .000Problem 2: Television Ads You own a chain of stores that sells television sets and you wantto know whether your advertising is increasing your sales. Let Y be the number of TVs you sell ina given month, and let X be the amount of money you spend on advertising in a given month in2
(f) Suppose we use the exact same sales data to fit the regression model but we measure Y inhundreds of sets sold and X in hundreds of dollars spent on ads. What would the estimated regressionequation have been? In other words, what would your b 0 and b 1 be? Briefly show your workor explain your reasoning.Problem 3: Leaping Into the FutureIn the modern Olympic era, performances in track and field have been steadily improving. Thetable below gives the winning distance (in inches) for the Olympic long jump from 1952 to 1984.Below is a regression printout for a simple regression of distance on year. Use the printout toanswer the following questions.ScatterplotYear Distance1952 2981956 308.251960 319.751964 317.751968 350.51972 324.51976 328.51980 336.251984 336.25-Distance-x--340+- x x-- x- x320+ x- x-- x-300+ x----------+---------+---------+---------+---------+--------Year1956.0 1962.0 1968.0 1974.0 1980.04
Regression AnalysisThe regression equation isDistance = - 1818 + 1.09 YearPredictor Coef StDev T PConstant -1817.8 706.1 -2.57 0.037Year 1.0885 0.3588 3.03 0.019Root MSE = 11.12 R-Sq = 56.8% R-Sq(adj) = 50.6%Analysis of VarianceSource DF SS MS F PRegression 1 1137.5 1137.5 9.21 0.019Residual Error 7 865.0 123.6Total 8 2002.5********************(a) Give the units and interpretation of b 1 in the simple regression model.(b) What proportion of the variability in distance is explained by year using the simple linearregression model? Does the model do a good job in this respect?(c) Does the simple linear regression model do a good job of predicting the Y values? Make sureyou justify your answer.(d) Is there a significant linear relationship between years and distance? Justify your answer usingan appropriate test.Problem 4: Sneaker Sales You have just taken over the pricing department at Sneaky Zeke’sSneakers. Based on your wonderful education at <strong>UCLA</strong> you suspect that there is a relationshipbetween the price you charge for a pair of sneakers and the number of pairs of sneakers you willsell. Looking over recent sales records you see that stores have sold your sneakers at a variety ofdifferent prices. Let X be the price that has been charged for a pair of sneakers (in dollars) and letY be the number of pairs that have been sold by a store in a given month. You have obtained dataon X and Y for n=12 months. Some useful quantities have also been computed for you. Use themto answer the following questions.5
¯X 100 Ȳ 100n 12 SSX 1200SCP -1200∑SSR 1200SSE 300 Xi 1200∑ X2i 121200∑Yi 1200∑ Y2i 121500∑Xi Y i 118800(a) Find the estimated regression coefficients, b 0 and b 1 . Show your work.(b) Give the units and real-world interpretations of b 0 and b 1 . (If you couldn’t answer part (a),assume b 0 = 200 and b 1 = −1.8).(c) Use the information given to calculate R 2 , the percentage of variability in sales explained bythe regression on price. Show your work.(d) Recall that the correlation, ˆρ, gives the strength and direction of the relationship between Yand X. It turns out that ˆρ 2 = R 2 . Use this fact to find the correlation between price and numberof pairs of sneakers sold. Briefly explain any choices that you make while doing this calculation.(If you couldn’t answer part (d), assume R 2 = .49.)(e) Predict the number of pairs of sneakers that will be sold in a month if you charge a price of$300 per pair. Does this answer make real-world sense? Explain. What do you think might havecaused this result?(f) In part (a) you found that the estimated regression equation for predicting Y, thenumber of pairs of sneakers sold in a month, using X, the price of a pair of sneakers.Use this information to write down the equation for predicting TOTAL SALES INDOLLARS FOR A MONTH. Hint: Think about the relationship between total salesin dollars, number of items sold, and price. (Note: If you couldn’t do part (a), youmay assume b 0 = 200 and b 1 = −1.8.)(g)(Optional Bonus) Using your answer to part (f) figure out the optimal price forthe company to charge for their product to maximize sales. (Hint: The expressionaX 2 + bX + c is maximized by setting X = −b/2a.)Problem 5: Quickie Quiz Let Y be your score on a midterm (out of 100 points), let X 1be the number of hours you study for the midterm, and let X 2 be the number of classsessions you skipped before the midterm. Suppose you fit simple linear regressions ofyour midterm score on each of these variables and findŶ = 20 + 5X 1 and Ŷ = 90 − 10X 2Say whether each of the following statements is True or False. If the answer is false,briefly explain why. If the statement is true you do not need to explain your reasoningalthough doing so may help you get partial credit if you are wrong.6
(a) The average score of people who didn’t study for the exam was about 20.(b) The slope estimate b 1 = −10 in the regression of midterm score on number ofclasses skipped means that every class you skip causes your midterm score to go downby 10 points on average.(c) The fact that the coefficient of X 1 is positive and the coefficient of X 2 is negativemeans that hours studied is a better predictor of midterm score than number of classesskipped.(d) (Optional Bonus–no credit given without explanation) The fact that b 1 = 5 in theequation for studying is smaller in absolute value than b 1 = −10 in the equation for classes skippedmeans that the relationship between midterm score and studying is weaker than the relationshipbetween midterm score and skipping class.Problem 6: Race and Politics During the recent election between the blue party and the redparty, race was a major issue. Now that it is over, the blue party has conducted a poll to see howthey were fared with different ethnic groups. They surveyed n=400 voters and recorded their age(in years), their income (in thousands of dollars), their ethnicity: white (W), black (B), asian (A),or hispanic (H), and who they voted for: the blue candidate (BL), or the red candidate (RD).(a) The blue party statistician suspects that which party people voted for may depend their ethnicity.(In particular, historical precedent suggests that minorities tend to favor the blue party.)To check this she has conducted a contingency table analysis. The STATA printout is given below.State the null and alternative hypotheses she is testing, give the p-value and test statistic, andexplain your real-world conclusions. Based on the printout, explain briefly which groups of peopleappear to prefer the blue party more than the public as a whole and which groups the blue partyneeds to make more effort to reach out to.. tabi 40 60\ 60 40\47 53\ 40 60, chi2 exp+--------------------+| Key ||--------------------|| frequency || expected frequency |+--------------------+| colrow | Blue Red | Total-----------+----------------------+----------White | 40 60 | 100| 46.8 53.3 | 100.07
-----------+----------------------+----------Black | 60 40 | 100| 46.8 53.3 | 100.0-----------+----------------------+----------Hispanic | 47 53 | 100| 46.8 53.3 | 100.0-----------+----------------------+----------Asian | 40 60 | 100| 46.8 53.3 | 100.0-----------+----------------------+----------Total | 187 213 | 400| 187.0 213.0 | 400.0Pearson chi2(3) = 10.7153 Pr = 0.0138
(b) Would it have been more appropriate to use Fisher’s exact test for this problem? Explain briefly.(c) Based on the results of part (a), the national chair of the blue party claims that people votefor one candidate or the other because of their ethnicity. Is this claim correct? If so, explain why.If not, explain why not and give an example of why it might be wrong based on your available data.Problem 7: Rudolph the Red Nosed Statistics Student Poor Rudolph! His nose is red fromsneezing with the flu while staying up all night studying for his statistics final. While procrastinatinghe has come across an interesting article about flu treatments. A medical center has conducteda study of 250 people. 50 were randomly chosen to receive a placebo, 100 were given the standardflu vaccine, and 100 were given the new nasal spray flu “vaccine.” The organizers of the studyrecorded in each case the type of treatment received, the age of the subject, and whether or notthe subject ultimately got the flu. A STATA contingency table analysis for the treatment and fluvariables is shown below.. tabi 15 28 15\ 35 72 85, chi2 exp+--------------------+| Key ||--------------------|| frequency || expected frequency |+--------------------+| colrow | Placebo Vaccine Spray | Total-----------+---------------------------------+----------Flu | 15 28 15 | 58| 11.6 23.2 23.2 | 58.0-----------+---------------------------------+----------No Flu | 35 72 85 | 192| 38.4 76.8 76.8 | 192.0-----------+---------------------------------+----------Total | 50 100 100 | 250| 50.0 100.0 100.0 | 250.0Pearson chi2(2) = 6.3645 Pr = 0.041(a) State in words the null and alternative hypotheses that are being tested by the contingencytable analysis and give your real-world conclusions. Which one (if any) of the three treatmentsseems to be the most effective? Briefly justify your answers.(b) The organizers of the study would like to claim that taking the nasal flu treatment causes yourchances of getting the flu to go down. Can they say this? Why or why not.9