secondary data review on the food security situation in the kyrgyz ...
secondary data review on the food security situation in the kyrgyz ...
secondary data review on the food security situation in the kyrgyz ...

Create successful ePaper yourself
Turn your PDF publications into a flip-book with our unique Google optimized e-Paper software.
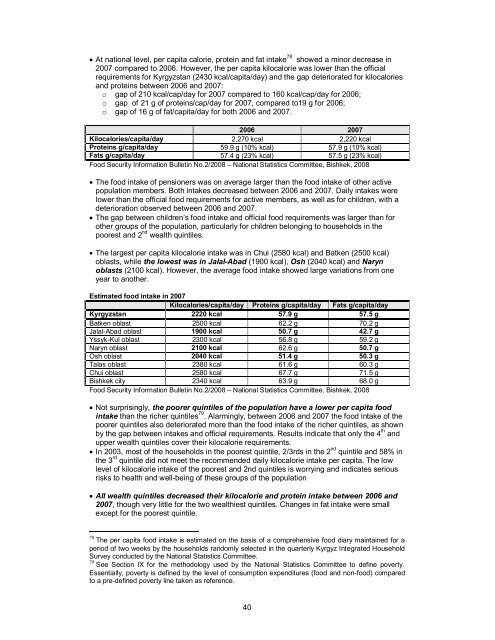
At nati<strong>on</strong>al level, per capita calorie, prote<strong>in</strong> and fat <strong>in</strong>take 78 showed a m<strong>in</strong>or decrease <strong>in</strong>2007 compared to 2006. However, <strong>the</strong> per capita kilocalorie was lower than <strong>the</strong> officialrequirements for Kyrgyzstan (2430 kcal/capita/day) and <strong>the</strong> gap deteriorated for kilocaloriesand prote<strong>in</strong>s between 2006 and 2007:o gap of 210 kcal/cap/day for 2007 compared to 160 kcal/cap/day for 2006;o gap of 21 g of prote<strong>in</strong>s/cap/day for 2007, compared to19 g for 2006;o gap of 16 g of fat/capita/day for both 2006 and 2007.2006 2007Kilocalories/capita/day 2,270 kcal 2,220 kcalProte<strong>in</strong>s g/capita/day 59.9 g (10% kcal) 57.9 g (10% kcal)Fats g/capita/day 57.4 g (23% kcal) 57.5 g (23% kcal)Food Security Informati<strong>on</strong> Bullet<strong>in</strong> No.2/2008 – Nati<strong>on</strong>al Statistics Committee, Bishkek, 2008 The <strong>food</strong> <strong>in</strong>take of pensi<strong>on</strong>ers was <strong>on</strong> average larger than <strong>the</strong> <strong>food</strong> <strong>in</strong>take of o<strong>the</strong>r activepopulati<strong>on</strong> members. Both <strong>in</strong>takes decreased between 2006 and 2007. Daily <strong>in</strong>takes werelower than <strong>the</strong> official <strong>food</strong> requirements for active members, as well as for children, with adeteriorati<strong>on</strong> observed between 2006 and 2007. The gap between children’s <strong>food</strong> <strong>in</strong>take and official <strong>food</strong> requirements was larger than foro<strong>the</strong>r groups of <strong>the</strong> populati<strong>on</strong>, particularly for children bel<strong>on</strong>g<strong>in</strong>g to households <strong>in</strong> <strong>the</strong>poorest and 2 nd wealth qu<strong>in</strong>tiles. The largest per capita kilocalorie <strong>in</strong>take was <strong>in</strong> Chui (2580 kcal) and Batken (2500 kcal)oblasts, while <strong>the</strong> lowest was <strong>in</strong> Jalal-Abad (1900 kcal), Osh (2040 kcal) and Narynoblasts (2100 kcal). However, <strong>the</strong> average <strong>food</strong> <strong>in</strong>take showed large variati<strong>on</strong>s from <strong>on</strong>eyear to ano<strong>the</strong>r.Estimated <strong>food</strong> <strong>in</strong>take <strong>in</strong> 2007Kilocalories/capita/day Prote<strong>in</strong>s g/capita/day Fats g/capita/dayKyrgyzstan 2220 kcal 57.9 g 57.5 gBatken oblast 2500 kcal 62.2 g 70.2 gJalal-Abad oblast 1900 kcal 50.7 g 42.7 gYssyk-Kul oblast 2300 kcal 56.8 g 59.2 gNaryn oblast 2100 kcal 62.6 g 50.7 gOsh oblast 2040 kcal 51.4 g 50.3 gTalas oblast 2380 kcal 61.6 g 60.3 gChui oblast 2580 kcal 67.7 g 71.5 gBishkek city 2340 kcal 63.9 g 68.0 gFood Security Informati<strong>on</strong> Bullet<strong>in</strong> No.2/2008 – Nati<strong>on</strong>al Statistics Committee, Bishkek, 2008 Not surpris<strong>in</strong>gly, <strong>the</strong> poorer qu<strong>in</strong>tiles of <strong>the</strong> populati<strong>on</strong> have a lower per capita <strong>food</strong><strong>in</strong>take than <strong>the</strong> richer qu<strong>in</strong>tiles 79 . Alarm<strong>in</strong>gly, between 2006 and 2007 <strong>the</strong> <strong>food</strong> <strong>in</strong>take of <strong>the</strong>poorer qu<strong>in</strong>tiles also deteriorated more than <strong>the</strong> <strong>food</strong> <strong>in</strong>take of <strong>the</strong> richer qu<strong>in</strong>tiles, as shownby <strong>the</strong> gap between <strong>in</strong>takes and official requirements. Results <strong>in</strong>dicate that <strong>on</strong>ly <strong>the</strong> 4 th andupper wealth qu<strong>in</strong>tiles cover <strong>the</strong>ir kilocalorie requirements. In 2003, most of <strong>the</strong> households <strong>in</strong> <strong>the</strong> poorest qu<strong>in</strong>tile, 2/3rds <strong>in</strong> <strong>the</strong> 2 nd qu<strong>in</strong>tile and 58% <strong>in</strong><strong>the</strong> 3 rd qu<strong>in</strong>tile did not meet <strong>the</strong> recommended daily kilocalorie <strong>in</strong>take per capita. The lowlevel of kilocalorie <strong>in</strong>take of <strong>the</strong> poorest and 2nd qu<strong>in</strong>tiles is worry<strong>in</strong>g and <strong>in</strong>dicates seriousrisks to health and well-be<strong>in</strong>g of <strong>the</strong>se groups of <strong>the</strong> populati<strong>on</strong> All wealth qu<strong>in</strong>tiles decreased <strong>the</strong>ir kilocalorie and prote<strong>in</strong> <strong>in</strong>take between 2006 and2007, though very little for <strong>the</strong> two wealthiest qu<strong>in</strong>tiles. Changes <strong>in</strong> fat <strong>in</strong>take were smallexcept for <strong>the</strong> poorest qu<strong>in</strong>tile.78 The per capita <strong>food</strong> <strong>in</strong>take is estimated <strong>on</strong> <strong>the</strong> basis of a comprehensive <strong>food</strong> diary ma<strong>in</strong>ta<strong>in</strong>ed for aperiod of two weeks by <strong>the</strong> households randomly selected <strong>in</strong> <strong>the</strong> quarterly Kyrgyz Integrated HouseholdSurvey c<strong>on</strong>ducted by <strong>the</strong> Nati<strong>on</strong>al Statistics Committee.79 See Secti<strong>on</strong> IX for <strong>the</strong> methodology used by <strong>the</strong> Nati<strong>on</strong>al Statistics Committee to def<strong>in</strong>e poverty.Essentially, poverty is def<strong>in</strong>ed by <strong>the</strong> level of c<strong>on</strong>sumpti<strong>on</strong> expenditures (<strong>food</strong> and n<strong>on</strong>-<strong>food</strong>) comparedto a pre-def<strong>in</strong>ed poverty l<strong>in</strong>e taken as reference.40