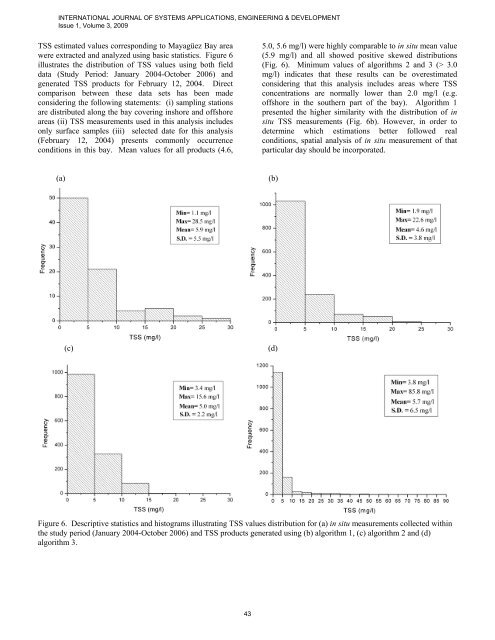
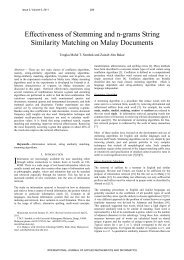
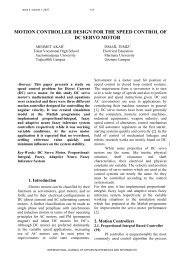
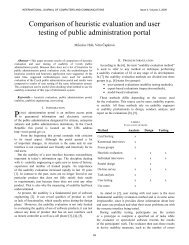
INTERNATIONAL JOURNAL OF SYSTEMS APPLICATIONS, ENGINEERING & DEVELOPMENTIssue 1, Volume 3, 2009TSS estimated values corresponding <strong>to</strong> Mayagüez Bay areawere extracted and analyzed using basic statistics. Figure 6illustrates the distribution of TSS values using both fielddata (Study Period: January 2004-Oc<strong>to</strong>ber 2006) andgenerated TSS products for February 12, 2004. Directcomparison between these data sets has been madeconsidering the following statements: (i) sampling stationsare distributed along the bay covering inshore and offshoreareas (ii) TSS measurements used in this analysis includesonly surface samples (iii) selected date for this analysis(February 12, 2004) presents commonly occurrenceconditions in this bay. Mean values for all products (4.6,5.0, 5.6 mg/l) were highly comparable <strong>to</strong> in situ mean value(5.9 mg/l) and all showed positive skewed distributions(Fig. 6). Minimum values of algorithms 2 and 3 (> 3.0mg/l) indicates that these results can be overestimatedconsidering that this analysis includes areas where TSSconcentrations are normally lower than 2.0 mg/l (e.g.offshore in the southern part of the bay). Algorithm 1presented the higher similarity with the distribution of insitu TSS measurements (Fig. 6b). However, in order <strong>to</strong>determine which estimations better followed realconditions, spatial analysis of in situ measurement of thatparticular day should be incorporated.(a)(b)(c)(d)Figure 6. Descriptive statistics and his<strong>to</strong>grams illustrating TSS values distribution for (a) in situ measurements collected withinthe study period (January 2004-Oc<strong>to</strong>ber 2006) and TSS products generated using (b) algorithm 1, (c) algorithm 2 and (d)algorithm 3.43
INTERNATIONAL JOURNAL OF SYSTEMS APPLICATIONS, ENGINEERING & DEVELOPMENTIssue 1, Volume 3, 2009IV. CONCLUSION\Geometric and radiometric corrections utilized duringimage pre-processing routines are crucial for this type ofanalysis. Atmospheric correction included in L2gencommand (SeaDAS) is not suitable for application inMayagüez Bay waters. This same result is expected <strong>to</strong> findin other tropical bays. Fairly good empirical relationshipwere defined between in situ R rs , TSS and <strong>MODIS</strong> band 1data using linear and exponential equations. Application ofdeveloped equations resulted on TSS products able <strong>to</strong>detect spatial variations associated <strong>to</strong> typical patterns ofcoastal environments. Algorithm 3 showed the highercorrespondence between observed and estimated values(RMSE 4.76 mg/l). However, all three algorithms resultedin reasonable TSS pixel values when compared with datafrom in situ measurements therefore at this point none ofthe algorithms is excluded for future application. <strong>Using</strong> anexponential equation resulted in a more suitable approachfor this study purpose, since the algorithm including thisequation was more effective estimating low values whichare the dominant conditions in the studied bay. Validationresults can be improved by addressing limiting fac<strong>to</strong>rs suchas lacking of data corresponding <strong>to</strong> high concentrations,and contamination by the remaining atmospheric effect inthe derived reflectance of the sensor. The results obtainedin this study provide a baseline <strong>to</strong> develop TSS operationalproducts for tropical coastal waters by developingpreliminary products and identifying potential errors andlimiting fac<strong>to</strong>rs in the process.ACKNOWLEDGMENTWe are grateful <strong>to</strong> Dr. Nazario Ramirez who presented thiswork in The 8th WSEAS International Conference onInstrumentation, Measurement, Circuits and Systems(IMCAS ’09). We also would like <strong>to</strong> acknowledge Dr.Ramón López who provided great support during thedevelopment of the study, and Joaquín Trinanes for givinghelpful recommendations. Special thanks <strong>to</strong> Patrick Reyesand José Martinez for helping in getting and processing partthe data presented. Our appreciation <strong>to</strong> all the people thatcollaborated in the field and labora<strong>to</strong>ry work.REFERENCES[1] Wang, X., Wang, Q., Liu, G. and Li, H., A study on the QuantitativeRemote Sensing Model for the <strong>Suspended</strong> <strong>Sediment</strong> Concentration inCoastal Water with ASTER Conference paper, 2005, Report no.A290054.[2] Hu, C., Chen, Z., Clay<strong>to</strong>n, T.D., Swarzenski, P., Brock J.C. and Muller-Karger F.E., Assessment of estuarine water-quality indica<strong>to</strong>rs using<strong>MODIS</strong> medium-resolution bands: Initial results from Tampa Bay,FL, Remote Sensing of Environment, Vol.93, 2004, pp.423-441.[3] Chen, Z., Hu, C. and Muller-Karger, F., Moni<strong>to</strong>ring turbidity in TampaBay using <strong>MODIS</strong>/Aqua <strong>250</strong>-m imagery. Remote Sensing ofEnvironment, Vol. 109, 2007, pp.207–220.[4] Miller, R.L., McKee, B.A. and D’Sa, E.J., (eds.) Moni<strong>to</strong>ring bot<strong>to</strong>msediment resuspension and suspended sediments in shallow coastalwaters, Remote Sensing of Coastal Aquatic Environment, 259-276,Springer, Printed in the Netherlands.[5] Peckhman, S.D., A new method for estimating suspended sedimentconcentrations and deposition rates from satellite imagery based onthe physics of plumes, Computers Geosciences, Vol. 24, 2007,pp.1198-1222.[6] Li, R. and Li, J., Satellite Remote Sensing Technology for Lake WaterClarity Moni<strong>to</strong>ring: An Overview, Environmental InformaticsArchives, Vol. 2, 2004, 893-901.[7] Moore, G. F., Aiken, J., & Lavander, S. J., The atmospheric correctionof water colour and the quantitative retrieval of suspended particulatematter in Case II waters: application <strong>to</strong> MERIS. InternationalJournal of Remote Sensing, Vol. 20, No. 9, 1999, pp. 1713-1733.[8] Doxaran, D., Froidefond, J., & Castaing, P., A reflectance band ratioused <strong>to</strong> estimate suspended matter concentrations in sedimentdominated coastal waters. International Journal of Remote Sensing,Vol. 23, No. 23, 2002, 5079– 5085.[9] Teodoro A.C., Veloso-Gomes, F. and Goncalves, H., StatisticalTechniques for Correlating <strong>Total</strong> <strong>Suspended</strong> Matter Concentrationwith Seawater Reflectance <strong>Using</strong> Multispectral Satellite Data,Journal of Coastal Research, Vol. 24, No. 4C, 2008, 40-49.[10]Chen, Z., Hu, C. & Muller-Karger, F.. Moni<strong>to</strong>ring turbidity in TampaBay using <strong>MODIS</strong>/Aqua <strong>250</strong>-m imagery, Remote Sensing ofEnvironment, Vol. 109, 2007, pp. 207–220.[11] Miller, R. L. & McKee, B. A., <strong>Using</strong> <strong>MODIS</strong> Terra <strong>250</strong> m imagery <strong>to</strong>map concentration of <strong>to</strong>tal suspended matter in coastal waters,Remote Sensing of Environment, 2004, Vol. 93, 259-366.[12] Nasr A.H., El Leithy, B.M., Helmy, A.K., Assessment of Some WaterQuality Parameters <strong>Using</strong> <strong>MODIS</strong> Data along the Red Sea Coast,Egypt, Proc. of 3rd WSEAS International Conference on RemoteSensing, Venice, Italy, November 21-23, 2007, 570-423.[13] Hellweger, F. L., Schlosser, P. & Weissel, J. K., Use of satelliteimagery for water quality studies in New York Harbor, Estuarine,Coastal and Shelf Science, Vol. 61, 2004,437-448.[14] Rosado-Torres, M., Evaluation And Development Of Bio-OpticalAlgorithms For Chlorophyll Retrieval In Western Puer<strong>to</strong> Rico,University of Puer<strong>to</strong> Rico at Mayaguez, Department of MarineSciences, 2008, 116 pages.[15] Austin, R., The remote sensing of spectral radiance from below theocean surface. In: N. G. Jerlov, & E. Steemann Nielsen (Eds.),Optical aspects of oceanography, 1974, London, New York:Academic Press, pp. 317-344.[16] Mueller, J. L., Morel, A., Frouin, R. T. Davis C., Arnone, R., Carder,K., Lee, Z. P., Steward, R. G., Hooker S., Mobley C. D., McLean S.,Holben B., Miller M., Pietras C., Knobelspiesse K. D., Fargion G. S.,Porter J. & Voss K, Ocean optics pro<strong>to</strong>cols for Satellite Ocean Colorvalidation, Revision 4, Volume III: Radiometric Measurements andData Analysis Pro<strong>to</strong>cols, 2003, In Mueller J.L., Fargion G. S. andMcClain C.R. (Eds.). NASA/TM 2003-21621, Greenbelt, MD: NASAGoddard Space Flight Center, pp. 28-29.[17] Strickland, J.H.D. and Parsons, T.R., A practical handbook of seawateranalysis, Bull. J. Fish. Res. Bd. Can, Vol.167, 1972, pp. 311.[18] OceanColor Webmaster, 2008http://oceancolor.gsfc.nasa.gov/seadas/doc/l2gen/l2gen.html[19] Guerriero, A., Matarrese, R., Morea, A., Tijani, K., A Grid EnabledLook-Up Table for Aerosol Optical Thickness Estimation on CoastalWater, Proc. of the 9th WSEAS Int. Conf. on Mathematical andComputational Methods in Science and Engineering, Trinidad andTobago, November 5-7, 2007, 137-140.[20] Roosta, H., Farhoudi, R., Roosta, M., Multi Temporal Disaggregationof <strong>MODIS</strong> Images <strong>Using</strong> Non-Linear Analysis, Proc. of 5 th WSEASInt. Conf. on Environment, Ecosystems and Development, Tenerife,Spain, December 14-16, 2007, 222-227.44