Using MODIS 250 m Imagery to Estimate Total Suspended Sediment
Using MODIS 250 m Imagery to Estimate Total Suspended Sediment
Using MODIS 250 m Imagery to Estimate Total Suspended Sediment

You also want an ePaper? Increase the reach of your titles
YUMPU automatically turns print PDFs into web optimized ePapers that Google loves.
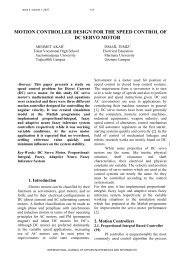
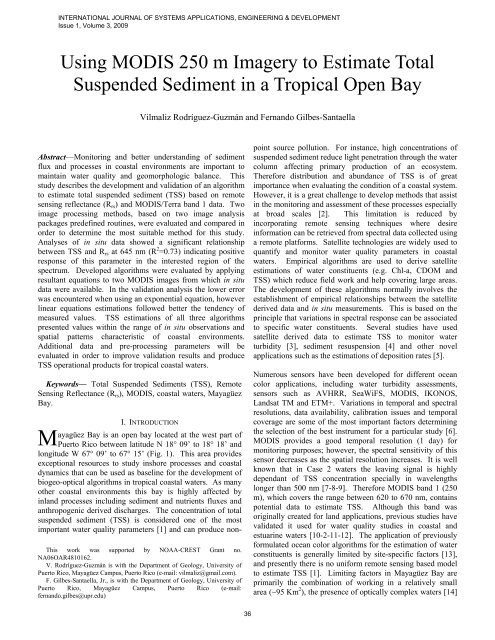
INTERNATIONAL JOURNAL OF SYSTEMS APPLICATIONS, ENGINEERING & DEVELOPMENTIssue 1, Volume 3, 2009<strong>Using</strong> <strong>MODIS</strong> <strong>250</strong> m <strong>Imagery</strong> <strong>to</strong> <strong>Estimate</strong> <strong>Total</strong><strong>Suspended</strong> <strong>Sediment</strong> in a Tropical Open BayVilmaliz Rodríguez-Guzmán and Fernando Gilbes-SantaellaAbstract—Moni<strong>to</strong>ring and better understanding of sedimentflux and processes in coastal environments are important <strong>to</strong>maintain water quality and geomorphologic balance. Thisstudy describes the development and validation of an algorithm<strong>to</strong> estimate <strong>to</strong>tal suspended sediment (TSS) based on remotesensing reflectance (R rs ) and <strong>MODIS</strong>/Terra band 1 data. Twoimage processing methods, based on two image analysispackages predefined routines, were evaluated and compared inorder <strong>to</strong> determine the most suitable method for this study.Analyses of in situ data showed a significant relationshipbetween TSS and R rs at 645 nm (R 2 =0.73) indicating positiveresponse of this parameter in the interested region of thespectrum. Developed algorithms were evaluated by applyingresultant equations <strong>to</strong> two <strong>MODIS</strong> images from which in situdata were available. In the validation analysis the lower errorwas encountered when using an exponential equation, howeverlinear equations estimations followed better the tendency ofmeasured values. TSS estimations of all three algorithmspresented values within the range of in situ observations andspatial patterns characteristic of coastal environments.Additional data and pre-processing parameters will beevaluated in order <strong>to</strong> improve validation results and produceTSS operational products for tropical coastal waters.Keywords— <strong>Total</strong> <strong>Suspended</strong> <strong>Sediment</strong>s (TSS), RemoteSensing Reflectance (R rs ), <strong>MODIS</strong>, coastal waters, MayagüezBay.MI. INTRODUCTIONThis work was supported by NOAA-CREST Grant no.NA06OAR4810162.V. Rodríguez-Guzmán is with the Department of Geology, University ofPuer<strong>to</strong> Rico, Mayagüez Campus, Puer<strong>to</strong> Rico (e-mail: vilmaliz@gmail.com).F. Gilbes-Santaella, Jr., is with the Department of Geology, University ofPuer<strong>to</strong> Rico, Mayagüez Campus, Puer<strong>to</strong> Rico (e-mail:fernando.gilbes@upr.edu)ayagüez Bay is an open bay located at the west part ofPuer<strong>to</strong> Rico between latitude N 18° 09’ <strong>to</strong> 18° 18’ andlongitude W 67° 09’ <strong>to</strong> 67° 15’ (Fig. 1). This area providesexceptional resources <strong>to</strong> study inshore processes and coastaldynamics that can be used as baseline for the development ofbiogeo-optical algorithms in tropical coastal waters. As manyother coastal environments this bay is highly affected byinland processes including sediment and nutrients fluxes andanthropogenic derived discharges. The concentration of <strong>to</strong>talsuspended sediment (TSS) is considered one of the mostimportant water quality parameters [1] and can produce nonpointsource pollution. For instance, high concentrations ofsuspended sediment reduce light penetration through the watercolumn affecting primary production of an ecosystem.Therefore distribution and abundance of TSS is of greatimportance when evaluating the condition of a coastal system.However, it is a great challenge <strong>to</strong> develop methods that assistin the moni<strong>to</strong>ring and assessment of these processes especiallyat broad scales [2]. This limitation is reduced byincorporating remote sensing techniques where desireinformation can be retrieved from spectral data collected usinga remote platforms. Satellite technologies are widely used <strong>to</strong>quantify and moni<strong>to</strong>r water quality parameters in coastalwaters. Empirical algorithms are used <strong>to</strong> derive satelliteestimations of water constituents (e.g. Chl-a, CDOM andTSS) which reduce field work and help covering large areas.The development of these algorithms normally involves theestablishment of empirical relationships between the satellitederived data and in situ measurements. This is based on theprinciple that variations in spectral response can be associated<strong>to</strong> specific water constituents. Several studies have usedsatellite derived data <strong>to</strong> estimate TSS <strong>to</strong> moni<strong>to</strong>r waterturbidity [3], sediment resuspension [4] and other novelapplications such as the estimations of deposition rates [5].Numerous sensors have been developed for different oceancolor applications, including water turbidity assessments,sensors such as AVHRR, SeaWiFS, <strong>MODIS</strong>, IKONOS,Landsat TM and ETM+. Variations in temporal and spectralresolutions, data availability, calibration issues and temporalcoverage are some of the most important fac<strong>to</strong>rs determiningthe selection of the best instrument for a particular study [6].<strong>MODIS</strong> provides a good temporal resolution (1 day) formoni<strong>to</strong>ring purposes; however, the spectral sensitivity of thissensor decreases as the spatial resolution increases. It is wellknown that in Case 2 waters the leaving signal is highlydependant of TSS concentration specially in wavelengthslonger than 500 nm [7-8-9]. Therefore <strong>MODIS</strong> band 1 (<strong>250</strong>m), which covers the range between 620 <strong>to</strong> 670 nm, containspotential data <strong>to</strong> estimate TSS. Although this band wasoriginally created for land applications, previous studies havevalidated it used for water quality studies in coastal andestuarine waters [10-2-11-12]. The application of previouslyformulated ocean color algorithms for the estimation of waterconstituents is generally limited by site-specific fac<strong>to</strong>rs [13],and presently there is no uniform remote sensing based model<strong>to</strong> estimate TSS [1]. Limiting fac<strong>to</strong>rs in Mayagüez Bay areprimarily the combination of working in a relatively smallarea (~95 Km 2 ), the presence of optically complex waters [14]36
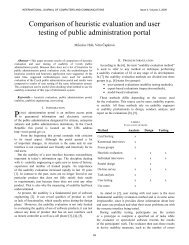
INTERNATIONAL JOURNAL OF SYSTEMS APPLICATIONS, ENGINEERING & DEVELOPMENTIssue 1, Volume 3, 2009and a relatively small range of TSS values. On the other hand,one of the most determinant aspects when using satelliteimages <strong>to</strong> retrieve water quality parameters is the atmosphericcorrection. In this study we have compared and evaluated theresults of two atmospheric correction methods available intwo different image analysis packages: ENVI (Dark Subtract)and SeaDAS (l2gen command). The present study is focusedin the development, evaluation and validation of site-specificalgorithms <strong>to</strong> estimate TSS based on <strong>MODIS</strong> reflectance band1.II. METHODOLOGYThis study aimed <strong>to</strong> establish empirical relationship betweenin situ measurements of TSS concentration, <strong>MODIS</strong> band 1reflectance and in situ remote sensing reflectance (R rs ) asmeasured with a field spectroradiometer. This approach willshow the potential of <strong>MODIS</strong> sensor for TSS estimations anddetermine the best method <strong>to</strong> develop an algorithm for thispurpose.A. In situ measurementsAll in situ data were collected during research cruisesbetween January 2004 and Oc<strong>to</strong>ber 2006 in a set of stationsdistributed along the bay (Fig. 1). Table 1 shows the datesincluded in this analysis which correspond <strong>to</strong> research cruiseswhere <strong>MODIS</strong> data were available. R rs was computed withmeasurements collected with the GER-1500 fieldspectroradiometer and using the following equation:RrsL=0( λ) − ( f ∗ L ( λ))ds+E (0 , λ)Where ƒ is the Fresnell coefficient equal <strong>to</strong> 0.028 at 45 o [15].The curves were corrected for sky-light reflection subtractingthe minimum measured value between 900-920 nm, and in afew cases using lower spectral regions (730-900 nm). It wasnot possible <strong>to</strong> select a specific wavelength because sampledstations include both clear and turbid waters and theseconditions affect the determination of the most appropriatewavelength for this correction [16]. Water samples werecollected at approximately at the depth of 1 meter deep in sixstations <strong>to</strong> measure TSS, which corresponded <strong>to</strong> all thematerial larger than 0.7 μm. Concentration of TSS (in mg/l)was determined using the standard weight difference method[17].B. <strong>MODIS</strong> DataTwo different processing methods were used <strong>to</strong> generatefunctional <strong>MODIS</strong> products. One was based on preprocessingroutines available in ENVI software and thesecond used SeaDAS commands (Fig. 2). Images collectedby the Moderate Resolution Imaging Spectroradiometer(<strong>MODIS</strong>) during the same sampling dates were downloadedthrough two NASA Internet servers: LAADS Web andOceanColor Web. For the first method the product selected atLAADS Web was MOD02QKM, which includes reflectanceand radiance valuesFigure 1. Study area (Mayagüez Bay at western Puer<strong>to</strong> Rico)showing the location of sampling stations. Stations colored inwhite indicate specific sites that were sampled only duringspecial missions, while six stations in gray are permanentstations.of <strong>MODIS</strong>/Terra band 1 and 2. All these images wereprocessed using ENVI (v. 3.4) processing routines: <strong>MODIS</strong>Georeference and Dark Subtract. The spatial reference systemwas defined as UTM NAD83 for Puer<strong>to</strong> Rico region. The darksubtract atmospheric correction consists in the selection of thedarkest value in band 2 and subtract it <strong>to</strong> all band 1 data. Thisvalue was manually identified in each image and then definedin the “User Value” option of this routine. For the secondmethod, L0 data were downloaded at the OceanColor Webbrowser. This data were processed using SeaDAS <strong>MODIS</strong>commands from level 0 <strong>to</strong> level 2. The program L2gen usesas input L1b data and generates level 2 products by applyingatmospheric corrections and bio-optical algorithms [18].Conditions in these waters suggested that the best algorithmfor atmospheric correction available in SeaDAS is the one thatperforms multiscattering switching between Near Infrared(NIR) and Short Wave Infrared (SWI) bands (J. Trinanes,personal communication). However, additional algorithmcorrections, available within L2gen command, were evaluatedin order <strong>to</strong> improve the results. After generating L2 products,the data were projected as UTM NAD83 using SeaDAS MapProjection command.C. Algorithm Development and ValidationA The algorithm consisted in the combination of twoequations, one defining the relationship between field R rs andTSS, and other establishing the relationship between field R rsat 645 nm and <strong>MODIS</strong> band 1. Data collected during thirteensampled days were used <strong>to</strong> develop the first equation, while37
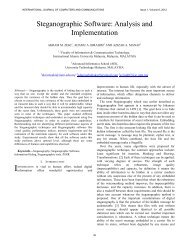
INTERNATIONAL JOURNAL OF SYSTEMS APPLICATIONS, ENGINEERING & DEVELOPMENTIssue 1, Volume 3, 2009III. RESULTS AND DISCUSSIONFigure 2. Schematic illustration of two methods used <strong>to</strong>process <strong>MODIS</strong> data. Method 1 is based in ENVI imageprocessing software and Method 2 uses SeaDAS specializedcommands.this number was limited <strong>to</strong> five for the second equation. Thisdifference was mainly due <strong>to</strong> the lack of good quality imagessuitable for analyses, which affected the development of thesecond equation. <strong>MODIS</strong> reflectance values were extractedfrom pixels corresponding <strong>to</strong> stations moni<strong>to</strong>red for R rs .Developed equations were applied <strong>to</strong> two images (February12, 2004 & March 8, 2008), which were not incorporated inthe previous analysis and in situ data were available in order<strong>to</strong> validate developed algorithms. Application of theequations was possible using ENVI band math <strong>to</strong>ol, whichcontains easy <strong>to</strong> use options <strong>to</strong> ingrate image bands inmathematical equations.Proficiency of the algorithms was evaluated by comparingestimated and observed values in a root mean square error(RMSE) analysis. Additionally, obtained TSS products werevisually analyzed in order <strong>to</strong> evaluate and identify spatialpatterns associated <strong>to</strong> this type of environment. Finally,resultant values corresponding <strong>to</strong> Mayagüez Bay area wereextracted for statistical analyses. The Mayagüez Bay area wasdigitalized by visual interpretation using orthorectified aerialpho<strong>to</strong>graph (2006) and saved as a polygon shapefile (ArcGIS9.3, ESRI). This shapefile was then imported <strong>to</strong> ENVI usingits vec<strong>to</strong>r files menu options and converted <strong>to</strong> a Region ofInterest (ROI), from which was very simple <strong>to</strong> extract theinformation of all pixels in the area of interest.A. <strong>MODIS</strong> ProductsThe first method resulted on seven reflectance products at645 nm (band 1), one for each research cruise dates. Threedifferent products for each date were generated using thesecond method: Remote sensing reflectance (R rs ), LeavingWater Radiance (L w ) and Normalized Leaving Radiance(nL w ). For purposes of this study the target product was R rs at645 nm, however resultant values in this and the rest ofgenerated products were mostly negative and with flaggedvalues. This suggested that the standard method forprocessing <strong>MODIS</strong> data in SeaDAS is not suitable forapplication in this type of waters characterized by highconcentrations of TSS and other water constituents incomparison <strong>to</strong> oceanic waters. Low and negative valuesindicated that the applied atmospheric correction it removedalso part of the water leaving signal while flag values in thecoast suggest that the algorithm is identifying as errors highlycontrasting reflectance values. Variations between Case 1 andCase 2 water limits generation of standard satellite products[19]. These processing algorithms are mainly developed foroceanic waters applications, therefore they are not able <strong>to</strong>recognize as good values, patterns that are typical in coastalwaters. One potential option <strong>to</strong> minimize the number of flagvalues is <strong>to</strong> adjust the different parameters available in theflags menu option within the L2gen command, but thisapproach is not included in this analysis. Table 2 showsreflectance values and in situ R rs 645 nm values obtained inlocations of sampling stations during Oc<strong>to</strong>ber 19, 2005. Thesatellite derived reflectance is considerably lower than in situR rs suggesting a significant effect of atmospheric scattering inthe signal.Stat.IDLatitude(N)Longitude(W)Method 1Reflectanceat 645 nmin situR rs at645 nmI1 18º 16.00’ 67º 12.00’ 0.047406 0.0130O1 18º 16.00’ 67º 15.20’ 0.018792 0.00118I2 18º 14.40’ 67º 11.40’ 0.027528 0.0041O2 18º 14.40’ 67º 11.40’ 0.019948 0.0007O4 18º 12.20’ 67º 12.95’ 0.016265 0.0005I6 18º 10.25’ 67º 11.10’ 0.027037 0.0081O6 18º 10.25’ 67º 14.80’ 0.014844 0.0005Table 2. Pixel values obtained in permanent sampling stationsusing two different image processing methods and in situ R rsat 645 nm.B. <strong>Total</strong> <strong>Suspended</strong> <strong>Sediment</strong> AlgorithmA significant relationship (R 2 =0.73; n=72) was definedbetween TSS (mg/l) and in situ R rs at 645 (Fig. 3a). Thisresult suggests that this region of the spectrum is suitable forTSS estimation using remotely sensed data in these waters.However, a large unknown variability was detected in thisequation that could be reduced by the incorporation of more38
INTERNATIONAL JOURNAL OF SYSTEMS APPLICATIONS, ENGINEERING & DEVELOPMENTIssue 1, Volume 3, 2009(a)(b)(c)0.180.160.14y = 0.0007e 47.755xR 2 = 0.59040.12R rs 645 (sr^-1)0.10.080.060.040.0200 0.02 0.04 0.06 0.08 0.1 0.12-0.02<strong>MODIS</strong> band 1 reflectanceFigure 3. Data used <strong>to</strong> develop a TSS algorithm for Mayaguez Bay; (a) Relationship between in situ R rs at 645 nm and TSS, (b)Two linear equations and (c) one exponential equations defining the relationship between in situ R rs at 645 nm and <strong>MODIS</strong> band1 reflectance.observations. Two linear equations were defined <strong>to</strong> establishthe relation between TSS (mg/l) and R rs at 645 nm (Fig. 3b)because of the presence of an extreme value. The highersquare correlation coefficient (R 2 =0.88; n=30; P
INTERNATIONAL JOURNAL OF SYSTEMS APPLICATIONS, ENGINEERING & DEVELOPMENTIssue 1, Volume 3, 2009Comparison between these validation results indicated thatequation 3 was able <strong>to</strong> better estimate TSS in lowerconcentrations, but during higher concentrations it tended <strong>to</strong>underestimate this parameter. Although equation 1 showed ahigher RMSE, estimated values followed better the tendencyof observed values. The limitations of these algorithms canbe attributed <strong>to</strong> various fac<strong>to</strong>rs: (i) limited data representativeof high TSS concentrations, (ii) <strong>MODIS</strong> band 1 is not capableof detecting TSS signal under low concentrations conditions,(iii) the atmospheric correction method is not appropriate, and(iv) the presence of sea-bot<strong>to</strong>m effect in the signal. Anotherproblem that could be affecting the results is the mixing pixelphenomenon; which is a common and highly influenceproblem when trying <strong>to</strong> derive information from satelliteimagery [20]. In the case of TSS estimations, the mixingpixel occurs when variations in TSS concentrations or landand water areas are combined within the <strong>250</strong> m cover area of apixel. Occurrence of this phenomenon can be reduced byusing images with higher spatial resolution, but this alternativeis limited by current ocean color sensors.(b)D. <strong>Total</strong> <strong>Suspended</strong> <strong>Sediment</strong> ProductsEstimations of TSS were generated using the three developedalgorithms in order <strong>to</strong> spatially analyze results and compareefficiency of the equations. Figure 5 shows spatial variationsassociated <strong>to</strong> TSS concentration in Puer<strong>to</strong> Rico surroundingsareas and Mayagüez Bay for the dates used in the validationanalysis. The spatial variability observed in these productsappeared <strong>to</strong> respond by inshore processes showing higherconcentrations in areas closer <strong>to</strong> the shoreline which aretypical characteristics of coastal environments. In the case ofMayagüez Bay the majority of high values are concentrated inthe northern part of the bay where the Añasco River plume islocated. Comparison between all three different algorithmsdoes not indicate any significant difference between them; themain difference resides in algorithm 3 which range of valuesis considerably higher than the algorithm 1 and 2. Therefore,application of algorithm 3 resulted on sharper spatialvariations when comparing values in inshore and offshoreareas.(c)Figure 4. Validation results when applying (a) equation 1, (b)equation 2 and (c) equation 3.(a)40
INTERNATIONAL JOURNAL OF SYSTEMS APPLICATIONS, ENGINEERING & DEVELOPMENTIssue 1, Volume 3, 2009(a) February 12, 2004Algorithm 1Algorithm 2Algorithm 341
INTERNATIONAL JOURNAL OF SYSTEMS APPLICATIONS, ENGINEERING & DEVELOPMENTIssue 1, Volume 3, 2009b) March 8, 2006Algorithm 1Algorithm 2Algorithm 3Figure 5. TSS products generated using three developed algorithms based on <strong>MODIS</strong> band 1 data for two dates (a)February 12, 2004 and (b) March 8, 2006. Mayagüez Bay indicated with the red box and a close up is shown on the rightside. Note the differences in scale values of the color palettes.42
INTERNATIONAL JOURNAL OF SYSTEMS APPLICATIONS, ENGINEERING & DEVELOPMENTIssue 1, Volume 3, 2009TSS estimated values corresponding <strong>to</strong> Mayagüez Bay areawere extracted and analyzed using basic statistics. Figure 6illustrates the distribution of TSS values using both fielddata (Study Period: January 2004-Oc<strong>to</strong>ber 2006) andgenerated TSS products for February 12, 2004. Directcomparison between these data sets has been madeconsidering the following statements: (i) sampling stationsare distributed along the bay covering inshore and offshoreareas (ii) TSS measurements used in this analysis includesonly surface samples (iii) selected date for this analysis(February 12, 2004) presents commonly occurrenceconditions in this bay. Mean values for all products (4.6,5.0, 5.6 mg/l) were highly comparable <strong>to</strong> in situ mean value(5.9 mg/l) and all showed positive skewed distributions(Fig. 6). Minimum values of algorithms 2 and 3 (> 3.0mg/l) indicates that these results can be overestimatedconsidering that this analysis includes areas where TSSconcentrations are normally lower than 2.0 mg/l (e.g.offshore in the southern part of the bay). Algorithm 1presented the higher similarity with the distribution of insitu TSS measurements (Fig. 6b). However, in order <strong>to</strong>determine which estimations better followed realconditions, spatial analysis of in situ measurement of thatparticular day should be incorporated.(a)(b)(c)(d)Figure 6. Descriptive statistics and his<strong>to</strong>grams illustrating TSS values distribution for (a) in situ measurements collected withinthe study period (January 2004-Oc<strong>to</strong>ber 2006) and TSS products generated using (b) algorithm 1, (c) algorithm 2 and (d)algorithm 3.43
INTERNATIONAL JOURNAL OF SYSTEMS APPLICATIONS, ENGINEERING & DEVELOPMENTIssue 1, Volume 3, 2009IV. CONCLUSION\Geometric and radiometric corrections utilized duringimage pre-processing routines are crucial for this type ofanalysis. Atmospheric correction included in L2gencommand (SeaDAS) is not suitable for application inMayagüez Bay waters. This same result is expected <strong>to</strong> findin other tropical bays. Fairly good empirical relationshipwere defined between in situ R rs , TSS and <strong>MODIS</strong> band 1data using linear and exponential equations. Application ofdeveloped equations resulted on TSS products able <strong>to</strong>detect spatial variations associated <strong>to</strong> typical patterns ofcoastal environments. Algorithm 3 showed the highercorrespondence between observed and estimated values(RMSE 4.76 mg/l). However, all three algorithms resultedin reasonable TSS pixel values when compared with datafrom in situ measurements therefore at this point none ofthe algorithms is excluded for future application. <strong>Using</strong> anexponential equation resulted in a more suitable approachfor this study purpose, since the algorithm including thisequation was more effective estimating low values whichare the dominant conditions in the studied bay. Validationresults can be improved by addressing limiting fac<strong>to</strong>rs suchas lacking of data corresponding <strong>to</strong> high concentrations,and contamination by the remaining atmospheric effect inthe derived reflectance of the sensor. The results obtainedin this study provide a baseline <strong>to</strong> develop TSS operationalproducts for tropical coastal waters by developingpreliminary products and identifying potential errors andlimiting fac<strong>to</strong>rs in the process.ACKNOWLEDGMENTWe are grateful <strong>to</strong> Dr. Nazario Ramirez who presented thiswork in The 8th WSEAS International Conference onInstrumentation, Measurement, Circuits and Systems(IMCAS ’09). We also would like <strong>to</strong> acknowledge Dr.Ramón López who provided great support during thedevelopment of the study, and Joaquín Trinanes for givinghelpful recommendations. Special thanks <strong>to</strong> Patrick Reyesand José Martinez for helping in getting and processing partthe data presented. Our appreciation <strong>to</strong> all the people thatcollaborated in the field and labora<strong>to</strong>ry work.REFERENCES[1] Wang, X., Wang, Q., Liu, G. and Li, H., A study on the QuantitativeRemote Sensing Model for the <strong>Suspended</strong> <strong>Sediment</strong> Concentration inCoastal Water with ASTER Conference paper, 2005, Report no.A290054.[2] Hu, C., Chen, Z., Clay<strong>to</strong>n, T.D., Swarzenski, P., Brock J.C. and Muller-Karger F.E., Assessment of estuarine water-quality indica<strong>to</strong>rs using<strong>MODIS</strong> medium-resolution bands: Initial results from Tampa Bay,FL, Remote Sensing of Environment, Vol.93, 2004, pp.423-441.[3] Chen, Z., Hu, C. and Muller-Karger, F., Moni<strong>to</strong>ring turbidity in TampaBay using <strong>MODIS</strong>/Aqua <strong>250</strong>-m imagery. Remote Sensing ofEnvironment, Vol. 109, 2007, pp.207–220.[4] Miller, R.L., McKee, B.A. and D’Sa, E.J., (eds.) Moni<strong>to</strong>ring bot<strong>to</strong>msediment resuspension and suspended sediments in shallow coastalwaters, Remote Sensing of Coastal Aquatic Environment, 259-276,Springer, Printed in the Netherlands.[5] Peckhman, S.D., A new method for estimating suspended sedimentconcentrations and deposition rates from satellite imagery based onthe physics of plumes, Computers Geosciences, Vol. 24, 2007,pp.1198-1222.[6] Li, R. and Li, J., Satellite Remote Sensing Technology for Lake WaterClarity Moni<strong>to</strong>ring: An Overview, Environmental InformaticsArchives, Vol. 2, 2004, 893-901.[7] Moore, G. F., Aiken, J., & Lavander, S. J., The atmospheric correctionof water colour and the quantitative retrieval of suspended particulatematter in Case II waters: application <strong>to</strong> MERIS. InternationalJournal of Remote Sensing, Vol. 20, No. 9, 1999, pp. 1713-1733.[8] Doxaran, D., Froidefond, J., & Castaing, P., A reflectance band ratioused <strong>to</strong> estimate suspended matter concentrations in sedimentdominated coastal waters. International Journal of Remote Sensing,Vol. 23, No. 23, 2002, 5079– 5085.[9] Teodoro A.C., Veloso-Gomes, F. and Goncalves, H., StatisticalTechniques for Correlating <strong>Total</strong> <strong>Suspended</strong> Matter Concentrationwith Seawater Reflectance <strong>Using</strong> Multispectral Satellite Data,Journal of Coastal Research, Vol. 24, No. 4C, 2008, 40-49.[10]Chen, Z., Hu, C. & Muller-Karger, F.. Moni<strong>to</strong>ring turbidity in TampaBay using <strong>MODIS</strong>/Aqua <strong>250</strong>-m imagery, Remote Sensing ofEnvironment, Vol. 109, 2007, pp. 207–220.[11] Miller, R. L. & McKee, B. A., <strong>Using</strong> <strong>MODIS</strong> Terra <strong>250</strong> m imagery <strong>to</strong>map concentration of <strong>to</strong>tal suspended matter in coastal waters,Remote Sensing of Environment, 2004, Vol. 93, 259-366.[12] Nasr A.H., El Leithy, B.M., Helmy, A.K., Assessment of Some WaterQuality Parameters <strong>Using</strong> <strong>MODIS</strong> Data along the Red Sea Coast,Egypt, Proc. of 3rd WSEAS International Conference on RemoteSensing, Venice, Italy, November 21-23, 2007, 570-423.[13] Hellweger, F. L., Schlosser, P. & Weissel, J. K., Use of satelliteimagery for water quality studies in New York Harbor, Estuarine,Coastal and Shelf Science, Vol. 61, 2004,437-448.[14] Rosado-Torres, M., Evaluation And Development Of Bio-OpticalAlgorithms For Chlorophyll Retrieval In Western Puer<strong>to</strong> Rico,University of Puer<strong>to</strong> Rico at Mayaguez, Department of MarineSciences, 2008, 116 pages.[15] Austin, R., The remote sensing of spectral radiance from below theocean surface. In: N. G. Jerlov, & E. Steemann Nielsen (Eds.),Optical aspects of oceanography, 1974, London, New York:Academic Press, pp. 317-344.[16] Mueller, J. L., Morel, A., Frouin, R. T. Davis C., Arnone, R., Carder,K., Lee, Z. P., Steward, R. G., Hooker S., Mobley C. D., McLean S.,Holben B., Miller M., Pietras C., Knobelspiesse K. D., Fargion G. S.,Porter J. & Voss K, Ocean optics pro<strong>to</strong>cols for Satellite Ocean Colorvalidation, Revision 4, Volume III: Radiometric Measurements andData Analysis Pro<strong>to</strong>cols, 2003, In Mueller J.L., Fargion G. S. andMcClain C.R. (Eds.). NASA/TM 2003-21621, Greenbelt, MD: NASAGoddard Space Flight Center, pp. 28-29.[17] Strickland, J.H.D. and Parsons, T.R., A practical handbook of seawateranalysis, Bull. J. Fish. Res. Bd. Can, Vol.167, 1972, pp. 311.[18] OceanColor Webmaster, 2008http://oceancolor.gsfc.nasa.gov/seadas/doc/l2gen/l2gen.html[19] Guerriero, A., Matarrese, R., Morea, A., Tijani, K., A Grid EnabledLook-Up Table for Aerosol Optical Thickness Estimation on CoastalWater, Proc. of the 9th WSEAS Int. Conf. on Mathematical andComputational Methods in Science and Engineering, Trinidad andTobago, November 5-7, 2007, 137-140.[20] Roosta, H., Farhoudi, R., Roosta, M., Multi Temporal Disaggregationof <strong>MODIS</strong> Images <strong>Using</strong> Non-Linear Analysis, Proc. of 5 th WSEASInt. Conf. on Environment, Ecosystems and Development, Tenerife,Spain, December 14-16, 2007, 222-227.44