Question and Questionnaire Design - Stanford University
Question and Questionnaire Design - Stanford University
Question and Questionnaire Design - Stanford University

You also want an ePaper? Increase the reach of your titles
YUMPU automatically turns print PDFs into web optimized ePapers that Google loves.
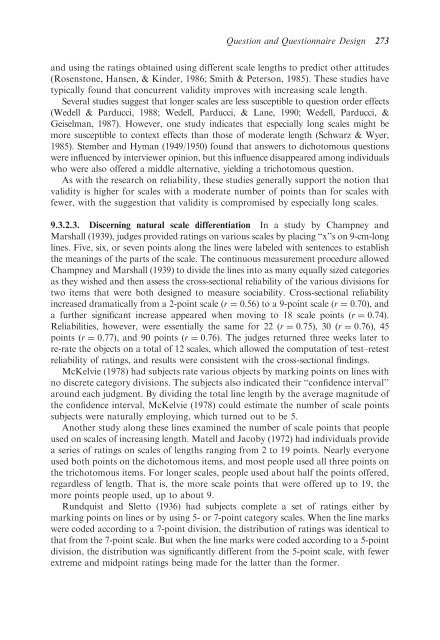
<strong>Question</strong> <strong>and</strong> <strong>Question</strong>naire <strong>Design</strong> 273<strong>and</strong> using the ratings obtained using different scale lengths to predict other attitudes(Rosenstone, Hansen, & Kinder, 1986; Smith & Peterson, 1985). These studies havetypically found that concurrent validity improves with increasing scale length.Several studies suggest that longer scales are less susceptible to question order effects(Wedell & Parducci, 1988; Wedell, Parducci, & Lane, 1990; Wedell, Parducci, &Geiselman, 1987). However, one study indicates that especially long scales might bemore susceptible to context effects than those of moderate length (Schwarz & Wyer,1985). Stember <strong>and</strong> Hyman (1949/1950) found that answers to dichotomous questionswere influenced by interviewer opinion, but this influence disappeared among individualswho were also offered a middle alternative, yielding a trichotomous question.As with the research on reliability, these studies generally support the notion thatvalidity is higher for scales with a moderate number of points than for scales withfewer, with the suggestion that validity is compromised by especially long scales.9.3.2.3. Discerning natural scale differentiation In a study by Champney <strong>and</strong>Marshall (1939), judges provided ratings on various scales by placing ‘‘x’’s on 9-cm-longlines. Five, six, or seven points along the lines were labeled with sentences to establishthe meanings of the parts of the scale. The continuous measurement procedure allowedChampney <strong>and</strong> Marshall (1939) to divide the lines into as many equally sized categoriesas they wished <strong>and</strong> then assess the cross-sectional reliability of the various divisions fortwo items that were both designed to measure sociability. Cross-sectional reliabilityincreased dramatically from a 2-point scale (r ¼ 0.56) to a 9-point scale (r ¼ 0.70), <strong>and</strong>a further significant increase appeared when moving to 18 scale points (r ¼ 0.74).Reliabilities, however, were essentially the same for 22 (r ¼ 0.75), 30 (r ¼ 0.76), 45points (r ¼ 0.77), <strong>and</strong> 90 points (r ¼ 0.76). The judges returned three weeks later tore-rate the objects on a total of 12 scales, which allowed the computation of test–retestreliability of ratings, <strong>and</strong> results were consistent with the cross-sectional findings.McKelvie (1978) had subjects rate various objects by marking points on lines withno discrete category divisions. The subjects also indicated their ‘‘confidence interval’’around each judgment. By dividing the total line length by the average magnitude ofthe confidence interval, McKelvie (1978) could estimate the number of scale pointssubjects were naturally employing, which turned out to be 5.Another study along these lines examined the number of scale points that peopleused on scales of increasing length. Matell <strong>and</strong> Jacoby (1972) had individuals providea series of ratings on scales of lengths ranging from 2 to 19 points. Nearly everyoneused both points on the dichotomous items, <strong>and</strong> most people used all three points onthe trichotomous items. For longer scales, people used about half the points offered,regardless of length. That is, the more scale points that were offered up to 19, themore points people used, up to about 9.Rundquist <strong>and</strong> Sletto (1936) had subjects complete a set of ratings either bymarking points on lines or by using 5- or 7-point category scales. When the line markswere coded according to a 7-point division, the distribution of ratings was identical tothat from the 7-point scale. But when the line marks were coded according to a 5-pointdivision, the distribution was significantly different from the 5-point scale, with fewerextreme <strong>and</strong> midpoint ratings being made for the latter than the former.