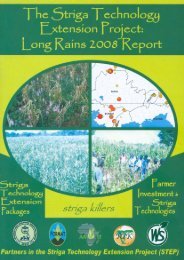
Baseline Study of Striga Control using IR Maize in Western Kenya
Baseline Study of Striga Control using IR Maize in Western Kenya
Baseline Study of Striga Control using IR Maize in Western Kenya
You also want an ePaper? Increase the reach of your titles
YUMPU automatically turns print PDFs into web optimized ePapers that Google loves.
Figures <strong>in</strong> brackets <strong>in</strong>dicate number <strong>of</strong> valid entries <strong>in</strong> analysisFigure 2.1. Mode <strong>of</strong> land acquisition <strong>in</strong> western <strong>Kenya</strong>60% <strong>of</strong> household heads50403020100PrivatetitleUse right Gift Rent<strong>in</strong>g Borrow<strong>in</strong>gMaleFemaleType <strong>of</strong> land tenureThe analysis on land utilisation <strong>in</strong>dicates that 68% <strong>of</strong> total farmland is allocated to annualcrops (Table 2.3). 29.6% is allocated to perennial crops, graz<strong>in</strong>g, fallow and rented/given out.Smallholders <strong>in</strong> <strong>Western</strong> cultivate more perennial crops than the ones <strong>in</strong> Nyanza. In bothprov<strong>in</strong>ces, fallow land is very small, which could lead to problems <strong>of</strong> soil fertility because <strong>of</strong>cont<strong>in</strong>uous cropp<strong>in</strong>g <strong>in</strong> the absence <strong>of</strong> soil fertility amendments. In fact, low soil fertility wasranked second as the major cause <strong>of</strong> food shortage <strong>in</strong> both prov<strong>in</strong>ces next to <strong>Striga</strong>.Table 2.3. Land utilisationAll Nyanza <strong>Western</strong>Total farmland (ha) 1.31 (780) 1.25 (389) 1.37 (391)Annual crops (% <strong>of</strong> total farmland) 68.0 (770) 70.5 (384) 66.0(386)Perennial crops (% <strong>of</strong> total farmland) 12.1 (366) 6.6 (95) 17.3 (271)Graz<strong>in</strong>g (% <strong>of</strong> total farmland) 8.9 (237) 11.6 (116) 6.0 (121)Fallow (% <strong>of</strong> total farmland) 8.8 (230) 9.6 (107) 8.1 (123)Rented/given out (% <strong>of</strong> total farmland) 2.2 (62) 1.7 (24) 2.6 (28)Total percentage 100 100 100Figures <strong>in</strong> brackets <strong>in</strong>dicate number <strong>of</strong> valid entries <strong>in</strong> analysis2.2.2 F<strong>in</strong>ancial capitalF<strong>in</strong>ancial capital <strong>in</strong>cludes cash and cash related property. It is a form <strong>of</strong> asset that cancontribute to both production and consumption <strong>in</strong> the household.Remittances appear to be the commonest form <strong>of</strong> f<strong>in</strong>ancial capital for the respondents,followed by <strong>in</strong>formal credit and cash sav<strong>in</strong>gs (Figure 2.2). Other forms <strong>of</strong> f<strong>in</strong>ancial capital,which are not very common <strong>in</strong> the area, are formal credit and sales <strong>of</strong> jewelleries. In Bondoand Nyando districts no respondent kept f<strong>in</strong>ancial capital <strong>in</strong> form <strong>of</strong> jewellery and less than50% <strong>of</strong> respondents obta<strong>in</strong> remittances.16


