Baseline Study of Striga Control using IR Maize in Western Kenya
Baseline Study of Striga Control using IR Maize in Western Kenya
Baseline Study of Striga Control using IR Maize in Western Kenya

Create successful ePaper yourself
Turn your PDF publications into a flip-book with our unique Google optimized e-Paper software.
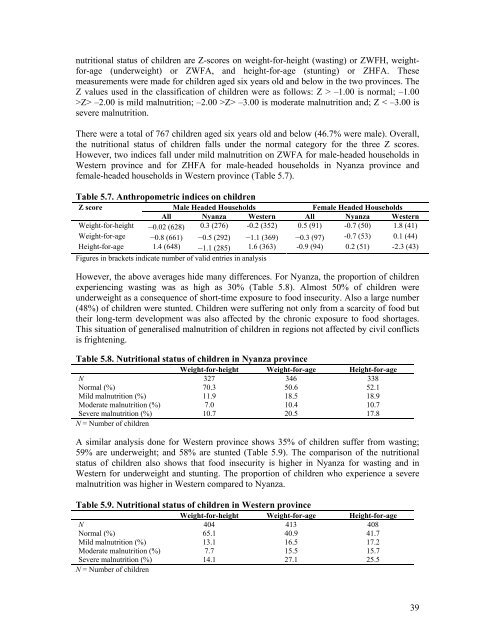
nutritional status <strong>of</strong> children are Z-scores on weight-for-height (wast<strong>in</strong>g) or ZWFH, weightfor-age(underweight) or ZWFA, and height-for-age (stunt<strong>in</strong>g) or ZHFA. Thesemeasurements were made for children aged six years old and below <strong>in</strong> the two prov<strong>in</strong>ces. TheZ values used <strong>in</strong> the classification <strong>of</strong> children were as follows: Z > –1.00 is normal; –1.00>Z> –2.00 is mild malnutrition; –2.00 >Z> –3.00 is moderate malnutrition and; Z < –3.00 issevere malnutrition.There were a total <strong>of</strong> 767 children aged six years old and below (46.7% were male). Overall,the nutritional status <strong>of</strong> children falls under the normal category for the three Z scores.However, two <strong>in</strong>dices fall under mild malnutrition on ZWFA for male-headed households <strong>in</strong><strong>Western</strong> prov<strong>in</strong>ce and for ZHFA for male-headed households <strong>in</strong> Nyanza prov<strong>in</strong>ce andfemale-headed households <strong>in</strong> <strong>Western</strong> prov<strong>in</strong>ce (Table 5.7).Table 5.7. Anthropometric <strong>in</strong>dices on childrenZ scoreMale Headed HouseholdsFemale Headed HouseholdsAll Nyanza <strong>Western</strong> All Nyanza <strong>Western</strong>Weight-for-height –0.02 (628) 0.3 (276) -0.2 (352) 0.5 (91) -0.7 (50) 1.8 (41)Weight-for-age –0.8 (661) –0.5 (292) –1.1 (369) –0.3 (97) -0.7 (53) 0.1 (44)Height-for-age 1.4 (648) –1.1 (285) 1.6 (363) -0.9 (94) 0.2 (51) -2.3 (43)Figures <strong>in</strong> brackets <strong>in</strong>dicate number <strong>of</strong> valid entries <strong>in</strong> analysisHowever, the above averages hide many differences. For Nyanza, the proportion <strong>of</strong> childrenexperienc<strong>in</strong>g wast<strong>in</strong>g was as high as 30% (Table 5.8). Almost 50% <strong>of</strong> children wereunderweight as a consequence <strong>of</strong> short-time exposure to food <strong>in</strong>security. Also a large number(48%) <strong>of</strong> children were stunted. Children were suffer<strong>in</strong>g not only from a scarcity <strong>of</strong> food buttheir long-term development was also affected by the chronic exposure to food shortages.This situation <strong>of</strong> generalised malnutrition <strong>of</strong> children <strong>in</strong> regions not affected by civil conflictsis frighten<strong>in</strong>g.Table 5.8. Nutritional status <strong>of</strong> children <strong>in</strong> Nyanza prov<strong>in</strong>ceWeight-for-height Weight-for-age Height-for-ageN 327 346 338Normal (%) 70.3 50.6 52.1Mild malnutrition (%) 11.9 18.5 18.9Moderate malnutrition (%) 7.0 10.4 10.7Severe malnutrition (%) 10.7 20.5 17.8N = Number <strong>of</strong> childrenA similar analysis done for <strong>Western</strong> prov<strong>in</strong>ce shows 35% <strong>of</strong> children suffer from wast<strong>in</strong>g;59% are underweight; and 58% are stunted (Table 5.9). The comparison <strong>of</strong> the nutritionalstatus <strong>of</strong> children also shows that food <strong>in</strong>security is higher <strong>in</strong> Nyanza for wast<strong>in</strong>g and <strong>in</strong><strong>Western</strong> for underweight and stunt<strong>in</strong>g. The proportion <strong>of</strong> children who experience a severemalnutrition was higher <strong>in</strong> <strong>Western</strong> compared to Nyanza.Table 5.9. Nutritional status <strong>of</strong> children <strong>in</strong> <strong>Western</strong> prov<strong>in</strong>ceWeight-for-height Weight-for-age Height-for-ageN 404 413 408Normal (%) 65.1 40.9 41.7Mild malnutrition (%) 13.1 16.5 17.2Moderate malnutrition (%) 7.7 15.5 15.7Severe malnutrition (%) 14.1 27.1 25.5N = Number <strong>of</strong> children39