3-1 Solutions to Chapter 3 Accounting and Finance 1. Sophie's ...
3-1 Solutions to Chapter 3 Accounting and Finance 1. Sophie's ...
3-1 Solutions to Chapter 3 Accounting and Finance 1. Sophie's ...
- No tags were found...

Create successful ePaper yourself
Turn your PDF publications into a flip-book with our unique Google optimized e-Paper software.
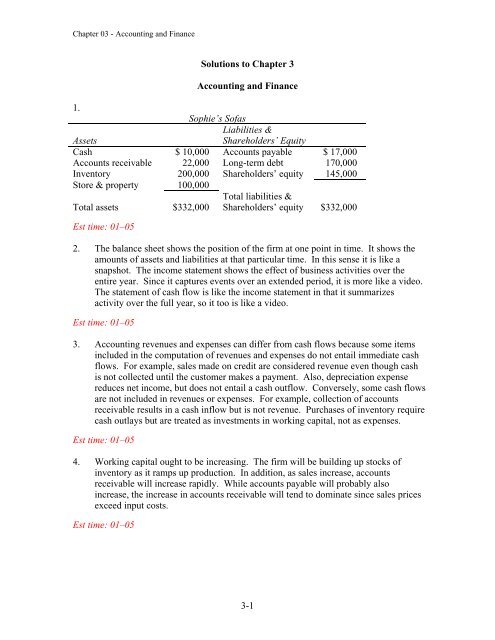
<strong>Chapter</strong> 03 - <strong>Accounting</strong> <strong>and</strong> <strong>Finance</strong><strong>Solutions</strong> <strong>to</strong> <strong>Chapter</strong> 3<strong>Accounting</strong> <strong>and</strong> <strong>Finance</strong><strong>1.</strong>Sophie’s SofasLiabilities &AssetsShareholders’ EquityCash $ 10,000 Accounts payable $ 17,000Accounts receivable 22,000 Long-term debt 170,000Inven<strong>to</strong>ry 200,000 Shareholders’ equity 145,000S<strong>to</strong>re & property 100,000Total assets $332,000Est time: 01–05Total liabilities &Shareholders’ equity $332,0002. The balance sheet shows the position of the firm at one point in time. It shows theamounts of assets <strong>and</strong> liabilities at that particular time. In this sense it is like asnapshot. The income statement shows the effect of business activities over theentire year. Since it captures events over an extended period, it is more like a video.The statement of cash flow is like the income statement in that it summarizesactivity over the full year, so it <strong>to</strong>o is like a video.Est time: 01–053. <strong>Accounting</strong> revenues <strong>and</strong> expenses can differ from cash flows because some itemsincluded in the computation of revenues <strong>and</strong> expenses do not entail immediate cashflows. For example, sales made on credit are considered revenue even though cashis not collected until the cus<strong>to</strong>mer makes a payment. Also, depreciation expensereduces net income, but does not entail a cash outflow. Conversely, some cash flowsare not included in revenues or expenses. For example, collection of accountsreceivable results in a cash inflow but is not revenue. Purchases of inven<strong>to</strong>ry requirecash outlays but are treated as investments in working capital, not as expenses.Est time: 01–054. Working capital ought <strong>to</strong> be increasing. The firm will be building up s<strong>to</strong>cks ofinven<strong>to</strong>ry as it ramps up production. In addition, as sales increase, accountsreceivable will increase rapidly. While accounts payable will probably alsoincrease, the increase in accounts receivable will tend <strong>to</strong> dominate since sales pricesexceed input costs.Est time: 01–053-1
<strong>Chapter</strong> 03 - <strong>Accounting</strong> <strong>and</strong> <strong>Finance</strong>5. a. Taxes = (0.10 $8,500) + 0.15 ($20,000 $8,500) = $2,575Average tax rate = $2,575/$20,000 = 0.12875 = 12.88%Marginal tax rate = 15%b. Taxes = (0.10 $8,500) + 0.15 ($34,500 $8,500) + 0.25 ($50,000 $34,500)= $8,625Average tax rate = $8,625/$50,000 = 0.1725 = 17.25%Marginal tax rate = 25%c. Taxes = (0.10 $8,500) + 0.15 ($34,500 $8,500) + 0.25 ($83,600 $34,500)+ 0.28 ($174,400 $83,600) + 0.33 ($300,000 $174,400) = $83,897Average tax rate = $83,897/$300,000 = 0.279657 = 27.97%Marginal tax rate = 33%d. Taxes = (0.10 $8,500) + 0.15 ($34,500 $8,500) + 0.25 ($83,600 $34,500)+ 0.28 ($174,400 $83,600) + 0.33 ($379,150 $174,400)+ 0.35 ($3,000,000 – $379,150) = $1,027,314Est time: 06–10Average tax rate = $1,027,314/$3,000,000 = 0.342438 = 34.24%Marginal tax rate = 35%6. Taxes = (0.15 $50,000) + 0.25 ($75,000 $50,000) + 0.34 ($100,000 $75,000)= $22,250Average tax rate = $22,250/$100,000 = 0.2225 = 22.25%Marginal tax rate = 34%Est time: 01–057. Taxes = (0.10 $17,000) + 0.15 ($69,000 $17,000) + 0.25 ($95,000 $69,000)= $16,000Average tax rate = $16,000/$95,000 = 0.168421 = 16.84%Marginal tax rate = 25%Est time: 01–053-2
<strong>Chapter</strong> 03 - <strong>Accounting</strong> <strong>and</strong> <strong>Finance</strong>8. a. Cash will increase as one current asset (inven<strong>to</strong>ry) is exchanged for another (cash).b. Cash will increase. The machine will bring in cash when it is sold, but the leasepayments will be made over several years.c. The firm will use cash <strong>to</strong> buy back the shares from existing shareholders. Cashbalance will decrease.Est time: 01–059. a. The fact that start-up firms typically have negative net cash flows for several yearsdoes not mean they are failing. Start-up firms invest in inven<strong>to</strong>ries <strong>and</strong> other assetsdesigned <strong>to</strong> produce income in later periods.b. <strong>Accounting</strong> profits for start-up businesses are also commonly negative because thesefirms incur costs, such as advertising, that cannot be recorded on the balance sheet.These costs are general administrative expenses the firm incurs in each period, notinvestments like those in inven<strong>to</strong>ries that are built up for future sales.Est time: 06–1010. a. In early 2010 inves<strong>to</strong>rs saw the value of assets on the books of these banks as worthless than the value recorded, which may be his<strong>to</strong>rical value. Loans are the primaryassets for banks, <strong>and</strong> inves<strong>to</strong>rs perceived a high likelihood that the loans these banksmade would default. If so, the banks would need <strong>to</strong> write down their values, reducingincome available <strong>to</strong> shareholders.b. In contrast <strong>to</strong> the banks, inves<strong>to</strong>rs perceived the assets of this company <strong>to</strong> be worthmore than the his<strong>to</strong>rical value presented on the company’s book. Consistent with theanalysis in part (a), shareholders in this company are expecting <strong>to</strong> have higher incomein future periods, <strong>and</strong> the value of the company’s assets are expected <strong>to</strong> grow.Est time: 01–053-3
<strong>Chapter</strong> 03 - <strong>Accounting</strong> <strong>and</strong> <strong>Finance</strong>Total taxes = $8,625 + $7,500 = $16,125Total taxes are reduced by $18,125 $16,125 = $2,000.Est time: 06–1014. a. Book value equals the $200,000 the founder of the firm has contributed in tangibleassets. Market value equals the value of his patent plus the value of the productionplant: $50,000,000 + $200,000 = $50,200,000.b. Price per share = $50.2 million/2 million shares = $25.10Book value per share = $200,000/2 million shares = $0.10Est time: 01–0515.Sales $10,000Cost of goods sold 6,500General & administrative expenses 1,000Depreciation expense 1,000EBIT 1,500Interest expense 500Taxable income 1,000Taxes (35%) 350Net income $ 650Cash flow from operations = net income + depreciation expense = $1,650Est time: 06–1016. Cash flow from operations can be positive even if net income is negative. For example,if depreciation expenses are large, then negative net income might correspond <strong>to</strong> positivecash flow because depreciation is treated as an expense in calculating net income butdoes not represent a cash outflow.Conversely, if net income is positive, but a large portion of sales are made on credit, cashflow can be negative since the sales are revenue but do not yet generate cash. Look back<strong>to</strong> Table 3.4 <strong>and</strong> you will see that increases in accounts receivable reduce cash providedby operations.Est time: 01–053-5
<strong>Chapter</strong> 03 - <strong>Accounting</strong> <strong>and</strong> <strong>Finance</strong>17. The calculations are presented in the following table. Sales occur in quarters 2 <strong>and</strong> 3, sothis is when the cost of goods sold is recognized. Therefore, net income is zero inquarters 1 <strong>and</strong> 4. In quarter 1, the production of the kits is treated as an investment ininven<strong>to</strong>ries. The level of inven<strong>to</strong>ries then falls as goods are sold in quarters 2 <strong>and</strong> 3.Accounts receivable in quarters 2 <strong>and</strong> 3 equal the sales in those quarters since it takes onequarter for receivables <strong>to</strong> be collected. Notice that cash flow in quarter 1 equals the cos<strong>to</strong>f producing the kits <strong>and</strong> that in quarters 3 <strong>and</strong> 4 cash flow equals cash received for thekits previously sold.a. Quarter 1 Quarter 2 Quarter 3 Quarter 4Sales $0 $550 $600 $ 0Cost of goods sold 0 500 500 0Net income $0 $ 50 $100 $ 0b., c.Inven<strong>to</strong>ries $1,000 $ 500 $ 0 $0Accounts receivable 0 550 600 0Net working capital $1,000 $1,050 $600 $0Cash flow $1,000 $0 $550 $600Cash flow = net income – change in net working capitalEst time: 11–1518. Cash flow = profits accounts receivable 10,000+ accounts payable + 5,000 inven<strong>to</strong>ry(2,000)Cash flow = profits 10,000 + 5,000 (2,000) = profits 3,000Therefore, cash flow is $3,000 less than profits. This corresponds <strong>to</strong> the increase of $3,000in net working capital.Est time: 06–103-6
<strong>Chapter</strong> 03 - <strong>Accounting</strong> <strong>and</strong> <strong>Finance</strong>19. a. If the firm paid income taxes of $2,000, <strong>and</strong> the average tax rate was 20%,then taxable income must have been: $2,000/0.20 = $10,000.Therefore: Net income = taxable income taxes = $8,000b.Revenues $ ??? Cost of goods sold 8,000 Administrative expenses 3,000 Depreciation expense 1,000 Interest expense 1,000Taxable income $10,000 [from part (a)]We conclude that revenues were $23,000.c.Revenues $23,000 Cost of goods sold 8,000 Administrative expenses 3,000 Depreciation expense 1,000EBIT $11,000Est time: 06–1020. a.Sales$14.00 million Cost of goods sold 8.00 Interest expense <strong>1.</strong>00 Depreciation expense 2.00Taxable income 3.00 Taxes (35%) <strong>1.</strong>05Net income$ <strong>1.</strong>95 millionCash flow = net income + depreciation expense = $3.95 millionb. If depreciation expense were increased by $1 million, net income would bereduced by $0.65 million. Cash flow (= net income + depreciation) would beincreased by $0.65 million + $1 million = $0.35 million.Cash flow increases because depreciation expense is not a cash outflow, butincreasing the depreciation expense for tax purposes reduces taxes paid by$0.35 million.3-7
<strong>Chapter</strong> 03 - <strong>Accounting</strong> <strong>and</strong> <strong>Finance</strong>c. The impact on s<strong>to</strong>ck price is likely <strong>to</strong> be positive. Cash available <strong>to</strong> the firmwould increase. The reduction in net income would be recognized asresulting entirely from accounting changes, not as a consequence of anychanges in the underlying profitability of the firm.d. If interest expense were $1 million higher, both net income <strong>and</strong> cash flowwould decrease by $0.65 million, i.e., by the $1 million increase in expensesless the $0.35 million reduction in taxes. This differs from part (b) because, incontrast <strong>to</strong> depreciation, interest expense represents an actual cash outlay.Est time: 11–152<strong>1.</strong>C<strong>and</strong>y Canes, Inc.April May JuneSales $ 0 $150,000 $ 0Cost of goods sold 0 100,000 0Accounts receivable 0 150,000 150,000Inven<strong>to</strong>ry 100,000 100,000 0Cash flow* 100,000 0 150,000Net income** $ 0 $ 50,000 $ 0*Cash flow = sales COGS A/R inven<strong>to</strong>ry** Net income = sales COGSEst time: 06–1022.Assets 2010 2011Liabilities <strong>and</strong>Owners’ Equity 2010 2011Current assets 310 420 Current liabilities 210 240Net fixed assets 1,200 1,420 Long-term debt 830 920Total assets 1,510 1,840 Total liabilities 1,040 1,160Owners’ equity 470 680Total 1,510 1,840a. Owners’ equity = <strong>to</strong>tal assets <strong>to</strong>tal liabilities (as shown in the balance sheet above)b. If the firm issued no s<strong>to</strong>ck, the increase in owners’ equity must be due entirely <strong>to</strong>retained earnings. Since owners’ equity increased by $210 <strong>and</strong> dividends were $100,net income must have been $310.3-8
<strong>Chapter</strong> 03 - <strong>Accounting</strong> <strong>and</strong> <strong>Finance</strong>c. Since net fixed assets increased by $220, <strong>and</strong> the firm purchased $300 of new fixedassets, the depreciation charge must have been $80.d. Net working capital increased by $80, from ($310 $210) = $100 in 2010 <strong>to</strong>($420 $240) = $180 in 201<strong>1.</strong>e. Since long-term debt increased by $90, <strong>and</strong> the firm issued $200 of new long-termdebt, $110 of outst<strong>and</strong>ing debt must have been paid off.Est time: 11–1523. a. Shareholders’ equity = <strong>to</strong>tal assets <strong>to</strong>tal liabilities2010: Shareholders’ equity = $890 $650 = $2402011: Shareholders’ equity = $1,040 $810 = $230b. Net working capital = current assets current liabilities2010: Net working capital = $90 $50 = $402011: Net working capital = $140 $60 = $80c. Taxable income = $1,950 $1,030 $350 $240 = $330Taxes paid = 0.35 $330 = $115.50Net income = $214.50d. Net income $214.50Decrease (increase) in current assets (50.00)Increase in current liabilities 10.00Cash provided by operations $174.50e. Gross investment = increase in net fixed assets + depreciation= $100 + $350 = $450f. Current liabilities increased by $10. Therefore, current liabilities other thanaccounts payable must have increased by $45.Est time: 11–153-9
<strong>Chapter</strong> 03 - <strong>Accounting</strong> <strong>and</strong> <strong>Finance</strong>24.Assets 2010 2011Liabilities <strong>and</strong>Shareholders’ Equity 2010 2011Cash & marketable securities $ 800 $ 300 Accounts payable $ 300 $ 350Inven<strong>to</strong>ries 300 350 Notes payable 1,000 600Accounts receivable 400 450 Long-term debt 2,000 2,400Net fixed assets 5,000 5,800 Total liabilities 3,300 3,350Total assets $6,500 $6,900 Shareholders’ equity 3,200 3,550Total liabilities plusshareholders’ equity $6,500 $6,900Est time: 06–1025. Net working capital (2010) = ($800 + $300 + $400) ($300 + $1,000) = $200Net working capital (2011) = ($300 + $350 + $450) ($350 + $600) = $150Net working capital decreased by $50.Est time: 01–0526.2010 2011Revenue $4,000 $4,100Cost of goods sold 1,600 1,700Administrative expenses 500 550Depreciation expense 500 520Interest expense 150 150Taxable income 1,250 1,180Federal & state income taxes 400 420Net income $ 850 $ 760Increase in retained earnings in 2011 = net income dividends = $760 $410 = $350In 2011, shareholders’ equity increased by the amount of the increase in retained earnings.Est time: 06–1027. Earnings per share in 2010 = $850,000/500,000 shares = $<strong>1.</strong>70Earnings per share in 2011 = $760,000/500,000 shares = $<strong>1.</strong>52Est time: 01–053-10
<strong>Chapter</strong> 03 - <strong>Accounting</strong> <strong>and</strong> <strong>Finance</strong>28. Average tax bracket in 2010 = taxes/taxable income = $400/$1,250 = 0.320 = 32.0%Average tax bracket in 2011 = $420/$1180 = 0.356 = 35.6%In order <strong>to</strong> determine the firm’s marginal tax bracket, one would need informationregarding tax rates applicable for both federal <strong>and</strong> state income taxes.Est time: 01–0529. Net fixed assets increased by $800,000 during 2011, while depreciation expense in 2011was $520,000. Therefore, gross investment in plant <strong>and</strong> equipment was $1,320,000.Est time: 01–0530.Cash provided by operationsNet income $ 760Noncash expensesDepreciation expense 520Changes in working capitalDecrease (increase) in accounts receivable (50)Decrease (increase) in inven<strong>to</strong>ries (50)Increase (decrease) in accounts payable 50Total change in working capital (50)Cash provided by operations $1,230Cash flows from investmentsCash provided by (used for) disposal of(1,320)(additions <strong>to</strong>) property, plant & equipmentCash provided by (used for) investments (1,320)Cash provided by (used for) financing activitiesAdditions <strong>to</strong> (reductions in) notes payable (400)Additions <strong>to</strong> (reductions in) long-term debt 400Dividends paid (410)Cash provided by (used for ) financing activities (410)Net increase (decrease) in cash <strong>and</strong> cash equivalents ($500)Est time: 06–103-11
<strong>Chapter</strong> 03 - <strong>Accounting</strong> <strong>and</strong> <strong>Finance</strong>3<strong>1.</strong>Market Value Balance Sheet, 2011(figures in thous<strong>and</strong>s of dollars)Liabilities &Shareholders’ EquityAssetsCash $ 300 Accounts payable $ 350Inven<strong>to</strong>ries 350 Notes payable 600Accounts receivable 450 Long-term debt 2,200Employee skills 2,900 Total liabilities 3,350Net fixed assets 6,000 Shareholders’ equity* 6,850Total assets $10,000Total liabilities &shareholders’ equity $10,000* Shareholders' equity = <strong>to</strong>tal assets <strong>to</strong>tal liabilitiesPrice per share = $6,850,000/500,000 shares = $13.70Est time: 06–103-12
<strong>Chapter</strong> 03 - <strong>Accounting</strong> <strong>and</strong> <strong>Finance</strong>32. a.Income Taxes DueAverage TaxRate (%)10,000 1,000 10.0020,000 2,575 12.8840,000 6,125 15.3180,000 16,125 20.16100,000 21,617 2<strong>1.</strong>62150,000 35,617 23.74200,000 50,897 25.45250,000 67,397 26.96300,000 83,897 27.97350,000 100,397 28.68450,000 134,814 29.96550,000 169,814 30.88650,000 204,814 3<strong>1.</strong>51750,000 239,814 3<strong>1.</strong>981,000,000 327,314 32.732,000,000 677,314 33.874,000,000 1,377,314 34.436,000,000 2,077,314 34.628,000,000 2,777,314 34.7210,000,000 3,477,314 34.773-13
<strong>Chapter</strong> 03 - <strong>Accounting</strong> <strong>and</strong> <strong>Finance</strong>b. As shown in the table <strong>and</strong> graph above, the difference between average taxrates <strong>and</strong> the <strong>to</strong>p marginal tax rate of 35% becomes very small as incomebecomes large.c. For corporations the marginal tax rate is 35%. When analyzing very largefirms we are content simply treating the corporate tax rate as 35% sinceaverage taxes are likely <strong>to</strong> be equal. Very large firms are unlikely <strong>to</strong> haveincomes in the lower brackets.Est time: 06–1033. To minimize taxes, you should not have income in one tax category (that is,personal versus corporate) if you can move the income in<strong>to</strong> the other category at alower tax rate. First, suppose that your <strong>to</strong>tal income is $79,700. Then you couldallocate $50,000 <strong>to</strong> corporate income, the maximum amount that would be taxed at15%, <strong>and</strong> $29,700 <strong>to</strong> personal income, the maximum amount that would be taxedat 15%. Additional corporate income, up <strong>to</strong> an additional ($75,000 – $50,000) =$25,000, would be taxed at 25%, <strong>and</strong> additional individual income, up <strong>to</strong> anadditional ($83,600 – $29,700) = $53,900, would also be taxed at 25%. Therefore,you are indifferent as <strong>to</strong> whether the remaining ($100,000 – $79,700) = $20,300 inincome is allocated <strong>to</strong> corporate income or individual income or a combination ofthe two.Est time: 11–153-14