Causality between Energy Consumption and GDP: Evidence from ...
Causality between Energy Consumption and GDP: Evidence from ...
Causality between Energy Consumption and GDP: Evidence from ...
You also want an ePaper? Increase the reach of your titles
YUMPU automatically turns print PDFs into web optimized ePapers that Google loves.
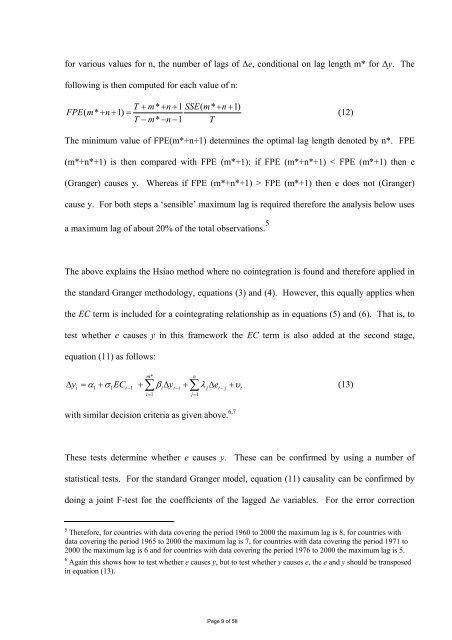
for various values for n, the number of lags of ∆e, conditional on lag length m* for ∆y. Thefollowing is then computed for each value of n:T + m* + n + 1 SSE( m* + n + 1)FPE( m* + n + 1) =T −m* −n−1T(12)The minimum value of FPE(m*+n+1) determines the optimal lag length denoted by n*. FPE(m*+n*+1) is then compared with FPE (m*+1); if FPE (m*+n*+1) < FPE (m*+1) then e(Granger) causes y. Whereas if FPE (m*+n*+1) > FPE (m*+1) then e does not (Granger)cause y. For both steps a ‘sensible’ maximum lag is required therefore the analysis below usesa maximum lag of about 20% of the total observations. 5The above explains the Hsiao method where no cointegration is found <strong>and</strong> therefore applied inthe st<strong>and</strong>ard Granger methodology, equations (3) <strong>and</strong> (4). However, this equally applies whenthe EC term is included for a cointegrating relationship as in equations (5) <strong>and</strong> (6). That is, totest whether e causes y in this framework the EC term is also added at the second stage,equation (11) as follows:∆ytm*n1+ σ1ECt−1+ ∑ βi∆yt−i+ ∑λj∆et− jυt(13)i=1j=1= α +with similar decision criteria as given above. 6,7These tests determine whether e causes y. These can be confirmed by using a number ofstatistical tests. For the st<strong>and</strong>ard Granger model, equation (11) causality can be confirmed bydoing a joint F-test for the coefficients of the lagged ∆e variables. For the error correction5 Therefore, for countries with data covering the period 1960 to 2000 the maximum lag is 8, for countries withdata covering the period 1965 to 2000 the maximum lag is 7, for countries with data covering the period 1971 to2000 the maximum lag is 6 <strong>and</strong> for countries with data covering the period 1976 to 2000 the maximum lag is 5.6 Again this shows how to test whether e causes y, but to test whether y causes e, the e <strong>and</strong> y should be transposedin equation (13).Page 9 of 58


