

Causality between Energy Consumption and GDP: Evidence from ...
Causality between Energy Consumption and GDP: Evidence from ...
Causality between Energy Consumption and GDP: Evidence from ...

Create successful ePaper yourself
Turn your PDF publications into a flip-book with our unique Google optimized e-Paper software.
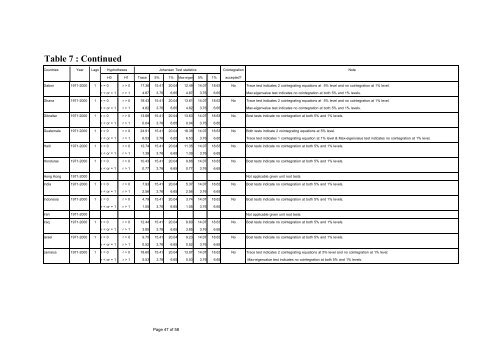
Table 7 : ContinuedCountries Year Lags Hyphotheses Johansen Test statisticsCointegration NoteH0 H1 Trace 5% 1% Max-eigen 5% 1% accepted?Gabon 1971-2000 1 r = 0 r > 0 17.36 15.41 20.04 12.49 14.07 18.63 No Trace test indicates 2 cointegrating equations at 5% level <strong>and</strong> no cointegration at 1% level.r < or = 1 r > 1 4.87 3.76 6.65 4.87 3.76 6.65 Max-eigenvalue test indicates no cointegration at both 5% <strong>and</strong> 1% levels.Ghana 1971-2000 1 r = 0 r > 0 18.43 15.41 20.04 13.61 14.07 18.63 No Trace test indicates 2 cointegrating equations at 5% level <strong>and</strong> no cointegration at 1% level.r < or = 1 r > 1 4.82 3.76 6.65 4.82 3.76 6.65 Max-eigenvalue test indicates no cointegration at both 5% <strong>and</strong> 1% levels.Gibraltar 1971-2000 1 r = 0 r > 0 13.68 15.41 20.04 13.63 14.07 18.63 No Bost tests indicate no cointegration at both 5% <strong>and</strong> 1% levels.r < or = 1 r > 1 0.04 3.76 6.65 0.04 3.76 6.65Guatemala 1971-2000 1 r = 0 r > 0 24.91 15.41 20.04 18.38 14.07 18.63 No Both tests indicate 2 cointegrating equations at 5% level.r < or = 1 r > 1 6.53 3.76 6.65 6.53 3.76 6.65 Trace test indicates 1 cointegrating equation at 1% level & Max-eigenvalue test indicates no cointegration at 1% level.Haiti 1971-2000 1 r = 0 r > 0 12.74 15.41 20.04 11.35 14.07 18.63 No Bost tests indicate no cointegration at both 5% <strong>and</strong> 1% levels.r < or = 1 r > 1 1.39 3.76 6.65 1.39 3.76 6.65Honduras 1971-2000 1 r = 0 r > 0 10.43 15.41 20.04 9.66 14.07 18.63 No Bost tests indicate no cointegration at both 5% <strong>and</strong> 1% levels.r < or = 1 r > 1 0.77 3.76 6.65 0.77 3.76 6.65Hong Kong 1971-2000 Not applicable given unit root tests.India 1971-2000 1 r = 0 r > 0 7.93 15.41 20.04 5.37 14.07 18.63 No Bost tests indicate no cointegration at both 5% <strong>and</strong> 1% levels.r < or = 1 r > 1 2.56 3.76 6.65 2.56 3.76 6.65Indonesia 1971-2000 1 r = 0 r > 0 4.79 15.41 20.04 3.74 14.07 18.63 No Bost tests indicate no cointegration at both 5% <strong>and</strong> 1% levels.r < or = 1 r > 1 1.05 3.76 6.65 1.05 3.76 6.65Iran 1971-2000 Not applicable given unit root tests.Iraq 1971-2000 1 r = 0 r > 0 12.44 15.41 20.04 8.60 14.07 18.63 No Bost tests indicate no cointegration at both 5% <strong>and</strong> 1% levels.r < or = 1 r > 1 3.85 3.76 6.65 3.85 3.76 6.65Israel 1971-2000 1 r = 0 r > 0 9.75 15.41 20.04 9.23 14.07 18.63 No Bost tests indicate no cointegration at both 5% <strong>and</strong> 1% levels.r < or = 1 r > 1 0.52 3.76 6.65 0.52 3.76 6.65Jamaica 1971-2000 1 r = 0 r > 0 18.60 15.41 20.04 13.07 14.07 18.63 No Trace test indicates 2 cointegrating equations at 5% level <strong>and</strong> no cointegration at 1% level.r < or = 1 r > 1 5.53 3.76 6.65 5.53 3.76 6.65 Max-eigenvalue test indicates no cointegration at both 5% <strong>and</strong> 1% levels.Page 47 of 58