Table 4 : ContinuedCountry Year Cointegration Direction FPE(m*) a FPE(m*,n*) a T1 T2 m* n* SSE(m*) SSE(m*,n*) F-HSIAO F-Restrict Wald-test d.f P-value t-test(long-run) Joint F-test (cof. of indep.var <strong>Causality</strong> Resuts NoteResults of <strong>Causality</strong> cof. st. t-stat p-value F-stat df. p-value E---->Y Y---->E EY E-----YKorea 1971-2000 No Y = f (E) 0.001627 0.001597 28 28 1 1 0.0395 0.0361 2.3705 2.3705 2.3705 (1, 25) 0.1362E = f (Y) 0.003364 0.003488 27 27 2 1 0.0727 0.0699 0.9234 0.9234 0.9234 (1, 23) 0.3466Luxembourg 1960-2000 No Y = f (E) 0.001132 0.001191 39 39 1 1 0.0398 0.0398 0.0431 0.0431 0.0431 (1, 36) 0.8367E = f (Y) 0.003844 0.004038 39 39 1 1 0.1353 0.1350 0.0798 0.0798 0.0798 (1, 36) 0.7792Mexico 1971-2000 No Y = f (E) 0.001471 0.001468 28 28 1 1 0.0357 0.0331 1.9238 1.9238 1.9238 (1, 25) 0.1777E = f (Y) 0.001209 0.001229 27 27 2 2 0.0261 0.0228 1.5907 1.5907 1.5907 (2, 22) 0.2263Netherl<strong>and</strong>s 1960-2000 Yes Y = f (E) # 0.000263 0.000255 36 36 4 1 0.0072 0.0066 2.8155 2.8155 2.8155 (1, 30) 0.1037E = f (Y) # 0.002898 0.002966 38 38 2 1 0.0940 0.0912 1.0296 1.0296 1.0296 (1, 34) 0.3174New Zeal<strong>and</strong> 1960-2000 No Y = f (E) 0.001014 0.000882 39 37 1 3 0.0357 0.0249 4.6504 4.6504 4.1643 (3, 32) 0.0134E = f (Y) 0.000732 0.000641 36 36 4 3 0.0199 0.0147 3.3192 3.3192 3.3192 (3, 28) 0.0341Norway 1960-2000 Yes Y = f (E) # 0.000242 0.000209 39 33 1 7 0.0085 0.0039 3.9862 3.9862 3.0130 (7, 24) 0.0203E = f (Y) 0.001085 0.000711 39 38 1 2 0.0382 0.0207 9.2629 9.2629 8.6867 (3, 33) 0.0002 -0.1433 0.0328 -4.3752 0.0001 3.1736 (2, 33) 0.0549Pol<strong>and</strong> 1960-2000 No Y = f (E) 0.001645 0.001641 39 39 1 1 0.0579 0.0549 1.9954 1.9954 1.9954 (1, 36) 0.1664E = f (Y) 0.002816 0.002958 39 39 1 1 0.0991 0.0989 0.0859 0.0859 0.0859 (1, 36) 0.7711Portugal 1960-2000 No Y = f (E) 0.001132 0.001071 36 36 4 1 0.0308 0.0275 3.5456 3.5456 3.5456 (1, 30) 0.0694E = f (Y) 0.001070 0.000948 39 39 1 1 0.0377 0.0317 6.7931 6.7931 6.7931 (1, 36) 0.0132Salovakia 1971-2000 No Y = f (E) 0.001271 0.001103 28 27 1 2 0.0308 0.0221 4.5586 4.5586 4.5494 (2, 23) 0.0216E = f (Y) 0.004937 0.002978 28 27 1 2 0.1198 0.0597 11.5985 11.5985 11.0061 (2, 23) 0.0004Spain 1960-2000 No Y = f (E) 0.000328 0.000339 39 36 1 4 0.0116 0.0087 2.4373 2.4373 1.6737 (4, 30) 0.1821E = f (Y) 0.001430 0.001200 37 37 3 1 0.0426 0.0338 8.2893 8.2893 8.2893 (1, 32) 0.0071Sweden 1960-2000 No Y = f (E) 0.000316 0.000332 39 39 1 1 0.0111 0.0111 0.0002 0.0002 0.0002 (1, 36) 0.9896E = f (Y) 0.001418 0.001397 39 39 1 1 0.0499 0.0467 2.4849 2.4849 2.4849 (1, 36) 0.1237Switzerl<strong>and</strong> 1960-2000 Yes Y = f (E) 0.000436 0.000396 39 39 1 1 0.0154 0.0126 3.8751 3.8751 3.8751 (2, 35) 0.0302 -0.0005 0.0283 -0.0189 0.9850 7.6827 (1, 35) 0.0089E = f (Y) 0.001826 0.001669 37 37 3 1 0.0544 0.0445 3.4325 3.4325 3.4325 (2, 31) 0.0450 -0.3026 0.1178 -2.5679 0.0153 0.3927 (1, 31) 0.5355Turkey 1960-2000 No Y = f (E) 0.001400 0.001424 39 39 1 1 0.0493 0.0476 1.2585 1.2585 1.2585 (1, 36) 0.2694E = f (Y) 0.001833 0.001924 39 39 1 1 0.0645 0.0643 0.1143 0.1143 0.1143 (1, 36) 0.7373UK 1960-2000 No Y = f (E) 0.000329 0.000347 38 38 2 1 0.0107 0.0107 0.0063 0.0063 0.0063 (1, 34) 0.9373E = f (Y) 0.000812 0.000839 39 39 1 1 0.0286 0.0280 0.7083 0.7083 0.7083 (1, 36) 0.4056USA 1960-2000 No Y = f (E) 0.000426 0.000430 38 38 2 1 0.0138 0.0132 1.5605 1.5605 1.5605 (1, 34) 0.2201E = f (Y) 0.000789 0.000796 39 38 1 2 0.0278 0.0245 2.2623 2.2623 1.7801 (2, 34) 0.1840Notes:ECM term has wrong sign so causality is tested by using Hsiao's Granger technique on the st<strong>and</strong>ard model.a The maximum lag (m*) <strong>and</strong> lag(m*,n*) are set at 20% of total observation.√√√√√√√√√√√√√√√Although tests only accept E → Ycausality at 14% level.Although tests only accept E → Ycausality at 18% level.Although tests only accept E → Ycausality at 17% level.Although tests only accept Y → Ecausality at 12% level.Page 38 of 58
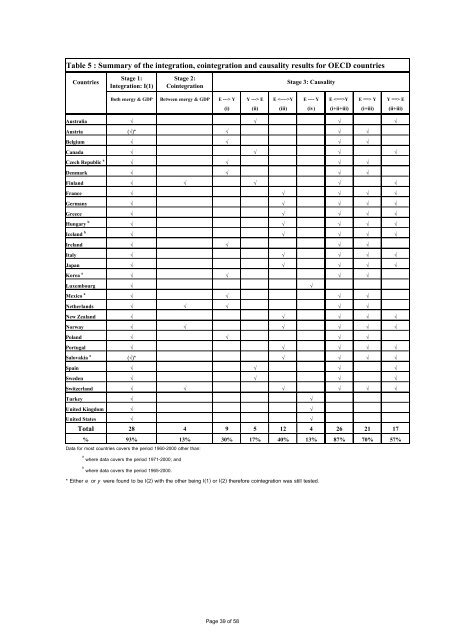
Table 5 : Summary of the integration, cointegration <strong>and</strong> causality results for OECD countriesCountriesStage 1:Integration: I(1)Stage 2:CointegrationStage 3: <strong>Causality</strong>Both energy & <strong>GDP</strong> Between energy & <strong>GDP</strong> E ---> Y Y ---> E E Y E ---- Y E Y E ==> Y Y ==> E(i) (ii) (iii) (iv) (i+ii+iii) (i+iii) (ii+iii)Australia √ √ √ √Austria (√)* √ √ √Belgium √ √ √ √Canada √ √ √ √Czech Republic a √ √ √ √Denmark √ √ √ √Finl<strong>and</strong> √ √ √ √ √France √ √ √ √ √Germany √ √ √ √ √Greece √ √ √ √ √Hungary b √ √ √ √ √Icel<strong>and</strong> b √ √ √ √ √Irel<strong>and</strong> √ √ √ √Italy √ √ √ √ √Japan √ √ √ √ √Korea a √ √ √ √Luxembourg √ √Mexico a √ √ √ √Netherl<strong>and</strong>s √ √ √ √ √New Zeal<strong>and</strong> √ √ √ √ √Norway √ √ √ √ √ √Pol<strong>and</strong> √ √ √ √Portugal √ √ √ √ √Salovakia a (√)* √ √ √ √Spain √ √ √ √Sweden √ √ √ √Switzerl<strong>and</strong> √ √ √ √ √ √Turkey √ √United Kingdom √ √United States √ √Total 28 4 9 5 12 4 26 21 17% 93% 13% 30% 17% 40% 13% 87% 70% 57%Data for most countries covers the period 1960-2000 other than:a where data covers the period 1971-2000; <strong>and</strong>b where data covers the period 1965-2000.* Either e or y were found to be I(2) with the other being I(1) or I(2) therefore cointegration was still tested.Page 39 of 58
- Page 1 and 2: SEEDSSurrey Energy EconomicsDiscuss
- Page 3 and 4: defg1111111111111111111111111111111
- Page 5 and 6: Causality between Energy Consumptio
- Page 7 and 8: Given the importance of this issue
- Page 9 and 10: ‘Granger-causality’ implies cau
- Page 11 and 12: source of causation and the model w
- Page 13 and 14: for various values for n, the numbe
- Page 15 and 16: level of significance. 10 From this
- Page 17 and 18: Stage 2Furthermore, Table 3 and Tab
- Page 19 and 20: E to Y whereas, somewhat surprising
- Page 21 and 22: The proportions from the rankings a
- Page 23 and 24: discussed by Jumbe (2004), and henc
- Page 25 and 26: ReferencesAbosedra, S., Baghestani,
- Page 27 and 28: Hwang, D. B. K., Gum, B. (1992) The
- Page 29 and 30: Appendix AOECD countries:Non-OECD c
- Page 31 and 32: Table 1: Summary of energy-output*
- Page 36 and 37: Non-farm Emp. = Non-farm employment
- Page 38 and 39: Table 2 continuedCountries Variable
- Page 40 and 41: Table 3 : ContinuedCountries Year L
- Page 44 and 45: Table 6: ADF Tests for Non-OECD Cou
- Page 46 and 47: Table 6 continuedCountries Variable
- Page 48 and 49: Table 6 continuedCountries Variable
- Page 50 and 51: Table 7 : ContinuedCountries Year L
- Page 52 and 53: Table 7 : ContinuedCountries Year L
- Page 54 and 55: Table 7 : ContinuedCountries Year L
- Page 56 and 57: Table 8 :ContinuedCountries Year Co
- Page 58 and 59: Table 8 :ContinuedCountries Year Co
- Page 60 and 61: Table 8 :ContinuedCountries Year Co
- Page 62 and 63: Table 9 : Continued.CountriesStage
- Page 64: SURREYENERGYECONOMICSDISCUSSION PAP