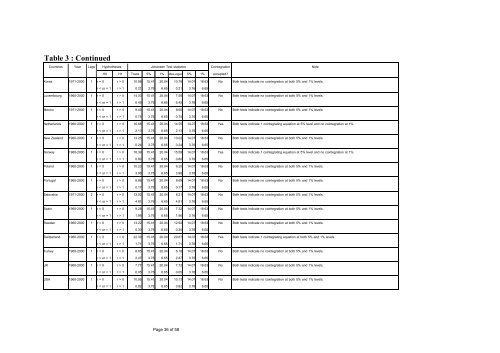
Table 3 : ContinuedCountries Year Lags Hyphotheses Johansen Test statisticsCointegration NoteH0 H1 Trace 5% 1% Max-eigen 5% 1% accepted?Korea 1971-2000 1 r = 0 r > 0 10.98 15.41 20.04 10.78 14.07 18.63 No Both tests indicate no cointegration at both 5% <strong>and</strong> 1% levels.r < or = 1 r > 1 0.21 3.76 6.65 0.21 3.76 6.65Luxembourg 1960-2000 1 r = 0 r > 0 14.03 15.41 20.04 7.58 14.07 18.63 No Both tests indicate no cointegration at both 5% <strong>and</strong> 1% levels.r < or = 1 r > 1 6.45 3.76 6.65 6.45 3.76 6.65Mexico 1971-2000 1 r = 0 r > 0 9.40 15.41 20.04 8.65 14.07 18.63 No Both tests indicate no cointegration at both 5% <strong>and</strong> 1% levels.r < or = 1 r > 1 0.75 3.76 6.65 0.75 3.76 6.65Netherl<strong>and</strong>s 1960-2000 1 r = 0 r > 0 16.68 15.41 20.04 14.55 14.07 18.63 Yes Both tests indicate 1 cointegrating equation at 5% level <strong>and</strong> no cointegration at 1%.r < or = 1 r > 1 2.13 3.76 6.65 2.13 3.76 6.65New Zeal<strong>and</strong> 1960-2000 1 r = 0 r > 0 13.25 15.41 20.04 13.02 14.07 18.63 No Both tests indicate no cointegration at both 5% <strong>and</strong> 1% levels.r < or = 1 r > 1 0.24 3.76 6.65 0.24 3.76 6.65Norway 1960-2000 1 r = 0 r > 0 16.39 15.41 20.04 15.59 14.07 18.63 Yes Both tests indicate 1 cointegrating equation at 5% level <strong>and</strong> no cointegration at 1%.r < or = 1 r > 1 0.80 3.76 6.65 0.80 3.76 6.65Pol<strong>and</strong> 1960-2000 1 r = 0 r > 0 10.23 15.41 20.04 6.25 14.07 18.63 No Both tests indicate no cointegration at both 5% <strong>and</strong> 1% levels.r < or = 1 r > 1 3.98 3.76 6.65 3.98 3.76 6.65Portugal 1960-2000 1 r = 0 r > 0 8.86 15.41 20.04 8.69 14.07 18.63 No Both tests indicate no cointegration at both 5% <strong>and</strong> 1% levels.r < or = 1 r > 1 0.17 3.76 6.65 0.17 3.76 6.65Salovakia 1971-2000 2 r = 0 r > 0 13.02 15.41 20.04 8.21 14.07 18.63 No Both tests indicate no cointegration at both 5% <strong>and</strong> 1% levels.r < or = 1 r > 1 4.81 3.76 6.65 4.81 3.76 6.65Spain 1960-2000 1 r = 0 r > 0 9.28 15.41 20.04 7.32 14.07 18.63 No Both tests indicate no cointegration at both 5% <strong>and</strong> 1% levels.r < or = 1 r > 1 1.96 3.76 6.65 1.96 3.76 6.65Sweden 1960-2000 1 r = 0 r > 0 13.22 15.41 20.04 12.92 14.07 18.63 No Both tests indicate no cointegration at both 5% <strong>and</strong> 1% levels.r < or = 1 r > 1 0.30 3.76 6.65 0.30 3.76 6.65Switzerl<strong>and</strong> 1960-2000 1 r = 0 r > 0 22.39 15.41 20.04 20.67 14.07 18.63 Yes Both tests indicate 1 cointegrating equation at both 5% <strong>and</strong> 1% levels.r < or = 1 r > 1 1.71 3.76 6.65 1.71 3.76 6.65Turkey 1960-2000 1 r = 0 r > 0 8.65 15.41 20.04 6.18 14.07 18.63 No Both tests indicate no cointegration at both 5% <strong>and</strong> 1% levels.r < or = 1 r > 1 2.47 3.76 6.65 2.47 3.76 6.65UK 1960-2000 1 r = 0 r > 0 7.77 15.41 20.04 7.72 14.07 18.63 No Both tests indicate no cointegration at both 5% <strong>and</strong> 1% levels.r < or = 1 r > 1 0.05 3.76 6.65 0.05 3.76 6.65USA 1960-2000 1 r = 0 r > 0 10.95 15.41 20.04 10.13 14.07 18.63 No Both tests indicate no cointegration at both 5% <strong>and</strong> 1% levels.r < or = 1 r > 1 0.82 3.76 6.65 0.82 3.76 6.65Page 36 of 58
Table 4 : <strong>Causality</strong> results for the OECD CountriesCountry Year Cointegration Direction FPE(m*) a FPE(m*,n*) a T1 T2 m* n* SSE(m*) SSE(m*,n*) F-HSIAO F-Restrict Wald-test d.f P-value t-test(long-run) Joint F-test (cof. of indep.var <strong>Causality</strong> Resuts NoteResults of <strong>Causality</strong> cof. st. t-stat p-value F-stat df. p-value E---->Y Y---->E EY E-----YAustralia 1960-2000 No Y = f (E) 0.000393 0.000413 39 39 1 1 0.0138 0.0138 0.0002 0.0002 0.0002 (1, 36) 0.9875E = f (Y) 0.000475 0.000343 37 37 3 1 0.0141 0.0097 14.7260 14.7260 14.7260 (1, 32) 0.0006Austria 1960-2000 No Y = f (E) 0.000318 0.000255 37 37 3 3 0.0095 0.0064 4.6855 4.6855 4.6855 (3, 30) 0.0084E = f (Y) 0.000982 0.000983 35 35 5 1 0.0243 0.0229 1.6656 1.6656 1.6656 (1, 28) 0.2074Belgium 1960-2000 No Y = f (E) 0.000373 0.000311 39 39 1 1 0.0131 0.0104 9.4453 9.4453 9.4453 (1, 36) 0.0040E = f (Y) 0.002531 0.002667 38 38 2 1 0.0821 0.0821 0.0163 0.0163 0.0163 (1, 34) 0.8990Canada 1960-2000 No Y = f (E) 0.000433 0.000454 39 39 1 1 0.0152 0.0152 0.1950 0.1950 0.1950 (1, 36) 0.6614E = f (Y) 0.000953 0.000932 39 39 1 1 0.0335 0.0312 2.7375 2.7375 2.7375 (1, 36) 0.1067Czech Republic1971-2000 No Y = f (E) 0.000960 0.000765 28 25 1 4 0.0233 0.0117 4.6862 4.6862 4.5321 (4, 19) 0.0097E = f (Y) 0.002448 0.002639 27 27 2 1 0.0529 0.0529 0.0131 0.0131 0.0131 (1, 23) 0.9097Denmark 1960-2000 No Y = f (E) 0.000454 0.000248 36 36 4 4 0.0123 0.0053 8.8378 8.8378 8.8378 (4, 27) 0.0001E = f (Y) 0.002926 0.002942 32 32 8 1 0.0525 0.0493 1.4357 1.4357 1.4357 (1, 22) 0.2436Finl<strong>and</strong> 1960-2000 Yes Y = f (E) # 0.000648 0.000668 38 38 2 1 0.0210 0.0205 0.7734 0.7734 0.7734 (1, 34) 0.3854E = f (Y) 0.001318 0.001072 39 39 1 1 0.0464 0.0340 6.3525 6.3525 6.3525 (2, 35) 0.0044 -0.1659 0.0466 -3.5591 0.0011 0.0472 (1, 35) 0.8293France 1960-2000 No Y = f (E) 0.000193 0.000190 39 37 1 3 0.0068 0.0054 2.8187 2.8187 2.5245 (3, 32) 0.0751E = f (Y) 0.001464 0.001358 39 39 1 1 0.0515 0.0454 4.8647 4.8647 4.8647 (1, 36) 0.0339Germany 1960-2000 No Y = f (E) 0.000352 0.000297 39 32 1 8 0.0124 0.0050 4.0909 4.0909 2.0626 (8, 22) 0.0856E = f (Y) 0.003557 0.003365 39 39 1 1 0.1252 0.1125 4.0642 4.0642 4.0642 (1, 36) 0.0513Greece 1960-2000 No Y = f (E) 0.001178 0.001141 37 37 3 1 0.0351 0.0322 2.9002 2.9002 2.9002 (1, 32) 0.0983E = f (Y) 0.003073 0.002906 39 39 1 1 0.1081 0.0971 4.0760 4.0760 4.0760 (1, 36) 0.0510Hungary 1965-2000 No Y = f (E) 0.001409 0.001344 34 34 1 1 0.0426 0.0383 3.4678 3.4678 3.4678 (1, 31) 0.0721E = f (Y) 0.001668 0.001153 34 34 1 1 0.0504 0.0329 16.5478 16.5478 16.5478 (1, 31) 0.0003Icel<strong>and</strong> 1965-2000 No Y = f (E) 0.001353 0.001201 33 33 2 2 0.0372 0.0292 3.8370 3.8370 3.8370 (2, 28) 0.0337E = f (Y) 0.001583 0.001553 34 33 1 2 0.0478 0.0402 2.7653 2.7653 2.3519 (2, 29) 0.1131Irel<strong>and</strong> 1960-2000 No Y = f (E) 0.000682 0.000635 39 38 1 2 0.0240 0.0195 3.9035 3.9035 3.5290 (2, 34) 0.0405E = f (Y) 0.002280 0.002321 39 39 1 1 0.0802 0.0776 1.2277 1.2277 1.2277 (1, 36) 0.2752Italy 1960-2000 No Y = f (E) 0.000388 0.000364 39 39 1 1 0.0137 0.0122 4.3823 4.3823 4.3823 (1, 36) 0.0434E = f (Y) 0.000995 0.000944 37 37 3 1 0.0296 0.0266 3.6345 3.6345 3.6345 (1, 32) 0.0656Japan 1960-2000 No Y = f (E) 0.000513 0.000365 32 32 8 7 0.0092 0.0039 3.1188 3.1188 3.1188 (7, 16) 0.0282E = f (Y) 0.001408 0.001001 32 32 8 3 0.0253 0.0146 4.9131 4.9131 4.9131 (3, 20) 0.0102√√√√√√√√√√√√√√√Although tests only accept Y → Ecausality at 11% level.Although tests only accept Y → Ecausality at 11% level.Page 37 of 58
- Page 1 and 2: SEEDSSurrey Energy EconomicsDiscuss
- Page 3 and 4: defg1111111111111111111111111111111
- Page 5 and 6: Causality between Energy Consumptio
- Page 7 and 8: Given the importance of this issue
- Page 9 and 10: ‘Granger-causality’ implies cau
- Page 11 and 12: source of causation and the model w
- Page 13 and 14: for various values for n, the numbe
- Page 15 and 16: level of significance. 10 From this
- Page 17 and 18: Stage 2Furthermore, Table 3 and Tab
- Page 19 and 20: E to Y whereas, somewhat surprising
- Page 21 and 22: The proportions from the rankings a
- Page 23 and 24: discussed by Jumbe (2004), and henc
- Page 25 and 26: ReferencesAbosedra, S., Baghestani,
- Page 27 and 28: Hwang, D. B. K., Gum, B. (1992) The
- Page 29 and 30: Appendix AOECD countries:Non-OECD c
- Page 31 and 32: Table 1: Summary of energy-output*
- Page 36 and 37: Non-farm Emp. = Non-farm employment
- Page 38 and 39: Table 2 continuedCountries Variable
- Page 42 and 43: Table 4 : ContinuedCountry Year Coi
- Page 44 and 45: Table 6: ADF Tests for Non-OECD Cou
- Page 46 and 47: Table 6 continuedCountries Variable
- Page 48 and 49: Table 6 continuedCountries Variable
- Page 50 and 51: Table 7 : ContinuedCountries Year L
- Page 52 and 53: Table 7 : ContinuedCountries Year L
- Page 54 and 55: Table 7 : ContinuedCountries Year L
- Page 56 and 57: Table 8 :ContinuedCountries Year Co
- Page 58 and 59: Table 8 :ContinuedCountries Year Co
- Page 60 and 61: Table 8 :ContinuedCountries Year Co
- Page 62 and 63: Table 9 : Continued.CountriesStage
- Page 64: SURREYENERGYECONOMICSDISCUSSION PAP