NBP09-01 Cruise Report - British Oceanographic Data Centre
NBP09-01 Cruise Report - British Oceanographic Data Centre
NBP09-01 Cruise Report - British Oceanographic Data Centre
- No tags were found...

Create successful ePaper yourself
Turn your PDF publications into a flip-book with our unique Google optimized e-Paper software.
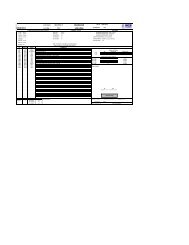
Run Test 1 2 3 4 5 6 7 8 9 10 11Stby. 6088 6088 6086 6075 6085 6086 6088 6091 6088 6078 6089 6088Stats. 1-5 6-15 16-31 32-55 56-91 92-1<strong>01</strong> 102-117 118-127 128-139 140-152 153-160Table 2: Salinometer “standby” reading throughout the cruise. Very good stability was observed betweenruns as little or no re-standardizing was needed.Sa readings, with a mean error of -0.0004 for primary and -0.00<strong>01</strong> for secondary and standard deviations of0.0026 and 0.0025 respectively. Differences among primary and secondary (Sec-Pri) sensors throughout thecruise were found to be almost zero for temperature and a drift from 0 (at sta 1) to -.003 (at sta 160) forcalculated salinity (see fig 9 and table 2)Figure 10: Salinity difference, DeltaS (rosette minus CTD), versus Station # for primary and secondaryconductivity sensors. Grey points were considered outliers and discarded for the final error estimations.Sensor Liner fit vs sta# Sta1 Sta160Te Y = 3.3 E-006 * X - 0.00<strong>01</strong>4 0.00<strong>01</strong> 0.0007Sa Y = -1.70 E-005 * X - 2.05 E-005 0.0000 -0.0027Table 3: Fits versus Station number of difference between Primary and Secondary sensors, for temperatureand calculated salinity.Errors in salinity resulting from the primary and secondary conductivity sensors were tracked throughoutthe 160 stations (Fig. 10). Salinity errors, denoted as DeltaS, are reported as the rosette salinity minus theCTD sensor salinity.The drift, observed in fig 9, among CTD calculated salinity is mainly observed in the secondary sensor (fig10). Primary sensor shows smaller slope with the same sign (growing with time).Fig 11 shows DeltaS0 and DeltaS1 versus Pressure. It shows a lack of calibration point below 1200 m asmost of the CTD profiles were in shallower waters (over 90%). There seems to be weak pressure dependence,not analyzed in this report. Larger spreading on deltas are located above 600 m depth.<strong>NBP09</strong>-<strong>01</strong> <strong>Cruise</strong> <strong>Report</strong> (p. 15 of 83) Revised February 27, 2009