1 IntroductionStan Jacobs, Chief ScientistThree international science projects were accommodated on NB Palmer cruise 09-<strong>01</strong>. O-274, entitled’Amundsen Sea Influence on West Antarctic Ice Sheet Stability and Sea Level Rise,’ (S Jacobs, A Jenkins& H Hellmer, PIs) seeks to better understand ocean forcing on ice shelf, ice stream and sea ice change,and the sources of ocean freshening. Its several related subcomponents included setting out time seriesmoorings to record temperature, salinity and currents over a period of two years; repeat profiling of watercolumn properties on and near the Amundsen continental shelf; using the UK ’Autosub’ to map thermohalineproperties, currents and dimensions of the Pine Island Ice Shelf cavity; modeling the ocean circulation;sampling the sea ice, setting out drifters and mass balance buoys and recording sea ice properties underway;swath-mapping the sea floor; and outreach photography and video. B-244, ’Shedding Dynamic Light on IronLimitation,’ (K Arrigo, PI), a US/Netherlands/Canada project, sampled surface and subsurface waters to300 m with trace metal clean equipment/methods to assess the influence of iron and light on phytoplanktonproductivity and species distribution. The goal of O-261, ’Sampling the ocean-sea ice interaction in thePacific center of the Antarctic Dipole,’ (X Yuan and J Sprintall, PIs) was to set a deep mooring northwest ofthe Amundsen Sea continental shelf to monitor the upper ocean role and response in ENSO teleconnections,complemented by German work near the Atlantic Dipole in the Weddell Sea.Prior to the cruise, responsible Principal Investigators were asked to provide project summaries and plans,which were then circulated to other members of the field parties. Those outlines are attached to this reportas appendices, which can now be compared with the work accomplished, detailed in the following sections.Elements of the work were also briefly described in prior weekly science reports to mo-sciweekly@usap.gov etal. For a variety of reasons, none of these projects achieved all of the fieldwork objectives in the time framesor locations anticipated in their underlying proposals. However, some have now come closer than others,some will be continued in forthcoming years, and at least one may have unexpectedly struck paydirt.Project O-274 would have required >50 days and helicopter support to implement the full program proposedon the Amundsen Sea continental shelf, including a sea ice thickness survey with Alfred Wegener Institutecollaborators and the setup of Automatic Weather Stations. In lieu of that, it was allocated 60 days toalso accommodate the <strong>British</strong> Antarctic Survey/Southampton Autosub III project, postponed from priorscheduling on NBP07-02. The cruise length was subsequently shortened, but <strong>NBP09</strong>-<strong>01</strong> experienced anatypically low sea ice cover and generally fair weather, facilitating much of the O-274 work planned in theeastern Amundsen sector. Project B-244 specified work in the Ross Sea, consistent with prior studies andmodeling there, but for the first time in several trips to the Amundsen Sea, the NB Palmer started in PuntaArenas rather than McMurdo, and returned to Chile. Project O-261 anticipated an 11-day cruise fromMcMurdo to set a mooring at 69S, 140W, and after several iterations settled on a site at 66.45S, 129.47W,requiring 4-5 days of 09<strong>01</strong> ship time. That mooring was deployed, but had to be quickly recovered as it didnot set right in the water column, and could not be re-set without new line. The total ship time needed forall 3 projects was initially projected at 67 days, vs 62 allocated, reduced to 47 days during last summer’sfuel crisis/budget crunch, after which 7 days were restored. Average fuel consumption (∼5.6K gal/da) hasbeen substantially less than anticipated, mainly due to the light sea ice encountered and substantial time’on station.’ Related costs were also much less than expected, at < $1.90/gal for marine gas at the pump inPUQ.AcknowledgementsWe are grateful for the solid technical and logistic support provided during the cruise by 11-person RPSCcrew under the direction of Marine Project Coordinator Eric Hutt, and the 23-person ECO contingent ledby Captain Mike Watson. Thanks to those who gave talks during the cruise, showed slides of their travelsand made their 09<strong>01</strong> pictures available on the local web. The primary financial support for this workhas come from the US National Science Foundation, Office of Polar Programs to Columbia and Stanford<strong>NBP09</strong>-<strong>01</strong> <strong>Cruise</strong> <strong>Report</strong> (p. 4 of 83) Revised February 27, 2009
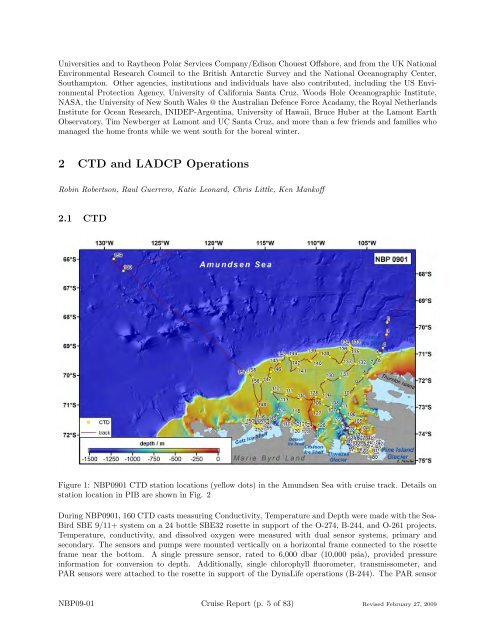
Universities and to Raytheon Polar Services Company/Edison Chouest Offshore, and from the UK NationalEnvironmental Research Council to the <strong>British</strong> Antarctic Survey and the National Oceanography Center,Southampton. Other agencies, institutions and individuals have also contributed, including the US EnvironmentalProtection Agency, University of California Santa Cruz, Woods Hole <strong>Oceanographic</strong> Institute,NASA, the University of New South Wales @ the Australian Defence Force Acadamy, the Royal NetherlandsInstitute for Ocean Research, INIDEP-Argentina, University of Hawaii, Bruce Huber at the Lamont EarthObservatory, Tim Newberger at Lamont and UC Santa Cruz, and more than a few friends and families whomanaged the home fronts while we went south for the boreal winter.2 CTD and LADCP OperationsRobin Robertson, Raul Guerrero, Katie Leonard, Chris Little, Ken Mankoff2.1 CTDFigure 1: <strong>NBP09</strong><strong>01</strong> CTD station locations (yellow dots) in the Amundsen Sea with cruise track. Details onstation location in PIB are shown in Fig. 2During <strong>NBP09</strong><strong>01</strong>, 160 CTD casts measuring Conductivity, Temperature and Depth were made with the Sea-Bird SBE 9/11+ system on a 24 bottle SBE32 rosette in support of the O-274, B-244, and O-261 projects.Temperature, conductivity, and dissolved oxygen were measured with dual sensor systems, primary andsecondary. The sensors and pumps were mounted vertically on a horizontal frame connected to the rosetteframe near the bottom. A single pressure sensor, rated to 6,000 dbar (10,000 psia), provided pressureinformation for conversion to depth. Additionally, single chlorophyll fluorometer, transmissometer, andPAR sensors were attached to the rosette in support of the DynaLife operations (B-244). The PAR sensor<strong>NBP09</strong>-<strong>01</strong> <strong>Cruise</strong> <strong>Report</strong> (p. 5 of 83) Revised February 27, 2009
- Page 3: List of Figures1 Regional map of CT
- Page 8 and 9: 1, 7, 104, and 159. At least one ad
- Page 10 and 11: and dissolved oxygen decreasing wit
- Page 12: Primary-Secondary O2 sensor differe
- Page 15 and 16: Run Test 1 2 3 4 5 6 7 8 9 10 11Stb
- Page 17 and 18: In order to estimate the accuracy o
- Page 19 and 20: ice-ocean boundary layer. To do thi
- Page 21 and 22: Figure 17: Using small boat for rec
- Page 23 and 24: Figure 19: Planned mission profiles
- Page 25 and 26: was under way (Figure 17). This met
- Page 27 and 28: # Starttime, pos,duration, km427428
- Page 29 and 30: S. Jacobs O-274-N Mooring Schematic
- Page 31 and 32: at the helm.The high iceberg produc
- Page 33 and 34: Seasonal sea ice changes in the Amu
- Page 35 and 36: in the Amundsen Sea - (1) the confi
- Page 37 and 38: An automated camera system provided
- Page 39 and 40: presence of ice layers and wicked b
- Page 41 and 42: enough number to be able to regiona
- Page 43 and 44: 6 Seafloor MappingFrank Nitsche, Ka
- Page 45 and 46: Due to the location of the transduc
- Page 47 and 48: Figure 29: Water column thickness (
- Page 49 and 50: Figure 31: A south-to-north cross s
- Page 51 and 52: phytoplankton from the upper 200m w
- Page 53 and 54: uptake (K m ) as well as the maximu
- Page 55 and 56:
Elmer UV/VIS Lambda 18 spectrophoto
- Page 57 and 58:
Figure 37: Section plot of dissolve
- Page 59 and 60:
ligand ’TAC’ (2-(2-Thiazolylazo
- Page 61 and 62:
Both GA and PA, at times, resulted
- Page 63 and 64:
9 Other Sampling and Profiling9.1 O
- Page 65 and 66:
Figure 42: XBTs gridded as if they
- Page 67 and 68:
on them. A single hollow column is
- Page 69 and 70:
in ways that are accessible to a wi
- Page 71 and 72:
AppendicesACruise ParticipantsPerso
- Page 73 and 74:
BCTD Station TableNo. Date Time Lat
- Page 75 and 76:
continued from previous pageNo. Dat
- Page 77 and 78:
CPre-cruise Project PlansC.1 Amunds
- Page 79 and 80:
Figure 48: Missions, three each, pe
- Page 81 and 82:
C.4 Collaborative Research: Samplin