NBP09-01 Cruise Report - British Oceanographic Data Centre
NBP09-01 Cruise Report - British Oceanographic Data Centre
NBP09-01 Cruise Report - British Oceanographic Data Centre
- No tags were found...

Create successful ePaper yourself
Turn your PDF publications into a flip-book with our unique Google optimized e-Paper software.
List of Figures1 Regional map of CTDs . . . . . . . . . 52 Local map of CTDs . . . . . . . . . . 63 CTD and Ice Shelf . . . . . . . . . . . 74 Example CTD Profile . . . . . . . . . 75 Samlp LADCP Profile . . . . . . . . . 96 OX Sensor Diff v. CTD Station . . . . 127 Titrated OX minus both sensors . . . 128 Titrated OX v Ox2 sensor . . . . . . . 139 CTD Sensors . . . . . . . . . . . . . . 1410 Salinity v. Station # . . . . . . . . . . 1511 Delta S v. CTD Pressure . . . . . . . 1612 Residual Histograms . . . . . . . . . . 1613 Side view of Autosub containers . . . . 1814 Plan view of Autosub containers . . . 1815 Acoustic Fish . . . . . . . . . . . . . . 1916 Fending off Autosub . . . . . . . . . . 2<strong>01</strong>7 Recovering Autosub . . . . . . . . . . 2118 Planned Mission Tracks . . . . . . . . 2219 Planned Mission Profiles . . . . . . . . 2320 Completed Missions . . . . . . . . . . 2421 Mooring Schematics . . . . . . . . . . 2922 Map of BSR and ITP Mooring Locations 3023 ITP Deployment Photo . . . . . . . . 3024 Sea Ice Station Map . . . . . . . . . . 3225 Ice Station and Sub-Ice Photo . . . . . 3426 Thin and Thick Sections . . . . . . . . 3527 Bathymetry (pre and post <strong>NBP09</strong>-<strong>01</strong>) 4428 Amundsen Sea Bathymetry . . . . . . 4529 PIG model domain . . . . . . . . . . . 4730 PIG model overview (map view) . . . 4831 PIG model ice front overview (plan view) 4932 DynaLife sample map . . . . . . . . . 5033 DynaLiFe Station 102 . . . . . . . . . 5334 DynaLiFe Station 131 . . . . . . . . . 5435 Photochemical efficiency . . . . . . . . 5536 Stations 16 and 107 . . . . . . . . . . 5637 Dissolved Fe . . . . . . . . . . . . . . . 5738 Ratio of Ligand to dFe . . . . . . . . . 5839 Chlorophyll and Photochemical Efficiency 6040 Phytoplankton blooms . . . . . . . . . 6141 ADCP Currents . . . . . . . . . . . . . 6442 PIG XBT Transect . . . . . . . . . . . 6543 Snow particles . . . . . . . . . . . . . 6644 Snowflake Photomicrograph . . . . . . 6745 Penguin Interview . . . . . . . . . . . 6846 Google Earth Screenshot . . . . . . . . 7047 0-274 Overview . . . . . . . . . . . . . 7748 Autosub Mission Plan . . . . . . . . . 7949 Target mooring site and topography. . 81List of Tables1 CTD Components . . . . . . . . . . . 62 Salinometer . . . . . . . . . . . . . . . 153 Salinity Fits v. Station Number . . . . 154 DeltaS v. Station # . . . . . . . . . . 175 Autosub-III Missions . . . . . . . . . . 286 Moorings . . . . . . . . . . . . . . . . 317 DynaLiFe . . . . . . . . . . . . . . . . 528 PIG Freeboard Measurements . . . . . 659 <strong>Cruise</strong> Personnel . . . . . . . . . . . . 7210 CTDs . . . . . . . . . . . . . . . . . . 76<strong>NBP09</strong>-<strong>01</strong> <strong>Cruise</strong> <strong>Report</strong> (p. 3 of 83) Revised February 27, 2009
1 IntroductionStan Jacobs, Chief ScientistThree international science projects were accommodated on NB Palmer cruise 09-<strong>01</strong>. O-274, entitled’Amundsen Sea Influence on West Antarctic Ice Sheet Stability and Sea Level Rise,’ (S Jacobs, A Jenkins& H Hellmer, PIs) seeks to better understand ocean forcing on ice shelf, ice stream and sea ice change,and the sources of ocean freshening. Its several related subcomponents included setting out time seriesmoorings to record temperature, salinity and currents over a period of two years; repeat profiling of watercolumn properties on and near the Amundsen continental shelf; using the UK ’Autosub’ to map thermohalineproperties, currents and dimensions of the Pine Island Ice Shelf cavity; modeling the ocean circulation;sampling the sea ice, setting out drifters and mass balance buoys and recording sea ice properties underway;swath-mapping the sea floor; and outreach photography and video. B-244, ’Shedding Dynamic Light on IronLimitation,’ (K Arrigo, PI), a US/Netherlands/Canada project, sampled surface and subsurface waters to300 m with trace metal clean equipment/methods to assess the influence of iron and light on phytoplanktonproductivity and species distribution. The goal of O-261, ’Sampling the ocean-sea ice interaction in thePacific center of the Antarctic Dipole,’ (X Yuan and J Sprintall, PIs) was to set a deep mooring northwest ofthe Amundsen Sea continental shelf to monitor the upper ocean role and response in ENSO teleconnections,complemented by German work near the Atlantic Dipole in the Weddell Sea.Prior to the cruise, responsible Principal Investigators were asked to provide project summaries and plans,which were then circulated to other members of the field parties. Those outlines are attached to this reportas appendices, which can now be compared with the work accomplished, detailed in the following sections.Elements of the work were also briefly described in prior weekly science reports to mo-sciweekly@usap.gov etal. For a variety of reasons, none of these projects achieved all of the fieldwork objectives in the time framesor locations anticipated in their underlying proposals. However, some have now come closer than others,some will be continued in forthcoming years, and at least one may have unexpectedly struck paydirt.Project O-274 would have required >50 days and helicopter support to implement the full program proposedon the Amundsen Sea continental shelf, including a sea ice thickness survey with Alfred Wegener Institutecollaborators and the setup of Automatic Weather Stations. In lieu of that, it was allocated 60 days toalso accommodate the <strong>British</strong> Antarctic Survey/Southampton Autosub III project, postponed from priorscheduling on NBP07-02. The cruise length was subsequently shortened, but <strong>NBP09</strong>-<strong>01</strong> experienced anatypically low sea ice cover and generally fair weather, facilitating much of the O-274 work planned in theeastern Amundsen sector. Project B-244 specified work in the Ross Sea, consistent with prior studies andmodeling there, but for the first time in several trips to the Amundsen Sea, the NB Palmer started in PuntaArenas rather than McMurdo, and returned to Chile. Project O-261 anticipated an 11-day cruise fromMcMurdo to set a mooring at 69S, 140W, and after several iterations settled on a site at 66.45S, 129.47W,requiring 4-5 days of 09<strong>01</strong> ship time. That mooring was deployed, but had to be quickly recovered as it didnot set right in the water column, and could not be re-set without new line. The total ship time needed forall 3 projects was initially projected at 67 days, vs 62 allocated, reduced to 47 days during last summer’sfuel crisis/budget crunch, after which 7 days were restored. Average fuel consumption (∼5.6K gal/da) hasbeen substantially less than anticipated, mainly due to the light sea ice encountered and substantial time’on station.’ Related costs were also much less than expected, at < $1.90/gal for marine gas at the pump inPUQ.AcknowledgementsWe are grateful for the solid technical and logistic support provided during the cruise by 11-person RPSCcrew under the direction of Marine Project Coordinator Eric Hutt, and the 23-person ECO contingent ledby Captain Mike Watson. Thanks to those who gave talks during the cruise, showed slides of their travelsand made their 09<strong>01</strong> pictures available on the local web. The primary financial support for this workhas come from the US National Science Foundation, Office of Polar Programs to Columbia and Stanford<strong>NBP09</strong>-<strong>01</strong> <strong>Cruise</strong> <strong>Report</strong> (p. 4 of 83) Revised February 27, 2009
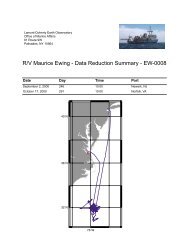
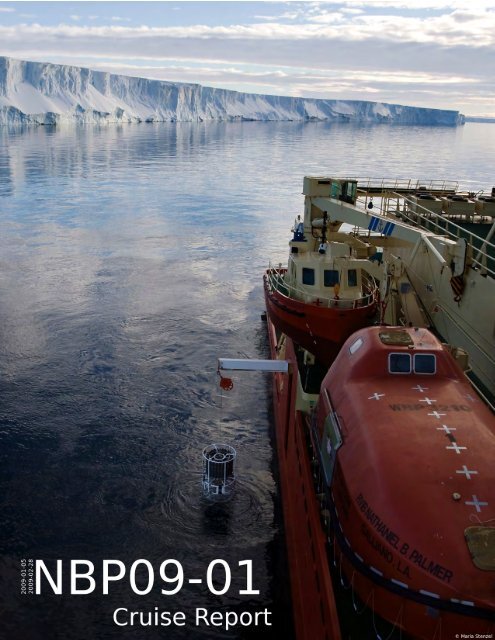
Universities and to Raytheon Polar Services Company/Edison Chouest Offshore, and from the UK NationalEnvironmental Research Council to the <strong>British</strong> Antarctic Survey and the National Oceanography Center,Southampton. Other agencies, institutions and individuals have also contributed, including the US EnvironmentalProtection Agency, University of California Santa Cruz, Woods Hole <strong>Oceanographic</strong> Institute,NASA, the University of New South Wales @ the Australian Defence Force Acadamy, the Royal NetherlandsInstitute for Ocean Research, INIDEP-Argentina, University of Hawaii, Bruce Huber at the Lamont EarthObservatory, Tim Newberger at Lamont and UC Santa Cruz, and more than a few friends and families whomanaged the home fronts while we went south for the boreal winter.2 CTD and LADCP OperationsRobin Robertson, Raul Guerrero, Katie Leonard, Chris Little, Ken Mankoff2.1 CTDFigure 1: <strong>NBP09</strong><strong>01</strong> CTD station locations (yellow dots) in the Amundsen Sea with cruise track. Details onstation location in PIB are shown in Fig. 2During <strong>NBP09</strong><strong>01</strong>, 160 CTD casts measuring Conductivity, Temperature and Depth were made with the Sea-Bird SBE 9/11+ system on a 24 bottle SBE32 rosette in support of the O-274, B-244, and O-261 projects.Temperature, conductivity, and dissolved oxygen were measured with dual sensor systems, primary andsecondary. The sensors and pumps were mounted vertically on a horizontal frame connected to the rosetteframe near the bottom. A single pressure sensor, rated to 6,000 dbar (10,000 psia), provided pressureinformation for conversion to depth. Additionally, single chlorophyll fluorometer, transmissometer, andPAR sensors were attached to the rosette in support of the DynaLife operations (B-244). The PAR sensor<strong>NBP09</strong>-<strong>01</strong> <strong>Cruise</strong> <strong>Report</strong> (p. 5 of 83) Revised February 27, 2009
Instrument Serial Number Calibration DateCTD Fish 097536-0328 8/1/07Carousel Water Sampler 3211265-0066 N/ACTD Deck Unit 11P19858-0768 N/ASlip Ring Assembly 1.406 N/ACTD Pressure Unit 53980 8/1/07Pump (primary) 051646 4/17/08Pump (secondary) 051626 4/17/08Temperature (primary) 031457 6/18/08Temperature (secondary) 03P2299 6/18/08Conductivity (primary) 040926 8/21/08Conductivity (secondary) 041799 7/9/08Dissolved Oxygen (primary casts 1-23) 161 6/19/08Dissolved Oxygen (primary casts 24-103,105-160) 158 25/7/08Dissolved Oxygen (primary cast 104) 139 2/5/08Dissolved Oxygen (secondary) 155 7/1/08Altimeter 42434 N/ABottom Contact Sensor #1 N/AFluorometer AFLD-009 2/14/08Transmissometer CST-831DR 4/9/08PAR 4469 2/1/08Table 1: Serial numbers and calibration dates for the CTD components. These temperature, conductivity,and dissolved oxygen sensors are being returned to Sea-Bird for calibration.Figure 2: <strong>NBP09</strong><strong>01</strong> CTD station locations (yellow dots) in the Pine Island Bay with cruise track.<strong>NBP09</strong>-<strong>01</strong> <strong>Cruise</strong> <strong>Report</strong> (p. 6 of 83) Revised February 27, 2009
1, 7, 104, and 159. At least one additional electronic termination occurred roughly before cast 9, but thedate/time was not noted. In the original termination, the incorrect mechanical connector was used. Thisconnector did not have a slot, which allows the electrical connection wire to easily exit the device withoutinterference from the cable supporting the rosette frame. As a result, the electrical connection wire becamepinched and a retermination was necessary (before cast 7). At this time, the mechanical connection wasswitched with one allowing the electrical connection wire without interference. A slip ring was changedbefore cast 93 and changed back after it did not reduce modulo errors. The cast number for the return ofthe original slip ring is unknown, as is the serial number of the replacement. It was necessary to restartone cast as 34b, midway in the downcast, when the software failed mid-cast. Additionally, due to operatorerror, cast 2 was done twice, since data was not archived the first time. The second cast for 2 is denoted 2b.Near the Getz Ice Shelf during a time of cold, southerly, katabatic winds, there were problems with icing inthe sensors for cast 153. The CTD was brought on board and the sensors and pumps flushed, which clearedup the problem. Subsequent deployments under these conditions immersed the CTD rapidly, cutback onthe rinsing of the sensors and rosette, and increased the Baltic room temperature. The problem did notreoccur. The PAR sensor was found to be unplugged following cast 98 and was subsequently reconnectedto the fish when the disconnect was identified. The use of audio tapes as a backup has ceased in RPSCCTD proceedure. On <strong>NBP09</strong><strong>01</strong>, screen prints were made as a backup for each cast of both the surface 200m and the entire downcast for each station and saved in the CTD Log. Ken Mankoff developed digitizationsoftware that would convert these screen prints to profiles, if need be. This capability was not needed, afterimplementation of the screen saves as part of the CTD procedure.Processing was performed immediately upon completion of the CTD using Sea-Bird’s SBE Version 7.14eprocessing software using a modified version of the Huber et al. batch file, which can be found on the cruisedata DVD. Both raw and processed data were then promptly copied to both a backup disk and the datadisc available for general use. Random spikes occurred in the data throughout the cruise, particularly inpressure, temperature and conductivity. These spikes were removed in processing using wild edit. Plots ofthe processed potential temperature, salinity, dissolved oxygen, and density were generated for each castby Robin Robertson and used to identify spiking in the different quantities. Air surface pressure on deckdiffered by -0.8 to -1.0 dbar between the start and end of each cast, showing shallower pressures on theup-cast. Although there were variations in this surface pressure difference, there was not an identifiabletrend throughout the set of casts. Dissolved oxygen exhibited the usual hysterisis. Some drift occurred inthe salinity and dissolved oxygen sensors and is discussed in their respective sections. When the switch ofprimary dissolved oxygen sensor was done after cast 23, correct calibration coefficients were entered, but thesensor serial number and date were not changed. This situation persisted until cast 104, before which thesensor was changed and calibration coefficients were modified accordingly. The primary dissolved oxygen forcast 104 is deemed to be in need of recalibration and is unsuitable for use. The sensor was again changedafter cast 104 and all the relevant data (calibration coefficients, sensor number and dates) updated. Fromcast 105 on, all information is correct. Casts 24-103 have the wrong date and serial number for the primarydissolved oxygen sensor in the config files.A 24 hour yo-yo deployment of the CTD was performed at the southern notch of the Pine Island Glacier(PIG), in order to evaluate the structure and variability of the outflow from the PIG. A CTD descent wasstarted on the hour for the yo-yo casts, 58-81. The fourth cast, cast 61, was 15 minutes late starting itsdescent. The first 5 casts went to 900 m. The remaining yo-yo casts, 63-81, reached only to 800 m, as thedeeper water column showed little change between casts 58 and 62. For the yo-yo casts, an ascent rate of60 m/minute was used. The rosette was typically brought on board after each cast in order to charge theLADCP battery, download the LADCP data, and allow the winch operator to rest.Water samples were collected using 10 liter “Bullister bottles” on the rosette for dissolved oxygen, salinity,oxygen isotopes, and total CO 2 . Operation of the rosette was generally trouble-free other than the occasionalfailed release or open valve, as noted in the Bottle Logs. Samples for dissolved oxygen and salinity werecollected for sensor monitoring and offset adjustment as needed. These samples were analyzed on board.Refer to the respective sections for further information. Samples for oxygen isotopes, and total CO 2 will bereturned to the U.S for analyses. Four bottles of water from 10 m were also provided to the DynaLife groupfrom many of the CTD casts directly before TMC casts.<strong>NBP09</strong>-<strong>01</strong> <strong>Cruise</strong> <strong>Report</strong> (p. 8 of 83) Revised February 27, 2009
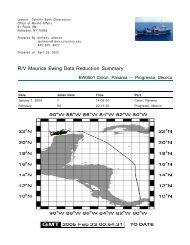
depth [m]above bottom [m]U(−) V(−−); blue dots down cast; dotted shear; pentagon SADCP Start: 74°S 10.3716’ 113°W 20.3340’004−Feb−2009 18:48:40End: 74°S 10.3788’ 113°W 20.4876’−5004−Feb−2009 19:22:25u−mean: 1 [cm/s] v−mean 6 [cm/s]−100binsize do: 8 [m] binsize up: 0 [m]mag. deviation 54.8wdiff: 0.2 pglim: 0 elim 0.5−150bar:1.0 bot:1.0 sad:1.0weightmin 0.1 weightpower: 1.0−200max depth: 582 [m] bottom: 587 [m]−250−300−350−400−450−500−55025020<strong>01</strong>5<strong>01</strong>0050RDI bottom track0−10 −5 0 5 10velocity [cm/s]Station : nbp09<strong>01</strong>119 Figure 1depth [km]north−south [m]0−0.1−0.2−0.3−0.4−0.5range of instuments single [m] ping (−b)40 60 0 50 100 0 0.1target strength [dB]vel error (−k) [m/s]100bottom start−10GPS−end−20−80 −60 −40 −20 0CTD−position (blue) and ship (green) east−west [m]LDEO LADCP software: Version IX 4Figure 5: Example of a LADCP profile corresponding to the CTD castprofiles in Figure CTD-1. The East-West velocity (U solid line) changesdirection roughly at 250 m and the North-South velocity (V dashed line)shows multiple layers in Northward direction away from the Dotson IceShelf cavity.Most of the CTD casts were shallow,less than 1000 m. The shallowcasts did not require manysamples to define the water column.Typically, 3-8 samples fordissolved oxygen and salinity weretaken per cast. At times, all bottleswere fired in order to verify themechanisms still functioned properly.Samples were typically takenat 10 m (below the ship’s draft ∼5-6 m), 10 m above the bottom, thetemperature extrema (defined asminimum and maximum), and inhomogeneous oxygen/salinity layersfor ’calibration’. Water wasalso collected at depths of interestfor oxygen isotope samples.The CTD’s revealed that the watercolumn in front of the iceshelves is layered, despite its weakstratification. The water columntypically had two layers, an upperlayer heavily influenced bymelt water exiting from the iceshelves and a lower layer primarilycomposed of CircumpolarDeep Water (CDW). A profile collectedin 0.25 nmi in front of theDotson Ice Shelf showed a surfacemixed layer (SML) extendingto ∼38 m, in which temperature,salinity, dissolved oxygen,and beam attenuation (as determinedby the transmissometer) arerelatively uniform. In the SML,dissolved oxygen and temperaturewere well correlated. The upperlayer fell below the SML fromroughly 100 to 300 m and was bothcomplex and active. In it, dissolvedoxygen switched to be anti-correlated with temperature, as is typical in the deep ocean. The upperlayer itself was composed of layers of 10-100 m height and strong intrusions. An example layer can be seenin Figure 4 between ∼95 and 160 m. Strong intrusions are evident between 200-270 m. Significant changesoccurred in the upper layer between the down- and up-casts (not shown). These changes could have beeninduced by a dynamic water column changing between the down- and up-casts, by a small scale spatialvariations in the water column with the CTD sampling from different water types, or by a degraded up-castrecord. The depth of the upper layer varied within the Amundsen Sea, with a deeper upper layer (100-450m) in front of the PIG compared to 100-300 m in front of the Dotson. It is plausible that the upper layerthickness is related to the draft of the ice shelf, although the ice shelf drafts are not well enough known forthis to be definitively determined. Below the upper layer, generally a transition layer occurred in the regionof the pycnocline. The lower layer typically extended from below this transition layer to the bottom, here∼400-590 m. It was less active and showed a gradient of temperature and salinity increasing with depth<strong>NBP09</strong>-<strong>01</strong> <strong>Cruise</strong> <strong>Report</strong> (p. 9 of 83) Revised February 27, 2009
and dissolved oxygen decreasing with depth. The maximum temperatures and salinities occurred near thebottom in this layer. And small steps occasionally occurred in its upper portion.The CTD operations were carried out by Robin Robertson, Katie Leonard, Chris Little, and Ken Mankoffwith the CTD operated by RPSC personnel George Aukon and Greg Watson. Thanks are due to RPSCmarine technicians Mike Lewis, Robert Zimmerman, Jullie Jackson, and Amy Schaub for their outstandingdeployment of the CTD and rosette and their prompt mechanical repairs. We also appreciate the excellentwinch operations of a Ben Aaron, Ric Tamayo, and Louie Andrada. Raul Guerrero assisted with setting upboth the sensors and processing.2.2 LADCPA 300kHz RDI Lowered Acoustic Doppler Current Profiler (LADCP) was attached on the CTD rosette framefacing down. It was deployed on each CTD cast to provide a profile of the horizontal velocities with depth.Only a single LADCP head (SN 754) was used. Typically, the LADCP battery was charged every 3 casts,with the charging requiring between 20 min and an hour. The charging time needed depends on the chargeremaining in the battery. It is possible that more time might be requred if the battery voltage was lower.The LADCP operated well, without any problems due to broken beams. There are two CTD casts withoutLACDP profiles. On cast 1, the LADCP cover was not removed, with the result that there was no validdata. On cast 116, the instrument was not properly started due to operator error. Local times instead ofGMT times were saved for LADCP profiles 2-36. The times both in the files and on the printed graphs in theCTD Log book are incorrect. The LADCP computer was shifted to GMT after cast 36 and the processingscripts modified to correct the time for incorporation of CTD and shipboard ADCP (SADCP) data. Therewere no problems with lack of scatterers in deep water, even on cast 160, which reached 4497 dbar. It shouldbe noted that LADCP profile 2 goes with CTD cast 2b, not the non-existent CTD 2.LADCP data was processed in Matlab using Andreas’ Thurnherr’s version IX.5 of the processing code,process cast. Note the plots indicate version IX4, but the processing software says IX5. The processingincorporated processed CTD and SADCP data to provide navigation data and constrain the LADCP velocityprofile, reducing errors. The SADCP was an RDI 150 kHz narrowband instrument. The maximum range ofthis instrument is 300 m, but valid data typically ceased between 250-280 m. Profile plots of the processedvelocities for each LADCP profile are included in the CTD Log book. Only six LADCP profiles experiencedprocessing errors. Three of these are casts 1, 2, and 116 as noted above. A shear solution was determinedfor profile 2. Three profiles showed pressure spikes in scans. These were casts 150, 151, and 153, which had20, 20, and 22 pressure spikes in 2 scans, respectively. Their processing reports are included in the CTD Logbook.During the yo-yo casts (58-81), the LADCP was charged for 15-20 minutes after each cast, after cast 66.Monitoring of the LADCP battery voltage showed this to be sufficient to maintain the batter voltage of 50V. Before cast 66 of the yo-yo, the LADCP was charged only once, after cast 60. Profiles 58, 61, and 64 eachhave multiple casts within the original raw data file, with 3 casts each in 58 and 61 and 2 casts in 64. AMatlab script, split yoyo, was written to split the original raw files into separate raw files for each of the casts.This script is specific for these casts, although it could be generalized. When using split yoyo, it is necessaryto run it twice. The first time, the data is plotted and the user must identify the scan number for separationof the casts. It is relatively easy to identify scans when the LADCP is aboard the ship by the relativelyconstant zero velocity values. Any scan number within that period is valid for the split. This has been donefor these three cases with multiple profiles and the scan numbers hardcoded into the script split yoyo. Inthe future, if a general script is desired, the hardcoding of these scan numbers and the file names need to bemodified. Note the three original raw files were renamed with an underline between the first and last castnumbers, ie. the original LADCP profile 58 raw file with three casts is named 058 60dn000.000, as opposedto its original name 058dn000.000. The new file of that name has only the raw data corresponding to cast 58in it. This was done in order to allow processing of this data without further modification of the processingsoftware.<strong>NBP09</strong>-<strong>01</strong> <strong>Cruise</strong> <strong>Report</strong> (p. 10 of 83) Revised February 27, 2009
In front of the Dotson Ice Shelf, the East-West velocity was aligned roughly along the front of the ice shelfcavity and the North-South velocity in/out of the cavity. For the corresponding LADCP profiles for CTDcast 119 (Figure 4), the North-South velocity (V, green line in Figure 5) was positive, indicating outflow fromthe cavity, from below the SML (50 m) to the bottom. The North-South velocity did fluctuate with depth,but did not indicate clear layers. However, the East-West velocities (U, red line) changed direction at around250 m, indicating two layers, as in the CTD structure. Below 400 m, corresponding to the lower layer of theCTD, U was relatively uniform at ∼8 cm/s and V uniform at ∼9 cm/s. The result was a northeasterly flowof the lower layer. This indicates exiting CDW after transit of the ice shelf cavity. The upper layer behavioris more complex. Between 100-160 m, roughly the depth of the large step or layer in CTD 119, the East-Westvelocity was constant at ∼7-8 cm/s and the V velocity ∼5-6 cm/s. This portion of the upper layer, depths100-160 m, appears to be flowing WNW roughly at a 30o with the front of the ice shelf. Below this layer,stronger U velocities occur in a 40 m layer from ∼160-200 m, which corresponds to two ∼20 m layers intemperature. At depths of 200-260 m, U velocities are small and change direction and V velocities weaken.Strong intrusions occur in this depth range of weaker velocities. The weaker velocities may enable water tointerleave more easily, increasing intrusions. It is likely the interleaving water masses originated from theice shelf cavity south of this site and a water mass north of this site, since the V velocities are stronger forthis depth range. In the transition layer, ∼300 to 400 m, U velocities generally increased in magnitude andV velocities fluctuated between 7 and 9 cm/s. A series of peaks at roughly 75 m intervals were apparent inthe V velocities between 100 and 300 m depth. There were no apparent correlations between this series ofvelocity peaks and the temperature or salinity profiles of the CTD.The LADCP operations were carried out by Robin Robertson, Katie Leonard, Chris Little, and Ken Mankoff.Raul Guerrero assisted with installation of the LADCP and battery charging.2.3 Dissolved OxygenKatherine Leonard, Chris Little, Ken MankoffTwo SBE 43 dissolved oxygen sensors are a standard part of the CTD sensor array. SBE 43 sensors havean accuracy of 2 percent of saturation, and a stability of 2 percent per 1000 hours. Titrated values bythe Winkler method are also necessary to ’calibrate’ the CTD oxygen sensors, i.e., to correct for sensorbias, drift and potential offsets. During <strong>NBP09</strong><strong>01</strong>, 407 oxygen samples were collected for Winkler titrationfrom 126 CTD stations, plus an electronically undocumented cast at the site of station two. The Langdonamperometric titrator was used to determine dissolved oxygen concentrations in whole bottle samples ofapproximately 140 mL of seawater collected from the CTD rosette. In addition to those 407 samples, atleast 30 blanks and 125 standards were also determined using the automated titrator system.Three liters of KIO 3 standard were prepared and shipped south by C. Langdon in September 2008, of which1.725 L were used in running standards and blanks during the course of the cruise. The titrations alsoconsumed close to one liter each of MnCl and NaOH-NaI solutions for pickling samples, 5-molar H 2 SO 4 , andNa-Thiosulfate titrant. Approximately 100mL of each of these chemicals remained at the end of the cruise,but dispensing that liquid into water samples would have required different equipment than was availablein the NBP’s Langdon titrator system. Adequate supplies were unavailable on board with which to preparenew pickling chemicals, and the titrant stocked in dry form on board the NBP is the pentahydrate ratherthan the preferred anhydrous variety.Fewer than half the projected number of seawater samples were collected and analysed for dissolved oxygencontent during <strong>NBP09</strong>-<strong>01</strong>, due to constraints imposed by an insufficient supply of pickling chemicals. However,through careful management, cautious sampling strategies, and analysts’ nimbleness in spill-avoidance,the available reagents were stretched to allow sample collection through the final station of the cruise. Thetitration work, principally conducted by C. Little, proceeded smoothly, with occasional unexceptional hiccoughsdue to ship motion bouncing the magnetic stir-bars and air bubbles in the Na-Thio in the microburette and titrant lines. Sampling (principally by Little and Mankoff, with help from Leonard and Robertsonduring the pm and am shifts respectively) immediately followed each cast, from the deepest niskins first,<strong>NBP09</strong>-<strong>01</strong> <strong>Cruise</strong> <strong>Report</strong> (p. 11 of 83) Revised February 27, 2009
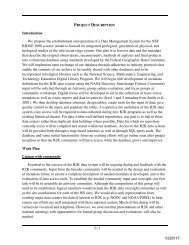
Primary-Secondary O2 sensor difference through station 1600.60.40.2mL/L dissolved oxygen0-0.2-0.4-0.6-0.8-10 20 40 60 80 100 120 140 160station numberFigure 6: Ox1 minus Ox2 sensor values versus CTD station number. Note significant errors between CTDstations 4 to 23, and 160.Primary O2 sensor minus titrated (purple) Secondary minus titrated (blue)0.200.00difference in dissolved O2 values (mL/L)-0.20-0.40-0.60-0.80-1.000 20 40 60 80 100 120 140 160station numberFigure 7: Titrated dissolved oxygen values minus Ox1 and Ox2 sensor values versus CTD station number.Outliers have been removed.<strong>NBP09</strong>-<strong>01</strong> <strong>Cruise</strong> <strong>Report</strong> (p. 12 of 83) Revised February 27, 2009
through 159. The primary sensor used during most of the cruise (casts 24-160, skipping 104) was offset -0.25± 0.09 mL/L from the titrated values through cast 159. All of the O 2 sensors used during this cruise willbe returned to SeaBird for calibration. In the interim, the secondary sensor looks to be the better choice forpost cruise data processing, as shown in figure 8.2.4 Salinity Determination (Autosal) and CTD temperature/conductivity SensorbehaviorRaul Guerrero and Ken MankoffIn order to monitor the performance of the CTD conductivity sensors, 506 salinity samples were analyzedduring the cruise using SN 61-670 Autosal salinometer. Only one salinometer was available onboard, andit performed within factory specifications. Laboratory room temperature control was excellent, remainingmostly between 0.2 and 1 o C below the Autosal temperature setting of 24 o C. <strong>Data</strong> from the Autosal wascaptured using the ACI 2000 hardware/software package. On each “run”, an average of two boxes (48 samplescollected over 10 to 12 stations) were measured by Raul Guerrero and Ken Mankoff. The standardizationwas performed at the beginning of each “run” using P149-Oct.2007 IAPSO standard seawater, and a controlof drift was done at the end of the run, using a new vial from batch P149 from October 2007 or P148 (oneyear older). Differences in readings among these vials were not observed when run together. A total of 25vials (18 P149 and 7 P148) were used on 11 runs. The Autosal was stable throughout the cruise and littleor no restandardization was required between the runs (as may be seen in Table 3). Opening vials on runs 3and 9 (stations 16 to 31 and 128 to 139 respectively) were standardized around 0.00<strong>01</strong>0 CoRatio units downand on runs 4 and 10 the adjusted value were back up, indicating probably a bad vial on the former runs.The rosette salinity comparison to CTD salinities seems to show this variation, which in Sa units represents-0.0<strong>01</strong>5, falling within the precision of the Autosal. Consequently, any shifts do to bad vials were not applied.Standardization readings throughout the cruise are shown in table 3.Figure 9: Temperature and Salinity differences between Primary and secondary CTD sensors (Sec. minusPri.) versus Sta #.In order to check functioning of the CTD and test water tightness of bottles, twenty samples were drawn from1000 m depth on a test station performed early on the cruise (station 1). Even though depth reached was notideal for inter-calibration, salinity values from all 20 bottles felt between -.007 and +.003 difference to CTD<strong>NBP09</strong>-<strong>01</strong> <strong>Cruise</strong> <strong>Report</strong> (p. 14 of 83) Revised February 27, 2009
Run Test 1 2 3 4 5 6 7 8 9 10 11Stby. 6088 6088 6086 6075 6085 6086 6088 6091 6088 6078 6089 6088Stats. 1-5 6-15 16-31 32-55 56-91 92-1<strong>01</strong> 102-117 118-127 128-139 140-152 153-160Table 2: Salinometer “standby” reading throughout the cruise. Very good stability was observed betweenruns as little or no re-standardizing was needed.Sa readings, with a mean error of -0.0004 for primary and -0.00<strong>01</strong> for secondary and standard deviations of0.0026 and 0.0025 respectively. Differences among primary and secondary (Sec-Pri) sensors throughout thecruise were found to be almost zero for temperature and a drift from 0 (at sta 1) to -.003 (at sta 160) forcalculated salinity (see fig 9 and table 2)Figure 10: Salinity difference, DeltaS (rosette minus CTD), versus Station # for primary and secondaryconductivity sensors. Grey points were considered outliers and discarded for the final error estimations.Sensor Liner fit vs sta# Sta1 Sta160Te Y = 3.3 E-006 * X - 0.00<strong>01</strong>4 0.00<strong>01</strong> 0.0007Sa Y = -1.70 E-005 * X - 2.05 E-005 0.0000 -0.0027Table 3: Fits versus Station number of difference between Primary and Secondary sensors, for temperatureand calculated salinity.Errors in salinity resulting from the primary and secondary conductivity sensors were tracked throughoutthe 160 stations (Fig. 10). Salinity errors, denoted as DeltaS, are reported as the rosette salinity minus theCTD sensor salinity.The drift, observed in fig 9, among CTD calculated salinity is mainly observed in the secondary sensor (fig10). Primary sensor shows smaller slope with the same sign (growing with time).Fig 11 shows DeltaS0 and DeltaS1 versus Pressure. It shows a lack of calibration point below 1200 m asmost of the CTD profiles were in shallower waters (over 90%). There seems to be weak pressure dependence,not analyzed in this report. Larger spreading on deltas are located above 600 m depth.<strong>NBP09</strong>-<strong>01</strong> <strong>Cruise</strong> <strong>Report</strong> (p. 15 of 83) Revised February 27, 2009
Figure 11: DeltaS versus CTD Pressure, for primary and secondary sensors showing a pressure dependency.This pressure effects were not considered in the preliminary sensor versus sta# error calculations. Grey colorpoints were those considered outliers on the fittings versus Sta. #Figure 12: Residual histograms for: (a) primary sensor and (b) secondary sensor. The standard deviationsreported in Table 3, for S0 and S1 residuals were 0.0032 and 0.0031, respectively.<strong>NBP09</strong>-<strong>01</strong> <strong>Cruise</strong> <strong>Report</strong> (p. 16 of 83) Revised February 27, 2009
In order to estimate the accuracy of the comparisons between RosSalts and CTDsalts two linear fits ofDeltaS0 and DeltaS1 vs Sta# were performed. Fit1 allowed identifying and flagging outliers that were twostandard deviations away from the fit. Fit2 was applied to the calculate residuals and gave a final overallaccuracy of the preliminary errors. The fitting coefficients and the residual standard deviation for bothsensors are presented in Table 4. This table also shows the number of RosSal values that felt over 2 standarddeviations from the fits, considered not good for calibration.Sensor Fit Res St Dev # points discarded % usedPri DeltaS0 = 7.78E-006 * Sta# + 0.0<strong>01</strong>64 0.0032 420 89 78.8Sec Y = 2.137E-005 * X + 0.0<strong>01</strong>93 0.0031 411 86 79.1Table 4: Fitting of DeltaS values as a function of Sta#, standard deviations of residuals are presented forprimary and secondary sensor. Also the percentage of point used for the fittings.The accuracy in these preliminary error estimations are reflected in the standard deviations of the residuals,being 0.0032 for primary and 0.0031 for secondary sensors respectively. The residual histograms are presentedin fig. 12. These standard deviations should be lessreduce if an adjustment of the error is previouslyperformed as function of Pressure.Errors reported here on salinity have been estimated with the only objective being the evaluation of thebehavior of the Conductivity sensors throughout the cruise. Most points marked here as outliers can probablybe related to niskin leakage and/or contamination, and unstable layers not suitable for calibration.Associated Bottle <strong>Data</strong> Files A Microsoft Excel spreadsheet file was generated with bottle informationcoming from the rosette niskin measurements performed onboard (Salinity and Oxygen) and from CTDinstruments at the corresponding niskin firing levels. CTD instrument values are extracted by the SBEsoftware modules “datcnv” and “rossum”, which average over 2 seconds or 48 scans around the tripping ofthe niskin. An Excel file, named ’Bottle <strong>NBP09</strong><strong>01</strong>.xls’ (spread sheet ’nbp09<strong>01</strong>0<strong>01</strong>.btl’) contains the integratedbottle information. All rosette salinities (SaRos) and corresponding error calculations have been included inthe bottle files (columns Y to AM). Values with a residual larger than 2 standard deviations from the fitsare labeled ’outliers’. Other associated bottle files are:• <strong>NBP09</strong><strong>01</strong>0<strong>01</strong>.bl thru <strong>NBP09</strong><strong>01</strong>160.bl are output bottle files from SBE data processing.• <strong>NBP09</strong><strong>01</strong>A thru <strong>NBP09</strong><strong>01</strong>K.dat are ACI 2000 software output files from Autosal runs (Autosal folder)• <strong>NBP09</strong><strong>01</strong>A thru <strong>NBP09</strong><strong>01</strong>K.xls are excel files used to average salt readings (Bottle folder)• Salbottles.xls is an excel file that compiles all the final salts by run.Note: CTD salinity entries for primary sensor on station 2 were punched in from the CTD log sheet. <strong>Data</strong>was not archived on this station (see CTD report) but salinity bottles were taken and measured.3 Autosub III OperationsAdrian Jenkins (BAS), Pierre Dutrieux (BAS), Steve McPhail (NOCS), James Perrett (NOCS), Andy Webb(NOCS), Dave White (NOCS)3.1 IntroductionThe UK component of <strong>NBP09</strong><strong>01</strong> was funded by the Natural Environment Research Council (NERC) andwas undertaken by personnel from the <strong>British</strong> Antarctic Survey (BAS) and the National Oceanography<strong>NBP09</strong>-<strong>01</strong> <strong>Cruise</strong> <strong>Report</strong> (p. 17 of 83) Revised February 27, 2009
Figure 13: Side view of the Autosub containers.Figure 14: Plan view of Autosub containers on the N B Palmer Aft deck.<strong>Centre</strong>, Southampton (NOCS). The work involved the deployment of NERC’s autonomous underwater vehicle(Autosub-III) on six missions beneath the floating extension of Pine Island Glacier (PIG), to study how warmCircumpolar Deep Water (CDW) gets beneath the glacier and how it determines the rate at which the glaciermelts. The specific aims of the project were to: map the seabed beneath the glacier; map the undersideof the glacier; and determine where and how heat is transferred from the inflowing CDW to the outflowing<strong>NBP09</strong>-<strong>01</strong> <strong>Cruise</strong> <strong>Report</strong> (p. 18 of 83) Revised February 27, 2009
ice-ocean boundary layer. To do this Autosub-III was equipped with the following instrumentation: Seabird9+ CTD, with dual conductivity and temperature sensors plus a SBE43 dissolved oxygen sensor and Wetlabstransmissometer; Simrad EM2000 multi-beam echosounder; upward-looking RDI 300 kHz ADCP; downwardlookingRDI 150 kHz ADCP. Unusually light sea ice conditions allowed the ship to access Pine Island Bayduring the early stages of the cruise and provide the perfect conditions for autosub deployment. A total ofeight missions, including two test missions in open water and six science missions beneath the glacier wererun during the two-week period from 17th to 30th January 2009. Total track length was 887 km (taking 167hours) of which 510 km (taking 94 hours) were beneath the glacier.Figure 15: Acoustic fish being deployed from starboard ’A’ frame.3.2 Preparation and Mobilisation in Punta ArenasAutosub mobilisation began in Punta Arenas in December 08 prior to cruise <strong>NBP09</strong><strong>01</strong>. The Autosub gantryplaces very large vertical deck loads and required a custom made deck/gantry interface plate, designed atNOCS but constructed in Punta, to reduce the loads to an acceptable level. The launch and recovery gantrywas bolted to the deck matrix via the adaptor plate. The container/garage assembly was secured in placeand the Autosub vehicle secured within the garage container set up.We had problems with some of our wooden equipment not meeting Chilean requirements for heat treatment.Our acoustic fish bases, weights box, and railway sleepers (used for blocking up the Autosub chocks) weredestroyed, the replacements being made from locally sourced wood.Following discussion with Raytheon employees the aft garage roof was lowered and container doors refittedfor the crossing to the Amundsen Sea (this turned out to be essential, since the aft deck of the Palmerbecomes awash to a depth of 0.5 m, even in moderate seas).<strong>NBP09</strong>-<strong>01</strong> <strong>Cruise</strong> <strong>Report</strong> (p. 19 of 83) Revised February 27, 2009
Figure 16: Autosub being fended off.The deployment and recovery gantry for Autosub was run from our own hydraulic pump (HPU) mountedin a 10 foot container, mounted adjacent to the main containers on the port quarter. This was poweredfrom the ship’s 480VAC 60Hz three phase power, providing up to 100 Amps, with an earth connected tothe ship’s earth. The two main containers were joined to make the garage and workshop with a fabric rollerdoor and heating to keep the vehicle batteries warm. The workshop containers were supplied with 208VACthree phase, up to 60A, with a neutral and an earth.Installation of acoustic equipment into the aft winch control room was completed, the mission control computerswere set up in the main dry lab and aerial systems were installed.On arrival at Pine Island Bay the aft container was reconfigured for Autosub operations. Figures 13 & 14show views of the gantry and Autosub’s purpose-made containers on the aft deck.3.3 Acoustic operationsAutosub carries three independent acoustic communications devices, in addition to the acoustic measuringdevices.Emergency beaconThe emergency beacon transmits a 4.5 kHz narrow-band chirp to communicate over a long range. It wasused on all missions to track the sub on its outward leg under the glacier. The transducer is deployed by<strong>NBP09</strong>-<strong>01</strong> <strong>Cruise</strong> <strong>Report</strong> (p. 20 of 83) Revised February 27, 2009
Figure 17: Using small boat for recovery.hand, via a sheave mounted on the ship’s rail, to a depth of about 80m (100m of cable, from the exit point ofthe work space). The deck unit and controlling laptop (Toshiba) were housed in the aft control cabin. Thelaptop was used to run the NOCS ”beaconview” program. Initial electrical noise problems were traced to afault in the sea cable producing a ground loop fault. After repair (see fault log) good ranges were obtained,limited only by the acoustic noise from the ship.LinkQuest digital telemetry systemAutosub carries a LinkQuest Tracklink modem and transponder, which is used to track and command thesub when underwater, and to receive a limited subset of digital data. The LinkQuest worked well at rangesof up to 2-3km, although the tracking display, which was repeated on a monitor on the bridge, was onlyavailable in head-up mode.ORE LXT acoustic transponderThis transponder (also known as the ”dumb” transponder) is used for tracking, as a backup for the LinkQuest.The LXT worked well, tracking the sub to a similar range as the LinkQuest.<strong>NBP09</strong>-<strong>01</strong> <strong>Cruise</strong> <strong>Report</strong> (p. 21 of 83) Revised February 27, 2009
Figure 18: Planned mission tracks beneath PIG, with inbound legs shown in blue and outbound in red.Red stars indicate the turning points for both short and long missions. The white lines indicate the fourlongitudinal radar profiles that were the main source of ice draft estimates. The 1996 grounding line is shownin black, and the NBP9402 cruise track in yellow. Axes are labelled with the projection coordinates of theimage. The standard parallel for this projection is 70 o S, so 1 km on the image represents 1.<strong>01</strong>35 km on theground.Acoustic Tow FishWith the exception of the emergency beacon receiver array, all the ship-borne acoustic transducers aremounted on the tow fish. This is a 380 kg towed body that was deployed to a depth of 12m from thestarboard A-frame (Figure 15). It was suspended using the 5/16” wire on the lower waterfall winch (SWL3 tons), the fish’s own cable being paid out by hand and made fast once the fish was at depth.From our experience, the Nathaniel B. Palmer appears to be an acoustically noisy ship. Even with all the<strong>NBP09</strong>-<strong>01</strong> <strong>Cruise</strong> <strong>Report</strong> (p. 22 of 83) Revised February 27, 2009
Figure 19: Planned mission profiles beneath PIG, with short missions shown in red and long missions inblue. The ice thickness profile is taken from the southernmost radar flightline of the four shown in Figure 6,starting near X=50 km, Y=1630 km. The bold, dashed line joins the two points of known seabed depth atthe ice front and the grounding line.ship’s sonars switched off, ranges on the Autosub LinkQuest rarely exceeded 3 km, or less than half thatachieved on the RRS Discovery, RRS James Cook, and the MV Terschelling. The emergency beacon wasclearly audible to a range of 10km, and could be detected intermittently in quiet weather (particularly withthe ships propulsion system disengaged) up to 20km away.3.4 Recovery operationsOn the first recovery we kept with the method we had developed over the preceding years. This requires asmall float, jettisoned from Autosub, to be grappled. The float is connected by a light line to heavy lift lines,held within the Autosub vehicle, which are pulled aboard and coupled to the Autosub gantry. Autosub isthen winched aboard.R/V Nathaniel B Palmer is a twin screw, direct drive, fixed RPM, variable pitch ice breaker. During the firstrecovery it was found that the cut away counter and the huge suction generated from the main propellerswould draw the Autosub under the stern. This was only averted by the fact that the ship has a very lowfreeboard enabling the use of boat hooks (Figure 16).<strong>NBP09</strong>-<strong>01</strong> <strong>Cruise</strong> <strong>Report</strong> (p. 23 of 83) Revised February 27, 2009
Figure 20: Autosub-III missions completed in PIB during <strong>NBP09</strong><strong>01</strong>. Missions 427 and 432 were test missionsrun at the start of operations and following repairs to the damage sustained on mission 431.A meeting was called, and after discussion with officers, ship technicians and the Autosub team, a decisionwas made to use a method the Autosub team had not used in the past. The method required the use of asmall boat to act as a drogue and to keep the Autosub vehicle under control while the recovery operation<strong>NBP09</strong>-<strong>01</strong> <strong>Cruise</strong> <strong>Report</strong> (p. 24 of 83) Revised February 27, 2009
was under way (Figure 17). This method was refined over the next couple of recoveries, with the use of theAutosub recovery (Jack) float being abandoned in favour of a direct pick up by the small boat. It becamea practical, slick and more importantly safe method of recovery. The small boat was used in winds of upto 25kts with a wave height of about 0.6m (2 feet). The use of a small boat would limit the operationalwindow, but with the work site being within a bay and sea being damped by ice, sea conditions were nevera problem.3.5 Autosub missionsOutline plans for six science missions beneath the ice shelf, including three that penetrated 30 km into theouter cavity and three that penetrated the full 60 km to the grounding line, had been approved by NOCSprior to the cruise. Final planning of waypoints and profiles was guided by ice thickness data, from airborneradar sounding, the bulk of which was collected in early 2006, and seabed soundings from NBP0402, refinedwith multi-beam data collected during the course of <strong>NBP09</strong><strong>01</strong>. We also made extensive use of a Modisvisible image (Figure 18), collected in late December 2008. Where the ice is grounded, the combination ofice thickness and surface elevation from the radar observations gives the depth of the bed. We therefore hadknowledge of the seabed depth along the grounding line at the inner edge of the cavity. Depths there aresimilar to those at the ice front (800 to 1000 m) so we assumed that the bed would be fairly flat.Planned tracks and profiles for the six missions are shown in Figures 18 and 19. The three shorter missionswere intended to track the seabed at 200 m altitude on the way to the turning point, approximately 30km from the ice front, then ascend to track the ice base at 100 m clearance on the way out. A globalminimum depth of 500 m was set to prevent Autosub tracking up into hollows in the ice shelf base, while thezig-zag course on the way out was designed to sample a wider range of basal features with the multi-beamecho-sounder, which was oriented up for these missions. The original plan was then to run three furthermissions that extended these tracks by approximately 30 km into cavity. It was intended that the actualturning point would be determined by Autosub’s detection of minimum headroom, set at approximately200 m of water (i.e. about 100 m clearance above and below). For the inbound leg of the longer missionsAutosub would track the seabed at 100 m altitude, then track the ice base at 100 m clearance, so obtainingmulti-beam images of the ice base, as far as the 30 km point reached on the shorter missions. From thispoint out the sub would undulate between bounds set by minimum clearance of the ice base and seabed orglobal minimum and maximum depths, whichever were encountered first.The three shorter missions (M428-430) were successfully completed as above. Further discussions about thelonger missions led to the abandonment of the zig-zag course for the first part of the return leg, as far asthe point reached on the shorter missions. It was felt unwise to have multiple waypoints programmed forthe inner part of the cavity, where we were uncertain about the turning point. It was quite possible that thesub would detect minimum headroom at a point further out than one of these waypoints and then attemptfor a second time to go further into the cavity to reach its next waypoint. Finding the route blocked wouldthen trigger a mission abort.The first of the longer missions (M431) showed the dangers of tracking an irregular ice base without aminimum depth protection (the global minimum of 500 m, required for the outer part of the cavity, gave noprotection on the inner part), as the sub followed a course similar to the hypothetical one in Figure 16. Thetriggering of multiple collision avoidances (one of which was not actually avoided) led to the mission beingaborted, and a rethink for the final two missions. For these we planned only seabed tracking with an altitudeof 100 m in the inner cavity, and since we could not image the ice shelf base, switched the orientation ofthe multi-beam echo-sounder so that we could gather seabed imagery. The fifth mission (M433) was alsoaborted when minimum headroom was detected earlier in the mission than we had anticipated and the subturned to find its path to the next waypoint blocked by an ice keel. The sixth and final mission (M434)track was then further amended to access the inner cavity by a known safe route, then explore to the southand the north (Figure 17). Beyond the known safe area we planned only bottom tracking, although we ranat two altitudes (100 and 200 m) to the south, where we knew that the 500 m minimum depth would keep<strong>NBP09</strong>-<strong>01</strong> <strong>Cruise</strong> <strong>Report</strong> (p. 25 of 83) Revised February 27, 2009
the sub safe from the major irregularities of the ice base. This mission went according to plan, except thatthe sub detected minimum headroom very early on the northern leg. From the start of the straight leg backto the ice front Autosub followed an undulating course, collecting data on the water column between the icebase and seabed.Mission tracks, as executed are shown in Figure 17 and a summary of each is given in Table 5. Included hereare the test missions, run at the start of operations and following the repairs necessitated by the collision onM431, and the preliminary open water tracks run at the start of each mission as part of the risk mitigationstrategy.<strong>NBP09</strong>-<strong>01</strong> <strong>Cruise</strong> <strong>Report</strong> (p. 26 of 83) Revised February 27, 2009
# Starttime, pos,duration, km42742842943043119/1/20091341 GMTS: 74:59.48W: 1<strong>01</strong>:48.236.8 hrs38 km.19/1/20092035 GMTS: 74:59.48W: 1<strong>01</strong>:48.2318.4 hrs1<strong>01</strong> km23/1/20091544 GMTS: 74 55.9W: 1<strong>01</strong> 50.71 + 3+ 17 hr113 km23/1/20091544S: 74:57.18W: 1<strong>01</strong>:40.7719 hr107 km24/1/20091345 GMTS: 74:52.21W: 1<strong>01</strong>:43.8634.5 hr183 kmPlanComments and FaultsTest Mission to 850 m depth. None critical. Motor appeared to stop andrestart intermittently - fixed for M428. T1on CTD appeared intermittent - connectorscleaned and cable replaced for M428. HotelGround Fault reading high - investigationshowed that source was related to the groundedCTD chassis but no fault found.Sub Ice shelf Mission. Startedwith short (2 hr) test mission, followedby data retrieval and checking.Then AUV run under the iceshelf. 30 km at 200 m const altitude,then turn and 100 m up altitude.2nd run under the PIG. 30 km in.200 m altitude in, and 100 m distanceoff the ice shelf coming out.3rd under ice shelf mission. 30 kmin. 200 m altitude in, and 100 mdistance off the ice shelf comingout.4th under ice shelf mission forPalmer 09<strong>01</strong>. First 60 km mission.Run 60km in at 100m altitude,turn when got to far waypointor collision avoided and thenrun back at 120m up altitude to30 km point, then profile for theremainder.Mission completed as planned. Good multibeam,CTD, O2, & Transmission data. PoorADCP up profiling range noted.First attempt at mission was unsuccessful becauseshortly after vehicle dived the downADCP misinterpreted a scattering layer at approximately500m as the seabed, causing thevehicle to go to a safe waypoint due to insufficientdepth. To overcome this, we reduced themaximum ADCP range to 440m. Second attemptwas unsuccessful as we were unable tocommunicate acoustically with the AUV due toa faulty crimp joint in the acoustic fish cable.Final mission was successful and completed asplanned.Battery changed before mission. Mission completedas planned.Mission terminated early due to the emergencyexception being called (failed collision avoidance).Consequently, the AUV carried out noprofiling on the way out. The vehicle had, howeverreached 55km under the ice shelf. Vehiclenose section damaged by collision with ice.Port CTD plumbing damaged. Linkquest transducerbulkhead connector damaged (the telemetrysystem was working properly on recovery).continued on next page<strong>NBP09</strong>-<strong>01</strong> <strong>Cruise</strong> <strong>Report</strong> (p. 27 of 83) Revised February 27, 2009
# Starttime, pos,duration, km43243343427/1/20092212 GMTS: 74:57.71W: 1<strong>01</strong>:55.263.4 hrs18 km28/1/20090432 GMTS: 74:57.71W: 1<strong>01</strong>:55.2630.5 hrs160km30/1/20090955 GMTS: 75:0.29W: 102:2.0833.7 hrs167 kmPlancontinued from previous pageComments and FaultsEM2000 set looking downwards. 4hour test mission.Approximately 55km under iceshelf at 100 m altitude. Turn onminimum headroom setting. Profileout the last 30 km. EM2000looking down.45km under the ice, turn south for10km at 200m altitude then returnto turn point at 100m altitude,then go north for 10km at100m altitude, return to turn pointat 200m then return to safe waypoint profiling from 500 to 900mdepth.Battery changed before mission. No problemsnoted.Vehicle turned around due to limited headroomas expected, but further limited headroom situationson the return caused collision avoidancebehaviour leading to a run back to the safe waypoint.Hence no profiling was carried out.Battery changed before mission. Completedsuccessfully, although the vehicle turned backearly during its northern leg after detecting adeep ice keel.Table 5: Summary of All Autosub-III Missions on N B Palmer 09<strong>01</strong>4 MooringsStan Jacobs, Scott Worrilow, and Raul GuerreroThree types of long-term mooring deployments were carried out during 09<strong>01</strong>, along with two mooring retrievals.Most of the O-274 moorings (14) were extended versions of the simple ’Bottom Landers’ set out byR Guerrero and F Nitsche during an early 2006 Polarstern cruise, in conjunction with our previous AmundsenSea project. Five of those were recovered during NBP07-02 and the 6th site was revisited on this cruise.Its release did not respond and dragging was not considered feasible because of that silence, substantial seaice cover and an iceberg over the mooring site. Examples of the 14 new moorings are shown in Fig 21. Themajority of these were set near ice shelf fronts in the southern Amundsen and near the continental shelfbreak (Fig 22) in water depths ranging from ∼600 to 1260 m (Table 6). Mooring heights above bottom werelimited by the need to stay below deep iceberg drafts, which we estimated to be ∼400 m.These bottom-anchored moorings were all deployed anchor first, as several were located in areas of >30%sea ice cover and/or where the bottom topography was rough or sloping. Each line included at least oneNortek Aquadopp or Alec AEM USB current meter and Seabird Microcat (SBE-37), plus two or moreSeabird temperature sensors (SBE-39). Single ORE releases, shallow CARTs or deep 8242s, were riggedabove 100-200 lb concrete block bottom weights. Nine inch and 12” trawl floats and a Novatech beacon atthe top completed each mooring, with all instruments mounted on 5/16” Samson Tenex line. Deploymentswere engineered by S Worrilow and R Guerrero, assisted by RSP MTs and others, including ECO personnel<strong>NBP09</strong>-<strong>01</strong> <strong>Cruise</strong> <strong>Report</strong> (p. 28 of 83) Revised February 27, 2009
S. Jacobs O-274-N Mooring Schematics - for deployment on NBP08<strong>01</strong>Slope (2) Inner Shelf (4)EnhancedInner Shelf (2)Outer/ShallowShelf (6)RadioRadioRadioRadio5/16” polytron,4m5/16” polytron,4m5/16” polytron,4m5/16” polytron,4m5/16 Tenex,250 m5/16 Tenex,250 m5/16 Tenex, 250 m5/16 Tenex,250 m5/16 Tenex,250 m5/16 Tenex,250 m5/16 Tenex,250 m5/16 Tenex,250 m5/16 Tenex,191m5/16 Tenex,191m5/16 Tenex,191m5/16 Tenex,6 m[note plastic thimbleat release end]900 m depth5/16 Tenex,10m5/16 Tenex,10m5/16 Tenex,10m14” Trawl float 9” Trawl floatAlec Compact EM current meterNortek Aquadopp current meter5/16 Tenex,6 m5/16 Tenex,6 m5/16 Tenex,6 mSBE37SM Microcat1100 m depth1100 m depth1100 m depthSBE39 TP recorderNotesLine shots terminated in thimbles - screw pin safety shackles betweenshots - no pear links except at releases and anchors for liftingAlec CM is in-line; all other instruments are clamp on.Drawing created 21 July 2008revised 22 July 2008ORE releases -8242XSCARTanchor (200 lb, 100 lb wet wt)Figure 21: B Huber mooring schematics for the 14-site ’BSR’ array deployed on the Amundsen Sea continentalshelf and slope during <strong>NBP09</strong>-<strong>01</strong>.<strong>NBP09</strong>-<strong>01</strong> <strong>Cruise</strong> <strong>Report</strong> (p. 29 of 83) Revised February 27, 2009
Figure 22: F Nitsche site map showing the locations of BSR and ITP moorings set from the NBP in early2009, and BML moorings set from Polarstern in early 2006. BML 1-4 were recovered in early 2007.Figure 23: ITP mooring deploynment photo showing tripod, ITP, and ice hole. Image c○ Maria Stenzel,2009<strong>NBP09</strong>-<strong>01</strong> <strong>Cruise</strong> <strong>Report</strong> (p. 30 of 83) Revised February 27, 2009
at the helm.The high iceberg production and retention rates in the eastern Amundsen restricts the use of this type ofmooring to the study of deep water variability, since much of the meltwater produced by the ice shelvesand icebergs appears to be in the upper 400m. Most instruments were located high on the moorings in anattempt to capture changes in the lower pycnocline and deep water volume on the shelf. To monitor changein the upper water column requires a different approach, and led this year to the deployment of an ’IceTethered Profiler’ of the type recently used with considerable success by Toole, Timmermans and Krishfieldin the Arctic. Indeed, the ITP we used is the one they first deployed in the Arctic and was refurbished bythat WHOI group for this project.While Arctic ITPs drift with the pack there and are rarely recovered, a drifting ITP on the Amundsencontinental shelf is likely to ground on one of its many shoals. We thus sought fast ice that seemed likely tostay fast for at least a year, in the greater Pine Island Bay region where both the deep water and shallowerlayers could be monitored over time. Options were limited during 09<strong>01</strong>, the overall ice cover being on thelight side. The location we settled on (Table 6) was about 6 km south of a fast ice edge that extendedeast from Bear Peninsula (Island). An ice edge has been encountered in that location twice previously, butit was much farther south in 2006 and 2007. Both the ice and snow cover at the ITP site were less thananticipated, but we delayed deployment to as late in the cruise as possible, and were beginning to see newice formation a few days later. The work went smoothly, in good weather and less time than planned, withthe instrument set to profile daily over the upper 750 m of a water column >1300 m-deep (Fig. 23). TheITP did not initially ’call home’ as soon as expected, occasioning a return trip to the site, but by the time itwas reached good-quality profiles were being received at the WHOI end of its Iridium link. Some mid-profiledegradation in salinity has since occurred, perhaps due to biofouling of the pump (M-L Timmermans, pc).The third mooring type consisted of a McLane Moored Profiler (MMP) and ASL Ice Profiler (AIP) anchoredin 4600 m well northwest of the Amundsen continental shelf (66 27 S, 129 28.2 W) for project O-261.Although the weather was deteriorating at the time of deployment, the work went well on an anchor-lastoperation. Unfortunately, the top buoy, meant to end up at 75 m, appeared at the surface during a subsequenttriangulation run. This necessitated recovery, since its AIP would not function there and its buoy wouldlikely work the wire and profiler to excess and then be enveloped in the sea ice. Release and recovery weresuccessful, but its line came up tangled and apparently stretched (the latter perhaps the underlying problem),and the lack of spare line precluded redeployment.Mooring # Latitude S Longitude W Depth (m) Date y/m/d CTD #BSR 1 71 10.539 102 24.498 1094 9/1/13 5BSR 2 71 43.351 103 03.147 744 9/1/14 7BSR 3 73 26.767 106 44.561 902 9/1/16 11BSR 4 74 21.637 104 53.346 1259 9/1/16 13BSR 5 75 03.356 1<strong>01</strong> 59.024 800 9/1/22 47BSR 6 74 54.861 1<strong>01</strong> 52.695 950 9/1/22 48BSR 7 73 09.657 114 59.187 750 9/2/03 113BSR 8 73 57.744 118 <strong>01</strong>.087 1242 9/2/03 117BSR 9 74 11.060 112 31.<strong>01</strong>4 1048 9/2/05 125BSR 10 71 02.159 105 59.948 1047 9/2/10 134BSR 11 71 07.847 106 00.114 520 9/2/10 135BSR 12 71 34.565 113 02.508 611 9/2/12 142BSR 13 71 23.276 113 23.961 1073 9/2/12 144BSR 14 71 57.537 118 27.781 602 9/2/15 157ITP 1 74 21.265 109 58.285 1340 9/2/05 126BML 5 71 08.21 105 39.97 540 6/3/18 302-1Table 6: Coordinates, water depths, dates and accompanying CTD stations for most of the moorings shownin Fig. 22.<strong>NBP09</strong>-<strong>01</strong> <strong>Cruise</strong> <strong>Report</strong> (p. 31 of 83) Revised February 27, 2009
5 Sea Ice StudiesTed Maksym, Sharon Stammerjohn5.1 Motivation and ObjectivesFigure 24: Station map showing locations of 20 sea ice stations. An AMSR-E image of sea ice concentrationfrom February 3 is shown for context. Note, the southbound leg (made during Jan 10 to 15) followed a lowsea ice concentration zone, which by February 3 became covered by sea ice advected in from north of theThurston Island area. Also, the last sea ice station (#20) was covered by higher concentration sea ice thanis pictured for February 3. (Map by Frank Nitsche.)Circumpolar sea ice extent in the Southern Ocean has modestly increased over the satellite observationalperiod (1970s to present). Lurking behind that circumpolar average however are large increases in sea iceextent in the Ross Sea sector, where the ice season has lengthened by almost 2 months over 1979-2007. Incontrast, sea ice extent in the AP-Bellinghausen-Amundsen Sea region has decreased, and at a faster rate,as revealed by a shortening of the sea ice season by up to 3 months, though over an ocean area that is littlemore than half the size of the Ross Sea sector.In the Amundsen Sea the largest area of sea ice change lies offshore of the shelf break, centered on 69-70 o S,107-110 o W, where sea ice duration became 83 days shorter over 1979-2007 (i.e., similar to sea ice changesupstream in the southern Bellingshausen). Smaller areas of change have occurred in Pine Island Bay (34days shorter) and in the vicinity of the Dotson (91 days shorter) and Getz (63 days shorter) Ice Shelves.<strong>NBP09</strong>-<strong>01</strong> <strong>Cruise</strong> <strong>Report</strong> (p. 32 of 83) Revised February 27, 2009
Seasonal sea ice changes in the Amundsen Sea appear to be more pronounced in spring, when the winddrivensea ice retreat can be up to 80 days earlier (whereas changes in the Bellingshausen Sea are morepronounced in autumn). An early retreat in the Amundsen Sea is usually followed by a later advance,though the magnitude of the advance anomaly is usually half that of the retreat anomaly (e.g. 40 versus 80days, respectively).Within this backdrop of Southern Ocean sea ice change, little is known about the snow and sea ice thicknessdistributions, the processes that control it, or the role that snow and summer surface melt processes play inthe persistence of the sea ice cover. This is particularly true in the Amundsen and western BellingshausenSeas which have until now been largely unsampled. Yet this region has some of the highest snow accumulationrates in the Antarctic. This deep snow cover plays a complex role in the sea ice mass balance through meltand refreezing and conversion of snow to ice through sea water flooding. These processes have implications forhow summer sea ice will respond to climate change, play a vital role in the structuring of sea ice ecosystemsin porous gap layers in the ice, and complicate satellite retrievals of snow and ice thickness. A major aim ofsea ice activities on <strong>NBP09</strong><strong>01</strong> was to better understand how these processes control sea ice mass balance.Within this context, sea ice studies on <strong>NBP09</strong><strong>01</strong> focused on assessing the properties of summer sea ice inthe Amundsen Sea (extent, thickness, growth/melt history, snow fraction, deformation and drift). Below inSection 5.2 we give an overview of our sampling approach and discuss general findings. In Section 5.3 wegive a more detailed description of methodology of our three main activities - shipboard observations of iceconditions, a sea ice sampling program, and deployment of instrumentation in the ice. In this section, wealso describe the various caveats of our approach, with emphasis on how it might be modified and improvedfor future missions.5.2 Overview of Sampling Approach and Initial FindingsDuring <strong>NBP09</strong><strong>01</strong> we made 197 underway hourly observations during approximately 13 full days in sea ice,held 20 sea ice stations and collected 92 meters of sea ice cores. Our stations and samples were distributedalong north-south and east-west transects in the region of the summer pack ice (Figure 24). The totalamount of ice core retrieved for structural analysis alone exceeded 52 m - comparable to totals obtained ondedicated sea ice cruises, but a record relative to total length of the sea ice team (3.6m). This is of particularsignificance, as sea ice physical properties have not been previously examined here. In all, the number ofsummer sea ice cores taken in the data-sparse Amundsen Sea has been more than doubled. We also deployed3 sea ice mass balance buoys which continue to dutifully phone home to tell us where they are and thatthey’re doing fine. These will for the first time allow continuous monitoring of multiyear snow and sea icesurface processes throughout the year. Combined with structural information from the ice cores and processmodelling, these data will help us understand the role these processes play in evolution of the sea ice coverand how these processes might modulate the response of sea ice to climate variability.Mean sea ice thickness of cores collected was 159 cm and ranged from 29 to 469 cm, while mean sea icethickness of the level ice observed while underway was 164 cm. However, both approaches (discrete sea icesampling and underway observations) were biased towards thinner ice, e.g. the ice team avoided samplingridges while the ship avoided navigating in heavy pack ice (e.g. Figure 25). (These caveats are discussedmore fully in Section 5.3.) We note however that the majority of floes sampled were flooded and deformed,and 9% of the surface ice area observed underway was ridged (yielding an estimated ridged thickness of 228cm).By week 6 (Feb 10 to 16), signs of autumn came with the appearance of grease ice and nilas within the icepack. Ice that survived the summer was either thick multiyear ice advected from the western Bellingshausennorth of Thurston Island, or heavily deformed first year ice that generally predominated the summer packice. Overall, the modest thickness of level ice (averaging less than two meters) was consistent with the verylow ice extent that occurred in the summer of 2007.Overall, there are two features which appear to play an important role in the persistence of summer sea ice<strong>NBP09</strong>-<strong>01</strong> <strong>Cruise</strong> <strong>Report</strong> (p. 33 of 83) Revised February 27, 2009
Figure 25: (top) A representative photo of a sea ice station showing moderate surface deformation and ridgingwith site selection in areas of surface level ice. (bottom) A representative photo of the under ice environmenttypical of summer sea ice, showing bottom melt features and biomass. (Photos c○Maria Stenzel.)<strong>NBP09</strong>-<strong>01</strong> <strong>Cruise</strong> <strong>Report</strong> (p. 34 of 83) Revised February 27, 2009
in the Amundsen Sea - (1) the confinement of drift ice by the Thwaites iceberg tongue, and (2) the importof thick multiyear ice from north of Thurston Island. The Thurston Island region is particularly interestingas it is a highly persistent region of perennial ice that appears to be maintained by a combination of highsnowfall and an unusually stable water column. Recent changes in ice extent and duration there may alsohave implications for the ice cover downstream in the Amundsen Sea.Generally, the underway sea ice observations qualitatively reflect the regional differences mentioned above.For example, average level (and ridged) sea ice thickness on our north-south transit (from the ice-coveredouter continental shelf south to open water in Pine Island Bay, Jan 12 to Jan 16), was 182 (and 253) cm.Average level (ridged) sea ice thickness on the subsequent northward but more westward transit (from thefast ice in Crosson Bay back to the outer continental shelf, Feb 5 to Feb 9), was 172 (246) cm. Continuingfurther west along the outer shelf (Feb 10 to Feb 15), average level (ridged) sea ice thickness was 141 (2<strong>01</strong>)cm. Thicker and more heavily ridged sea ice to the east is consistent with the probable import of multiyearice from the Thurston Island region, while thinner, less deformed sea ice further to the west (110-120W)indicated a predominance of local sea ice production.Preliminary analysis of samples taken suggests that the properties of Amundsen summer sea ice may havemore in common with previous observations in the Ross Sea than the Bellingshausen. Superimposed ice fromsnowmelt formed a relatively thin layer on most floes, and seawater flooding of the surface was observed atmost sites. Well-defined surface gap layers - important sea ice habitats - have been relatively infrequent.This is likely due to the high degree of deformation and surface flooding observed. Overall, this appears tobe consistent with a predominantly first-year summer sea ice cover.Snow depth averaged 47 cm. On the southward transect into Pine Island Bay the snow was warm andmelting, but by the time the pack ice was re-entered temperatures had cooled and the snow had begun tofreeze. Snow was predominantly icy and fresh even close to the slush/ice surface, suggesting there had beenat least moderate snow melt. However, snow crystal structure and the lack of thick layers of superimposedice suggest surface melt may have been modest. Average snow density was 400 kg m 3 .The flooding observed at most sites resulted in up to 39 cm of slush on top of the ice. In those cases wherethere was significant positive freeboard a thin layer of superimposed ice, formed from snowmelt, was present.In many cases, the location of the ice surface was unclear as the surface ice beneath the slush was often softand poorly consolidated. A thin ( 5 cm) layer of ice was often found “perched” above the slush layer similarto previous observations in the Ross Sea in summer. This was either superimposed ice or snow ice. AsFigure 26: Examples of thin and thick sections illustrating key processes. (A) Thin section of the upper partof an ice core above a gap layer from ice station 6. The very fine-grained granular structure (< 1mm) is likelysnow ice. (B) Thick section of a consolidated gap layer showing horizontal bands of bubbles. This suggeststhat the gap layer is snow ice. (C) Bottom section of a core from station 17 with platelet-like structureembedded in frazil and congelation layers. This is likely a refrozen void suggesting the ice was multiyear.(D) Thin section of buried superimposed ice formed from snowmelt from a multiyear ice core. (Photos byTed Maksym.)<strong>NBP09</strong>-<strong>01</strong> <strong>Cruise</strong> <strong>Report</strong> (p. 35 of 83) Revised February 27, 2009
mentioned, clearly defined gap layers were observed less frequently than for summer sea ice in the Weddelland Bellingshausen Seas, although evidence for high primary productivity in the upper portion of ice coressuggest that similar features (i.e., favourable growth habitats) were present but that perhaps the gap layerswere now mostly semi-consolidated.Ice cores were composed primarily of granular ice (e.g. Figure 26). Clear evidence for thick layers (> 10cm) of snow ice were observed in a limited number of ice cores. All but one core showed clear evidencefor deformational thickening. While congelation ice was observed in most cores, in only one case was acontinuous, undeformed layer greater than 20 cm observed. Superimposed ice crystals were frequentlyobserved, but clear layers with large polygonal grains (suggestive of substantial snow melt) averaged only afew centimeters thick.While much of the ice is expected to be first-year based on very light ice conditions observed in the Amundsenand Bellingshausen Seas the previous summer, this was difficult to confirm, even from surface appearance (i.eangular ridges). In several cores initially thought to be from floes less than a year old refrozen melt featureswere found. It is unlikely that large voids formed during this summer would have refrozen, indicating thatthis occurred at the end of the previous summer. This further suggests that much of the multiyear ice inthe Amundsen Sea may be advected in from the Western Bellingshausen.Taken together, these observations suggest the following preliminary assessment of the summer ice regime:• Initial ice formation in the Amundsen Sea was primarily through frazil/pancake ice formation.• Ice deformation is the primary means of thickening for ice that survives into the summer.• Surface snowmelt is relatively minor, particularly compared to previous observations in the southeasternBellingshausen Sea.• Snow ice formation is modest prior to summer. However, by the end of summer flooding is widespreadand snow remains deep, so snow ice formation can be expected to cause significant thickening ofmultiyear ice.Summer sea ice thinning and retreat is then controlled primarily by ice drift variability and disposition ofsolar energy in the ocean. A key question is how change or variability in snow accumulation or summersurface melt processes might affect ice thickness and modulate sea ice response to climate variability. <strong>Data</strong>collected by the ice mass balance buoys described below is expected to help answer this question.5.3 Methods and CaveatsASPeCt Ice Observations and Automated Camera SystemHourly observations of sea ice conditions were carried out while the ship was operating in ice using thestandard Antarctic Sea Ice Processes and Climate (ASPeCt) protocol (Worby, 1999). The hourly observationsrelied heavily on a handful of intrepid volunteers, whom the ice team would like to gratefully acknowledge(in alphabetical order): Pierre Dutrieux, Adrian Jenkins, Katie Leonard, Chris Little, Ken Mankoff, FrankNitsche, Robin Robertson. Though we attempted to engage more volunteers by giving an overview of theASPeCt protocols at the beginning of the cruise, we suspect that the level of detail required by the protocol,as well as the ambiguity regarding ice types, daunted most would-be volunteers. We therefore emphasizedthat the most important estimates to make were (in order of importance): ice thickness, ice concentration,snow thickness, followed by ridged areal coverage, ridge sail height and ice type. Unfortunately, obtaininggood estimates of snow and ice thickness when transiting through open summer pack ice is difficult, sincethe passing of the ship does not tend to turn over the floes but instead pushes them aside, (that is, when theship actually ventures into the pack ice). More often than not, the ship preferred navigating the leads, somost estimates of ice thickness were made without the aid of the ’bouncing ball’. Other known difficultiesare estimating ridge sail height from a 20 meter high bridge. (We thus encouraged observers to occasionallyventure down to the main deck to re-calibrate their view of sail height from near-ground level.)<strong>NBP09</strong>-<strong>01</strong> <strong>Cruise</strong> <strong>Report</strong> (p. 36 of 83) Revised February 27, 2009
An automated camera system provided by Steve Ackley was installed on <strong>NBP09</strong><strong>01</strong> to provide a digitalarchive of the underway sea ice observations. One camera was mounted on an outside railing 1 deck abovethe bridge (outside the ice tower) with an oblique view of the area just aft of starboard. Another camerawas mounted on the <strong>01</strong> starboard railing, pointing down over the bouncing ball. The former view will bedigitally ortho-rectified by Ackley’s UTSA group (led by Blake Weissling) to provide quantitative estimatesof sea ice concentration. The latter ’bouncing ball’ view was intended to archive ice thickness, but given thelack of over-turned floes in summer pack ice, its archive will be of limited use. Also, as first-time installersand users of the camera system, we encountered some difficulties. The <strong>01</strong> ’EisCam’ was not functioning formost of the initial southward transect through ice (likely a wiring issue), and some hourly video feeds werelost due to software glitches. Despite these problems, we managed to archive most of the oblique views, andwe look forward to seeing post-processed results by Ackley/UTSA.Snow and Sea Ice SamplingFloe Selection and Deployment Sampling of sea ice and snow was carried out at a total of 20 icestations. This was facilitated by the “near optimal” ice conditions that were encountered. The lack of ice inPine Island Bay and north of the Getz and Dodson ice shelves permitted timely completion of Autosub andoceanographic work in these areas, and the light conditions in the main pack ice to the north kept transittime between stations relatively low. This allowed more time for sea work than originally anticipated, whilenorth of the polynyas there was sufficient ice along most of the cruise track that a suitable floe could be foundfor sampling along-track. In a few cases the ship was diverted into heavier ice for a few miles - primarily tofind sites suitable for deployment of instrumentation.Because of operational constraints and the thick and heavily deformed ice, sampling was generally confinedto ice in areas of low to moderate concentration (< 70%), or within a few tens of miles of the ice edge.This may introduce a potential bias in the observations to favour areas where melting conditions were moreprevalent than in the inner pack. There is no reason to suspect a bias in ice type or snow conditions, however.The cruise track allowed sampling along both the southern and northern edges of the Amundsen pack, as wellas transits through both the eastern and western sides of the pack and forays deeper into the cental pack,so that the sampling strategy is likely to have captured the overall variability in ice conditions in the region.The possible exception is an area of persistent heavy ice North of the Thwaites iceberg tongue, centered atroughly 72.5 o S and 111 o W.Although the number of ice floes occupied more than doubles the previous total for sampling summer seaice physical properties in the Amundsen, the dataset is fairly small for a robust statistical characterizationof the pack. Focus was therefore placed on resolving processes that control the summer evolution of sea ice,such as flooding and snow ice formation, snow melt and superimposed ice formation, and internal ice meltand the formation of gap layers.Sampling strategy was therefore not to select floes at random as is typical of dedicated sea ice cruises, butrather floes were chosen to best span the range of ice conditions, while focussing on level pans within thicker,older (and moderately deformed) ice floes (Figure 25Top). Despite the surface appearance of level ice atmany of our sampling sites, the underside was often quite a different story (Figure 25Bottom) as revealedby the photographic prowess of Maria Stenzel with logistical prowess from Zim Zimmerman, Julie Jackson,Amy Schaub and Mike Lewis.Heavily deformed sites were avoided to best facilitate interpretation of growth conditions and comparisonwith models. In the outer pack ice region, this was impossible as almost all floes were heavily deformed.At these sites, sampling was carried out away from ridged areas as best as possible. Fast ice sites werepreferentially sampled since these offer the best opportunity for model comparison, as the history of the iceis most readily determined via satellite imagery and deformation is least likely.Most floes selected were a few hundred meters or more across to facilitate station keeping as close-packedice was rare. Once a suitable floe had been selected the ship would either position alongside the floe for<strong>NBP09</strong>-<strong>01</strong> <strong>Cruise</strong> <strong>Report</strong> (p. 37 of 83) Revised February 27, 2009
deployment by personnel basket via the aft crane, or bow in about one-half ship length for deployment viathe forward crane. For the first several stations the aft crane was used, but this was then switched to forwarddeployment for most of the remaining stations since this was usually quicker and easier to keep station. Whilecracking of floes aft of the forward crane was common, the ice was usually soft so cracks rarely propagatedfar forward of the bow. The bridge took particular care in parking the ship, and as a result we never had toreseat the ship after deployment.Three to four people and sampling equipment were deployed at a time using the personnel basket. A typicalice station that included a snow pit and two ice cores of 2-3 meters in length took 2-3 hours on the ice. Floeselection, ship positioning, and deployment on the ice typically took an hour or more. Including time spentdiverting off the ship track to find suitable ice on a few occasions, total ship time devoted to sea ice work isestimated to be about twice the actual on ice time.Once on the ice, a representative area of level ice and snow was chosen for sampling. In most cases, this waswithin 50-100 meters of the ship. The major exceptions were sampling in conjunction with deployment ofice mass balance buoys (IMBs) where sites were selected as far from the ice edge as was practical.Ice Coring At the sampling site snow was cleared from the ice surface and ice cores were taken with a 7.5cm bore Kovacs ice corer. In most cases, two complete cores were taken at the same site - one for salinityand one for structure. The only exception was on station 5, a thick multiyear ice site where deep snow andsoft, wet ice made it difficult to retrieve the deeper parts of the core. Here only the top two meters wereretrieved for salinity, and just over five meters were retrieved for structure. Most cores were retrieved usinga gas-powered motor mounted on the corer. This proved to be efficient and retrieved good-quality cores inmost cases. Difficulties were encountered mainly when ice shavings or snow built up in the hole. This couldbe avoided if shavings are continually cleared while drilling and snow pits are well cleared when deep snowis present. For soft ice, particularly for the surface section where gap layers were often present, coring wasdone by hand to minimize breakage (or when we desired a bit of exercise).As the salinity core was retrieved, each section was cut with a handsaw into 10 cm sections and placedimmediately into 2 quart plastic buckets to minimize brine loss from the often very soft and porous ice.Temperature was measured for each section using a digital thermometer inserted into drilled holes in theice. These samples were later analyzed onboard for salinity and chlorophyll content and samples drawn forδ 18 O.A second core was taken and placed into polyethelyene bags and cooled on the ice with saline ice packsto begin freezing the cores before their onboard placement in a freezer container in the ship’s hold forstructural analysis. In many cases, the gap-layer ice was unconsolidated and slushy and not suitable forstructural analysis. In these cases the ice was placed in plastic buckets for later analysis of salinity and δ 18 O.When the ice was flooded, there was often a perched ledge of ice at the base of the snowpack. If the slushbeneath this ledge was well-consolidated, the entire thickness was retained for structural analysis. If not,the core was taken from the consolidated ice surface and the ledge was sampled separately.After coring, the ice thickness was measured with a thickness tape and the freeboard noted. Positions andthicknesses of any gaps in the ice were noted when possible.As mentioned above, at several sites, the photographer, aided by the MTs and/or idle scientists, drilled a5 inch auger hole near the coring site to take photographs of the underside of the ice using an underwaterhousing mounted on a long, extendable pole. Many of the photographs were very enlightening and informativeabout the under-ice topography. It would be worthwhile in the future to use a simple cheap camera (that is,when professional photographers are not available) with a remote shutter release to take under-ice imagesat all coring or drilling sites.Snow sampling Snow properties were examined either at a site adjacent to the coring site if the snowwas fairly homogeneous, or in the same pit. The snow stratigraphy was examined for crystal structure, the<strong>NBP09</strong>-<strong>01</strong> <strong>Cruise</strong> <strong>Report</strong> (p. 38 of 83) Revised February 27, 2009
presence of ice layers and wicked brine. Temperatures within the snow were determined at 5-10 cm intervalswith a handheld digital thermometer with a thermistor probe. Snow densities were determined using eithera 100 cm 3 rectangular sampler with 3 cm resolution, or a 250 cm 3 wedge sampler with 10 cm resolution,depending on snow thickness and hardness; deep snow was more coarsely sampled. When the entire snowcolumn stratigraphy was not sampled, at least each stratigraphic layer was sampled. Density was determinedon the ice using an Ohaus CT600 portable balance. Samples were then placed in plastic bags to be meltedonboard for salinity and δ 18 O. At flooded sites, the slush was filtered through a 250 µm mesh for analysis ofthe brine on board. Complete slush samples were also taken where possible without drainage of brine.Shipboard Analysis Salinity core samples were allowed to melt in plastic buckets in the dark. Duringperiods of intensive sea ice sampling some samples were stored in the freezer in Ziploc bags and melted inbuckets later. Salinity was measured using an Orion 115 conductivity meter. Between 15 and 30 ml of themelt water were then sealed in either Nalgene HDPE bottles or polypropylene centrifuge tubes (when weran out of bottles) sealed with Parafilm. These samples will be analyzed at UC Santa Cruz for δ 18 O. Meltedsnow samples were also measured for salinity and bottled for later δ 18 O analysis.Up to 250 ml of the remaining water was filtered onto 47 mm glass fibre filters and frozen immediately at-20 o C in centrifuge tubes for later chlorophyll analysis. When convenient, chlorophyll samples were run inbatches using a Turner designs 10AU fluorometer. Samples were first dissolved in 7 ml of acetone for 24-36hours in the dark at 4 o C. Samples were diluted as necessary in acetone and a measurement was taken todetermine Fo. Two drops of 1.2M HCl were added to each sample and a second measurement was taken forFa. The biologists onboard were very helpful with advice, equipment, calibration of the fluorometer, andassisting in calculation of pigment concentrations.Analysis of ice core structure involved cutting of thick and thin sections and photographing of pore and crystalstructure. The time spent during Autosub operations in ice-free Pine Island Bay allowed the opportunity totry a number of techniques for cutting thin sections. In order to best preserve the microstructure for microandmacro- photography, a double-microtoming technique was chosen. First, the core was cut in sections ofup to 20 cm and the halved lengthways with a bandsaw. These were sanded smooth and then fixed to glassplates with a bead of fresh water. The plates were warmed slightly to achieve a good seal. A thick section(< 3 mm thick) was then cut on the bandsaw and smoothed on a Bright series 8000 sledge microtome. Theice was then flipped on the plate and resealed, taking care to achieve a good seal with minimal melting. Thesections were then thinned to between 0.5 mm and 1.5 mm depending on crystal size and fragility of the ice.A total of 137 thin sections were made. A custom stage was made for the microtome, but it was difficult tolevel accurately, which complicated the double-microtoming process.Sections were photographed under polarized and transmitted light to determine structure (e.g. Figure 26),density, and void distribution. Macro photography was done using a Nikon D50 digital camera with eithera 18-55 mm zoom or a 105 mm macro lens. Selected portions of the cores were photographed using a Nikon5500 Digital camera mounted on a Leica Wild M3C microscope at between 6.4X and 40X. Based on theobserved structure, half the core was sectioned and melted for a second determination of salinity and laterδ 18 O analysis. The remaining half of the core was retained for later thin sectioning back in the UK. Somesections will be sent to a colleague at Dartmouth College to examine three-dimensional pore structure usingx-ray tomography.After leaving Pine Island Bay, there was insufficient time to continue extensive processing. For the remainingcores, thick sections 2.5-5 mm thick were cut unmounted. It was found that these could be adequatelysmoothed by hand to eliminate saw marks in the photographs. These were photographed only for large-scaleanalysis. Selected sections of the remaining half-cores will be thin sectioned in the UK.Ice core analysis was carried out in a 20 ft freezer container kept in the ship’s hold. This provided more spacethan the old walk-in freezer (now the Autosal room) and was fairly stable for photography even in roughweather. A few problems did occur. First, the defrost cycling for much of the cruise would occasionallywarm the freezer to greater than -10 o C. This seemed to fix itself towards the end of the cruise. Temperature<strong>NBP09</strong>-<strong>01</strong> <strong>Cruise</strong> <strong>Report</strong> (p. 39 of 83) Revised February 27, 2009
variations meant that the first half of the ice was processed at about -15 o C, with some sections a few degreeswarmer. The latter half was typically at about -18 o C. Unfortunately, temperature variations were not notedduring photography.Ship vibration also hampered photography. Vibration was minimized by mounting the light table and camerastand on foam and holding the lens steady. A camera stand that dampened vibrations in the light table,camera, and lens would be helpful. The light table provided by Raytheon was old, dim, and brightnessvaried, particularly when cold.The digital camera for the microscope was old, slow, and rather finicky. It was difficult to focus. A lensmount for a digital SLR camera would be useful.5.4 Ice Mass Balance Buoy and Drifter DeploymentsInstrumentation available for deployment on the ice included four GPS drifers (PI Ackley), one CRREL icemass balance buoy (IMB, PI Ackley), and 3 mini-IMBs provided by the Scottish Association for MarineScience in collaboration with BAS.The four GPS drifters were initially intended for IPY SIMBA project (NBP0709). However, deck tests at thebeginning of that cruise revealed transmission problems presumably due to a cold-temperature sensitivity.Those units were returned to the manufacturer (Trident Sensors) for testing and possible replacement orrefurbishment. Four of those repaired/replaced units were made available for deployment on <strong>NBP09</strong><strong>01</strong>.Unfortunately however our deck tests revealed that 2 of the 4 drifters continued to have chronic transmissionproblems, while the other 2 appeared to reliably transmit on the helo deck even during a cold temperaturesnap where temperatures decreased to -19 to -20 degC. We therefore decided to deploy the 2 operationaldrifters, only to discover that 1 of the 2 also succumbed to transmission problems. We therefore weresuccessful in deploying only 1 working ice drifter. The 2 chronic drifters will be returned once again to themanufacturer for further testing.A CRREL IMB (lead PI Ackley) was deployed on the fast ice in front of the Crosson Ice Shelf, alongsidean WHOI ice-tethered profiler (ITP). The CRREL IMB consists of a 4.5 meter thermistor string (sectionedinto 1.5 meter lengths), with thermistors spaced 10 cm apart for a total of 45. Additional sensors aremounted on two PVC masts, one extending mostly underwater, supporting an upward looking sounder,mounted at about 1.5 meters below the bottom ice surface, for measuring changes in distance to bottom icesurface and a SeaBird SBE39 for measuring temperature, conductivity and pressure. The other PVC mastsupported a downward looking sounder, mounted at about 2 meters above the snow surface, for measuringchanges in distance to top snow surface. The two sounders combined yield estimates of ice mass balancechanges. The surface mast also supports an air temperature probe housed inside a gill plate. All mastsand thermistor strings are white to decrease heat absorption during sunlit days. Each sensor is hookedto a data logger enclosed in a protective white box, which also houses a barometric pressure sensor, theGPS antennae/receiver and Argos transmitter. To date, the CRREL IMB is reliably transmitting all data,though there are indications that the surface air temperature probe is not functioning properly. Fortuantely,the thermistor change extends approximate 1.35 meters above the snow surface, thus providing additionalsurface air temperature readings.The deployment site for the CRREL IMB was on fast ice north of Crosson Ice Shelf at about 3 miles south ofthe fast ice edge and in the near vicinity (within 15 meters) of the WHOI ITP. The deployment site consistedof fairly level ice, averaging at about 50 cm thickness, located southward of an area that was moderatelyridged. Given the 50 cm ice thickness, we decided to overlap the 3rd thermistor section with the other twosections that were in series. This allows 5 cm temperature resolution through the ice-snow-air layers (i.e.,from -50 cm to +80 cm relative to the ice surface).In addition to the CRREL IMB, two SAMS IMBs also were deployed. The SAMS IMBS are designed asa low-cost, easily deployable alternative to a full IMB, with the future potential for deployment of a large<strong>NBP09</strong>-<strong>01</strong> <strong>Cruise</strong> <strong>Report</strong> (p. 40 of 83) Revised February 27, 2009
enough number to be able to regionally charcterize ice growth and melt processes. The design consistsof a single wire of addressable digital temperature sensors with 1/16 of a degree resolution. Each stringconsists of 144 sensors with a 4 cm spacing mounted on a thin flexible PCB that was weatherproofed inheatshrink. Each has a surface mounted resistor that heats the sensor when a voltage is applied, allowingthe thermal response of the sensor to be monitored. This ”hot-wire anemometer” mode will in principle allowdiscrimination of the medium that the sensor is in (i.e. snow, ice, air or water) and hence determination ofsnow and ice thickness without the need for acoustic sounders. A particularly advantageous feature of thissystem is the potential to continuously monitor surface processes such as flooding, snow ice formation, andsnow melt. These processes are a particular focus of the sea ice program.<strong>Data</strong> is recorded using a Persistor CF2 logger and transmitted via Iridium modem. To reduce power consumptionand data transmission costs, temperatures are recorded 4 X daily, and a heating cycle is appliedonce per day. Power is supplied by 80 alkaline D-cell batteries. All components other than the sensor chainare enclosed in a 1550 Pelicase (20 cm x 35 cm x 50 cm).This is the first deployment of these systems in the Antarctic. Modifications from the design used in theArctic include a longer chain to accommodate thick ice and snow and finer sensor spacing to resolve surfaceprocesses.To deploy the IMBs, 2 meters of the sensor chain were cable tied to a 2” diameter ABS pipe to supportthe sensors in the snow and air. This was fixed in the field via a threaded joint to a second pipe that wassecured in a 2” auger hole in the ice. The remaining sensors were run along the ice surface to a hole 40 cmaway and dropped through a drill hole through the ice.Two systems were deployed. A third failed during testing on the helo-deck due to failures in both the sensordriver module and the Persistor logger. The cause of the first failure is unclear, but it is probable that ashort damaged the logger. The first system was deployed at ice station 11 on the Northwest side of theThwaites iceberg tongue. This site was chosen as it was well protected by icebergs and fast ice to the east sohad a fair chance of surviving into the winter. High Resolution ASAR data was provided by BAS under theauspices of the European Polarview project was particularly useful in locating the site and finding a routethrough the iceberg tongue. The IMB was deployed in 2.7 m of sea ice about 1/2 mile from the fast ice edge.At this site, the snow was removed in blocks prior to drilling and then replaced around the snow mast. Thisprevented wetting of the snow, but it is likely that there were air gaps between sensors and replaced snowso that detection of snow in the heating cycle is difficult. The second IMB was deployed at ice station 13 ona roughly 500 m floe in the middle of the pack ice band. The ice was 2.0 m at this site. Rather than clearthe snow, holes were carefully drilled through both the snow and ice. Crushed snow was packed in the gapsaround the sensors to ensure good contact. Both sites were flooded. Deployment of each station took about2 hours.Initial analysis of the data show that the different layers can be resolved, but the thermal response of snowand air are only slightly different. This may be because the response is detected using the temperature riseafter a one minute heating cycle. This may not be sufficient time for the heat to flow through the heatshrink on the sensor chain and deeply into the snow. It may be better to transmit temperature informationat several points during a cooling cycle, similar to what is done with needle probe measurements of thermalconductivity. Further testing of alternative potting methods to reduce thermal mass of the chain would beworthwhile.5.5 Remote Sensing SupportHigh-resolution satellite data has proved indispensible on previous cruises to support navigation through iceand to find suitable ice floes for sampling and instrumentation deployment. Useful satellite data availableon <strong>NBP09</strong><strong>01</strong> consisted of near-real time acquisition of visible OLS (0.55 km resolution) and SSM/I passivemicrowave (12-25 km resolution), and visible band AVHRR (1.1 km resolution) using the Terrascan system.<strong>NBP09</strong>-<strong>01</strong> <strong>Cruise</strong> <strong>Report</strong> (p. 41 of 83) Revised February 27, 2009
Infrared was less useful because of low variability in surface temperature in summer.This was supplemented by imagery provided through the European Polarview program. This is a multinationalprogram designed to provide a variety of products to ships operating in ice-covered waters. Severalnational Antarctic programs use a variety of data routinely aboard ships where large-bandwidth data transmissionis available.AMSR-E, Quikscat POL, and reduced resolution ENVISAT ASAR 3-day composites were provided byRoberto Saldo at Denmark Technical University. Pre-arranged acquisition of wide swath ASAR was facilitatedby Andrew Fleming at BAS, who sent high resolution sub-images upon request to the NBP. ASARimagery proved extremely helpful in identifying areas of both pack and fast ice suitable for deploymentof instrumentation. It was indispensible in finding fast ice in the Western Pine Island Bay, and aided inlocating a fast ice site for one of the BAS IMBs and the ITP/IMB site. However, it was severely limitedwhen the ship was operating outside of INMARSAT range. File size restrictions on email - even on specialaccounts - severely limited image quality. It would be worth pursuing having a separate system for stagingimagery to be sent via Iridium. It is also worth implementing a means for downloading imagery over theweb via Iridium. This has been done successfully on other ships. The advantage is that imagery can bebrowsed at low resolution at the Antarctic Polarview node website, and subregions may be downloaded athigh resolution.Visible OLS was useful when weather was clear, which occurred several times during the cruise. Quikscatwas of little use. It often is useful in delineating the full extent of sea ice, but it seemed to consistentlyoverestimate ice extent.Perhaps the most used sources of imagery were passive microwave from SSM/I or AMSR-E. Qualitatively,both did a fairly good job at detecting sea ice extent, with errors usually smaller than expected for this timeof year. There are some caveats regarding its use for navigational purposes, however:The Terrascan system onboard provided ice extent using a number of algorithms, with often quite differentresults. Some of these appear to use a 15% cutoff as implemented on the NBP (such as the Artist algorithm),while others do not (such as SeaLion and Bootstrap). Some of the Algorithms provide a higher resolutionproduct (SeaLion and Artist), but do so by using the 89 GHz Channel. This is much more subject toweather effects than the other channels and so can produce large errors in ice concentration. While thebootstrap product is lower resolution, it appeared to be less affected by spurious day-to-day variations in iceconcentration. This can be confusing to those less familiar with this type of data.During <strong>NBP09</strong><strong>01</strong>, satellite ice concentration varied considerably in the pack ice north of the coastal polynyasduring late January - early February. This is likely due to surface emissivity variations associated with meltfreezecycles and weather. Again, the Bootstrap algorithm performed better at the cost of lower resolution.There appear to be issues with the F15 satellite. This showed very little ice compared to others on manyoccasions.AMSR-E provides a more reliable ice concentration than the SSM/I products at equivalent resolution(SeaLion and Artist), but is still subject to some of the same problems with surface emissivity variation.However, as this is not available via Terrascan, it was often 1-2 days late.5.6 ReferencesHaas, C., D.N. Thomas and J. Bareiss (20<strong>01</strong>), Surface properties an processes of perennial Antarctic sea icein summer, J. Glaciology, 47, 613-25Worby, A.P. and I. Allison (1999), A technique for making ship-based observations of Antarctic sea icethickness and characteristics. Part I. Observational techniques and results. Antarct. CRC Res. Rep. 14,1-23.<strong>NBP09</strong>-<strong>01</strong> <strong>Cruise</strong> <strong>Report</strong> (p. 42 of 83) Revised February 27, 2009
6 Seafloor MappingFrank Nitsche, Kathleen Gavahan6.1 ObjectiveA large portion of the bathymetry of the continental margin around Antarctica is still unmapped. In theAmundsen Sea, scientific questions concerning warm water entering the shelf and collecting in deep innershelf troughs depend on the local and regional bathymetry. Detailed bathymetry data were also neededto determine depth and location of CTD and mooring sites as well as for planning Autosub operations.Improving the existing bathymetry of the Amundsen Sea continental shelf also better defines existing troughsand supports reconstruction of past ice flow on the continental shelf.We have thus been running the swath-mapping system throughout <strong>NBP09</strong><strong>01</strong> The main mapping teamconsisted of Kathleen Gavahan (Raytheon) and Frank Nitsche (LDEO) and was supported by several others,especially Ken Mankoff, Adrian Jenkins, Robin Robertson, Chris Little, Stan Jacobs, Andy Webb, PierreDutrieux, and Sharon Stammerjohn, who helped edit raw multibeam files.6.2 System Description and OperationThe main equipment used for seafloor mapping on this cruise was the Simrad EM-120 swath-mapping system.It operates at a 12 kHz main frequency and receives up to 191 beams from angles up to 65 o to each sideof the ship, providing a resolution of ∼1.5 o of the seafloor and a coverage of ∼4 times the water depth.To adjust for changes in sound velocity, CTD and XBT data were used to update to the local conditionsthroughout the cruise.The raw data are recorded digitally and displayed in real-time. Once a day the raw data were processed andedited manually for outliers and false bottom returns using the mb-system 5 software package. The finaldata are stored in MBsystem format 57 and will be archived at the Antarctic Multibeam Synthesis <strong>Data</strong>base(http://www.marine-geo.org/antarctic/).In addition to the swath-mapping system we almost continuously ran a sub-bottom profiler to provideindependent depth measurements. Sub-bottom data can also be used to determine sediment sample locations.At the start of the cruise a Knudsen 320B echosounder with 3.5 kHz main operating frequency was used.From January 16th 2009 we used the Ocean <strong>Data</strong> Equipment Corporation Bathy 2000 echosounder andsub-bottom profiler. The Bathy 2000 transmits a chirp signal of 3.5 to 4 kHz. It determines the bottomand images the uppermost subbottom sediment layers down to a few 10s of meters depending on sedimentcharacter. The data were archived digitally in the Bathy2000 variant of the SEGY-format.Additional bathymetry data of previous NB Palmer , JC Ross, Polarstern, and Oden cruises provided extraguidance and helped to avoid accidental duplication of existing tracks.6.3 System Performance and ProblemsThroughout the cruise, both the EM-120 swath-bathymetry and the Bathy2000 echosounder operated normallyunder most conditions, but had problems with receiving good data in sea ice. The Bathy2000 wasonly disturbed by heavy pack ice but the EM-120 multibeam had problems with heavy pack ice and certaintypes of newly formed ice such as grease ice and nilas. The ice gets under the ship, blocking signals comingto and from the transducers, producing bad data even in easy and calm conditions. We rarely encounteredsuch ice conditions during <strong>NBP09</strong><strong>01</strong>, but a larger issue was the drastic drop in data quality in rough seas.<strong>NBP09</strong>-<strong>01</strong> <strong>Cruise</strong> <strong>Report</strong> (p. 43 of 83) Revised February 27, 2009
Figure 27: Sun-illuminated bathymetry of the inner Pine Island Shelf before (top) and after (bottom) themapping of <strong>NBP09</strong><strong>01</strong>. Background is a MODIS from NSIDC (December 2008).<strong>NBP09</strong>-<strong>01</strong> <strong>Cruise</strong> <strong>Report</strong> (p. 44 of 83) Revised February 27, 2009
Due to the location of the transducers it is likely that they are effected by air bubbles generated by thewaves and ship-sea interactions.The SeaSurveyAdvanced display software allows real-time display of new and pre-existing multibeam data,an essential tool for route and station planning as well as for ship navigation. The additional helmsmandisplay on the bridge allows the mates to steer a course designed to ensure maximum coverage by notduplicating pre-existing data from the NBP, BAS, and AWI. Occasionally there were problems with thissoftware and/or its computer due to age and software. An upgrade or replacement in the near future ishighly recommended.6.4 Results: Swath-BathymetryDuring this cruise we collected and processed 11912 km of multi-beam swath data (540857 pings, 103303687beams (soundings) representing ∼11.9 GigaBytes of data.Figure 28: Preliminary version of the updated Amundsen Sea bathymetry compilation.Most of the newly acquired bathymetry data cover previously uncharted areas, adding significantly to ourunderstanding of the regional bathymetry.Work is needed to reconcile significant swath-map differences between various ships, probably due to variedassumptions about sound velocity. In addition, some earlier MB data have not been ping-edited completely.Pine Island BayAs result of Autosub operations under the Pine Island Ice Shelf the NB Palmer spent ∼two weeks in thisarea and mapped the Pine Island Bay seafloor in some detail. Systematically adding to existing data resulted<strong>NBP09</strong>-<strong>01</strong> <strong>Cruise</strong> <strong>Report</strong> (p. 45 of 83) Revised February 27, 2009
in a comprehensive bathymetry image of the area, as shown in figure 27 that shows the morphology of theseafloor right in front of the ice shelf in great detail. Much of the remaining unmapped area is shallow andincludes small islands, or access was blocked by sea ice and icebergs.Updated Amundsen GridThe new bathymetry data collected during this cruise will be used to update the existing bathymetrycompilation of the Amundsen Sea (Nitsche et al 2007). Beside the Pine Island Bay trough, improvements ofthe overall bathymetry image were made along most of the cruise track, especially in the outer shelf region,and the central ridge separating the Pine Island-Thwaites trough system from the Getz trough system (Fig.28).6.5 Results: Sub-Bottom ProfilingDuring the cruise the Bathy2000 sub-bottom data were mostly used as an additional source for bathymetricdepth information. We did not perform a systematic analysis of the sub-bottom data during the cruise,but they are digitally available and will aid the interpretation of morphological features identified in theswath-bathymetry mapping.Nitsche, F.O., Jacobs, S., Larter, R.D. and Gohl, K., 2007. Bathymetry of the Amundsen Sea ContinentalShelf: Implications for Geology, Oceanography, and Glaciology. Geochemistry, Geophysics, Geosystems, 8:Q10009, doi:10.1029/2007GC0<strong>01</strong>694.7 Onboard numerical modelingChris LittleA modified version of the Hallberg Isopycnal Model (HIM) was used to aid the interpretation of oceanographicprocesses under the Pine Island Ice Shelf (PIIS). An idealized ice shelf shape based on earlier studieswas gradually modified to represent PIIS. Although only the most ”realistic” model run is presented, thosefindings highlighted here are relatively insensitive to details of cavity shape and oceanic forcing. The numericaldomain employed in this simulation was 80x100 km, discretized on a 1 km horizontal grid. The oceanconsists of 10 isopyncal layers coupled to a bulk mixed layer; the depth of the ”mixed” layer is determinedby a turbulent kinetic energy budget. Ice-ocean fluxes through a viscous sub-layer parameterization aregoverned by mixed layer temperature, salinity, and flow speed.7.1 Bathymetry and Ice ThicknessThe water column thickness – depth of ocean floor minus the depth of the ice shelf base, if present – for thissimulation is shown in figure 29. Bathymetry was derived from multibeam maps of Pine Island Bay and from”BEDMAP” where bathymetric data were unavailable (i.e. underneath PIIS). The model’s ice shelf draftwas derived from BEDMAP ice thickness data assuming a constant ice density (0.917 kg m −3 ); the groundingline is located where the floating ice thickness is less than the bedrock depth. The lack of bathymetry andice thickness data in the ”northern lobe” of PIIS makes its role in the sub-ice shelf circulation difficult todetermine.Higher resolution datasets show evidence that PIIS is heavily crevassed, and previous studies indicate thatsub-ice topography influences flow. To illuminate the effect of inverted basal channels of different dimensions,<strong>NBP09</strong>-<strong>01</strong> <strong>Cruise</strong> <strong>Report</strong> (p. 46 of 83) Revised February 27, 2009
Figure 29: Water column thickness (m) over the model domain.the ice shelf draft was altered by an increment that varied sinusoidally transverse to the longitudinal axis ofthe ice shelf. This alteration modified the ice shelf draft (contours in figure 30) by up to ∼100 meters.7.2 Model ForcingThe model simulation was initialized with a meridionally uniform temperature and salinity profile correspondingto <strong>NBP09</strong>-<strong>01</strong> CTD 14. Flow was initiated and maintained by buoyancy fluxes at the ice-oceaninterface. No winds or tides were prescribed. During the simulation, the hydrography was restored to theinitial conditions in the western 15 km. The model was integrated for 20 days, at which point the kineticenergy of the flow stabilized. The strong restoring may have limited accurate representation of the locationof inflow as well as ice front hydrography. When more computational resources are available, that sensitivitywill be explored.7.3 Preliminary ResultsGiven our still limited knowledge of ice shelf basal topography, sub-shelf bathymetry, and forcing, modelresults are primarily qualitative. However, there is encouraging agreement between the observed and modeledocean circulation and melting patterns. In figure 30, heightened melt rates occur in three distinct locationsdriven by differing dynamics: near the deepest parts of the ice shelf grounding line, near the ice shelf front,and in inverted channels at the ice shelf base.The depth integrated flow illustrated in figure 30 obscures vertically sheared currents underneath the iceshelf. Heat used for melting is derived primarily from the densest, warmest waters respresented in thesimulation (CDW); virtually all heat entrained into the mixed layer occurs within 10 km of the grounding<strong>NBP09</strong>-<strong>01</strong> <strong>Cruise</strong> <strong>Report</strong> (p. 47 of 83) Revised February 27, 2009
Figure 30: Ice shelf basal melt rates (m yr −1 , shading), depth-averaged velocity (m s −1 , vectors), and iceshelf draft (m, contours).line. In the model, sub ice channels appear to play a major role in determining where glacial meltwater exitsthe cavity, but their effect on the overall and regional basal melting rate is less clear.Meltwater-enriched seawater is exported in well-defined cores of outflow, separated in depth and locationalong the ice front. Lighter, colder water escapes the cavities via sub-ice channels, while a denser, warmermeltwater plume is forced towards the southern boundary, detaching from the ice shelf at approximately500m. A vertical cross section of zonal velocity at the ice shelf front (figure 31) shows meltwater-enrichedcurrents (both inflowing and outflowing, with outflow heavily influenced by channel location) at mid-depthand near the sea surface. Alternating bands of weak inflow and outflow characterize cross ice-front flow atdepth.Observations and other model simulations indicating that the majority of meltwater exits in a narrow bandnear the southern edge of PIIS are strongly supported by this simulation. Flow from underneath the ice shelfis sufficient to break the imposed stratification near the southern boundary, where CDW-derived meltwatermixtures upwell, warming the water column above the level of the ice shelf draft. Many other features ofthe model output also show promising agreement with oceanic and satellite-derived observations but requirefurther analysis. Autosub and CTD-derived ice shelf thickness, bathymetry, small-scale roughness, andhydrography measurements will allow for better model validation. The general nature of these results maybe applicable to other ice shelves in the Amundsen.The presence of a numerical model stimulated many conversations about sub-ice shelf circulation, as wellas the limits and opportunities for modeling ocean-ice interactions, particularly in light of newly collectedAutosub data. Background information about numerical models and highlights from onboard discussionswere summarized in an onboard ”science talk”.<strong>NBP09</strong>-<strong>01</strong> <strong>Cruise</strong> <strong>Report</strong> (p. 48 of 83) Revised February 27, 2009
Figure 31: A south-to-north cross section along the ice shelf front. Velocity (m s −1 , shading, blue indicatesflow out of the cavity) and meltwater concentration (per mille, contours) 1 km seaward of the model’s iceshelf front.8 DynaLiFe, Shedding a Dynamic Light on Iron Limitation in theSouthern OceanThe Southern Ocean plays an important role in the global carbon cycle, due to its large size and uniquephysiochemical characteristics. Approximately 25% of total anthropogenic CO 2 uptake by the oceans takesplace in the Southern Ocean, mainly via primary production by phytoplankton. However, changes in theAntarctic climate may impact phytoplankton primary productivity and hence, the carbon export by theSouthern Ocean. Primary production in the Southern Ocean is dominated by two phytoplankton groupsthat bloom in distinct locations and times: diatoms dominate blooms in shallow mixed layers, whereas thecolony forming Phaeocystis antarctica (Prymnesiophyceae) dominates blooms in the more deeply mixed, openregions. Understanding what controls the dynamics of these two phytoplankton taxa is essential becausethey dominate virtually all polar waters, they have vastly different nutrient utilization characteristics, andboth support very different marine food webs. In addition, this understanding is needed to recognize thepotential impact of climate change on the Antarctic phytoplankton community and predict their role in thecarbon export in the future. The Amundsen polynya and Pine Island Bay polynya are areas with the highestphytoplankton primary productivity in the Southern Ocean as estimated from satellite imagery (Arrigo andVan Dijken 2003) and are therefore vital areas to study phytoplankton primary productivity and carbonuptake in situ.Previous experiments in our laboratory suggest that taxon-specific differences in photoacclimation contributeto the observed distribution. However, photoacclimation does not seem to be the only factor that controlsthe phytoplankton distribution. Iron (Fe) limitation of the algal communities in the Southern Ocean is nowwell documented. Moreover, much of the Fe is bound to organic complexes, so-called ligands. Ligands canincrease solubility of Fe, but the effect on biological availability is unclear. In addition, phytoplankton Fedemand varies as a function of irradiance. Thus, the Fe needs of phytoplankton can change dependent ontheir light environment with great Fe requirements necessary to maintain growth in deeply mixed watercolumns and less Fe required by phytoplankton found in shallowly mixed water columns.<strong>NBP09</strong>-<strong>01</strong> <strong>Cruise</strong> <strong>Report</strong> (p. 49 of 83) Revised February 27, 2009
Figure 32: TMC stations sampled by the DynaLiFe project during the <strong>NBP09</strong><strong>01</strong> cruise. Red stationsrepresent the start of a Fe/ligand bioassay experiment, whereas green stations represent a profile of 6 surfacedepths (Thanks to F. Nitsche for the cruise track figure).The main hypothesis of the proposed research is: The interaction between Fe limitation and dynamic irradiancegoverns phytoplankton distributions in the Southern Ocean. For the <strong>NBP09</strong><strong>01</strong> cruise, five researchquestions were investigated in different natural phytoplankton assemblages at various stages of a phytoplanktonbloom:1. What is the carbon uptake physiology of the phytoplankton?2. What are the photosynthesis versus irradiance characteristics of the phytoplankton?3. What is the extent of damage caused by photoinhibition when phytoplankton reside near the surface?4. What are characteristics and quantities of dissolved Fe and Fe bound to natural ligands?5. Is Fe bound to artificial ligands accessible to phytoplankton?8.1 Sampling StrategyOn the <strong>NBP09</strong><strong>01</strong> cruise, stations were sampled to obtain a suite of different natural phytoplankton assemblagesat various stages of a phytoplankton bloom (Figure 32). Stations can be divided into sea-ice andopen water stations. Preliminary analysis showed that sea-ice stations were mainly dominated by diatoms,whereas open water stations were mainly dominated by Phaeocystis antarctica. Open water stations canbe divided into polynya stations and stations influenced by melt water driven upwelling in the vicinity ofglaciers. Polynya stations were visited in both Pine Island Bay and the Amundsen Polynya. Glacier stationswere mainly situated near the mouth of the Pine Island Glacier (PIG), and additionally, stations in front ofthe Getz, Dotson and Crosson glacier were sampled.Table 7 shows the TMC casts at different CTD stations, and subsequent experiments and analysis by theDynaLiFe team. Trace metal clean (TMC) sampling of a profile (P) of the upper 300m of the water columnwas done using clean GoFlo bottles provided by the Royal NIOZ on a kevlar wire, using messengers to closethe bottles. Sample depths were typically 10, 25, 50, 100, 200, and 300 m. To obtain large quantities ofTMC surface water to do biological experiments, a TMC frame (Royal NIOZ) was used holding the sixGoFlo bottles. The water depth for these casts using the frame (F) was typically 10 m. For all stations,<strong>NBP09</strong>-<strong>01</strong> <strong>Cruise</strong> <strong>Report</strong> (p. 50 of 83) Revised February 27, 2009
phytoplankton from the upper 200m water depths was collected on GF/F filters for analysis of Chl a (onboard), pigment composition by HPLC, elemental composition (CHN), and particulate organic phosphorus(POP). Filtered seawater was collected from all depths and stored at -20 o C for late analysis of nutrients(Silicate, Nitrate, Ammonium, Phosphate). In addition to the TMC sampling, water samples from the surface(10m) were obtained from the regular CTD, to study carbon uptake by natural phytoplankton assemblages(see section below).CTD TMC C uptake parameters Photoinhibition Fe analysis Ligand Fe/ligandStation cast eCA M M Iso PE-curve exp DFe TFe analysis exp2 none 10, 25 10, 253 P 10 10 10 10 P P P5 F 10 10 10 10 10 10 10 10 (U, 0.2um) Exp 17 P 10, 20 10, 20 P P10 F 10 10 10 10 10 10 10 10 (U, 0.2um) Exp 211 P 10, 40 10, 40 P12 none13 P 10 10 10 10, 20 10, 20 P P14 P 10, 50 10, 50 P16 P 10 10 10 P P P17 P 10 10, 25 P23 P P P 30036 P 10 10 10 10 10, 25 P37 F 10 10 10 10 10 10 10 10 (SF, U, 0.2um) Exp 346 P 10 10 10 10, 50 10, 50 P47 F 10 10 10 10 10 10 10 10 (U, 0.2um) Exp 455 P 10 P P P81 P 10 P P86 P 10 10 10 P88 P 10 P89 P 10 10, 50 P90 P 10 P91 P 10 10 10 10, 25 10, 25 P P92 P 10 P P (4)*93 P 10 P94 F 10 10 10 10 10 (SF, U, 0.2um) Exp 599 P 10 10 10 10, 25 10, 25 P102 P 10 10 10 10 10, 25 P P P103 P 10 P104 P 10, 20 10, 20 P P105 F, P 10 10 10 10 10 P P 10 (SF, U, 0.2um) Exp 6106 P 10 10 10, 25 P P P(4)107 P 8, 25 P P P(4)108 P 10 10 10 P P111 P 10 10 10 10 P113 P 10 P P(4)114 P 10 10 10 10 P P(4)118 F 10 10 10 10 10 (U, 0.2um) Exp 7119 P 10 10 10 10 10, 25 P P(4)continued on next page<strong>NBP09</strong>-<strong>01</strong> <strong>Cruise</strong> <strong>Report</strong> (p. 51 of 83) Revised February 27, 2009
continued from previous pageCTD TMC C uptake parameters Photoinhibition Fe analysis Ligand Fe/ligandStation cast eCA M M Iso PE-curve exp DFe TFe analysis exp126 P 10 10 10 P127 P 10 10 10 10, 25 10, 25 P129 F 10 10 10 10, 10+L 10 10 P 10 (SF, U, 0.2um) Exp 8131 P 10 10 10 10 10, 25 P P133 P 10 10 10 10 10, 50 P P135 F 10 10 10 10 10 (U, 0.2um) Exp 9138 P 10 10 10 10 P140 P 10 10 10 10, 10+L 10, 25 P142 P 10 10 10 10 P P148 F, P 10 10 10 10, 10+L 10 P P 10 (SF, U, 0.2um) Exp 1<strong>01</strong>53 P 10 10 10 10 10 P158 F, P 10 10 10 10, 10+L 10 P P 10 (U, 0.2um) Exp 11160 F, P 10 10 10 10 10 P P Exp 12Table 7: CTD stations and water depths of experiments and analyses by the DynaLiFe project during the<strong>NBP09</strong><strong>01</strong> cruise. See text for an explanation of the different analyses.P = TMC profile of 6 waterdepths , 10, 25, 50, 100, 200, 300mF = frame, 80L of TMC water at 10mP(4)* = 50, 100, 200, 300mP(4) = 25, 50, 100, 300mSF = size fractionationU = unfiltered water10+L = PE-curve with the addition of lincomycin8.2 Work at SeaCharacteristics of carbon uptake by natural phytoplankton assemblagesChristopher Payne and Philippe Tortell (not on board)While carbon (C) acquisition has been relatively well characterized in laboratory cultures of phytoplankton,little information is available on the C uptake physiology of natural phytoplankton assemblages. During thiscruise we measured several aspects of C uptake physiology using both membrane-inlet mass spectrometry(MIMS) and radioactive C ( 14 C) assimilation experiments. For all these experiments, phytoplankton collectedfrom the surface ocean waters were concentrated by gravity filtration and resuspended into seawaterbuffers.Extracellular carbonic anhydrase (eCA) activity Carbonic anhydrase is an enzyme which catalyzesthe inter-conversion between the dominant forms of C in seawater, HCO − 3 and CO 2. We measured the ratesof eCA in phytoplankton concentrates by adding 13 C 18 O 2 and monitoring the rates of change of masses45, 47 and 49 using the MIMS. eCA rates varied from background (physical exchange only, no biology) inupwelling areas near the PIG to 30 times background at diatom-dominated off-shelf stations (1 & 160). eCArates at ice stations and at the Phaeocystis-dominated polynya stations were highly variable.Michaelis-Menten Kinetics We assessed the C uptake affinity of these same natural phytoplanktonassemblages by measuring the rate of 14 C fixation in concentrated samples with increasing amounts of totalDIC (dissolved inorganic carbon) over a short time-course experiment (10 minutes). By fitting a Michaelis-Menten type hyperbola to the data (Fig. 33) we are able to determine the half-saturation constant for C<strong>NBP09</strong>-<strong>01</strong> <strong>Cruise</strong> <strong>Report</strong> (p. 52 of 83) Revised February 27, 2009
uptake (K m ) as well as the maximum C uptake rate (V max ). In ice and polynya stations, half-saturationconstants ranged from 234 mM to 1541 mM with lower values at high-productivity, low-pCO 2 stations.Upwelling stations near the Pine Island Glacier stood apart from all other stations, with very low V max andvery high K m (754 mM to 3656 mM).Figure 33: Phytoplankton carbon uptake rate as a function of total dissolved inorganic carbon for station102, a Phaeocystis-dominated station in the Pine Island Polynya.Isotope Disequilibrium We used the isotope disequilibrium technique to determine the relative fractionof HCO − 3 and CO 2 uptake in concentrated cell suspensions, and the relative activity of extracellular carbonicanhydrase (eCA). Essentially, short-term cellular 14 C fixation is monitored during a transient disequilibriumbetween 14 CO 2 and H 14 CO − 3 in solution. A pH 7.0 14 C spike is added to the concentrated cell suspensions(pH 8.5) to initiate 14 C uptake. Subsamples are withdrawn from the cuvette with a pipette and transferredat short intervals into scintillation vials containing 6 N HCl, thereby terminating C uptake. This procedureis then repeated with the addition of dextran-bound sulfanilamide (DBS), an eCA inhibitor. By quantifyingthe curvature of the uptake curves as the 14 C equilibrates to pH 8.5 we are able to determine the relativeamount of HCO − 3 uptake (f, fraction of total C uptake), as well as eCA activity (Fig 34). This measure ofeCA activity is indirect but completely independent from the eCA activity measured using the MIMS andcan therefore be used as confirmation of rates measured using the MIMS.These experiments revealed that HCO − 3 transport is the dominant mechanism of inorganic C uptake inall areas studied (f ranged from 0.83 to 0.95). The relative importance of HCO − 3 use was not related tophytoplankton biomass, productivity, or ambient CO 2 concentrations at individual sampling stations. eCArates measured ranged from 0.0061 (uncatalyzed rate constant, indicating no external CA activity) up to0.03. As for f, no pattern was observed with eCA activity and either phytoplankton biomass or ambient CO 2concentrations. eCA rates measured by isotope disequilibrium were correlated to those measured by MIMS.Diatoms and Phaeocystis Antarctica (the 2 main phytoplankton types found during this cruise) may have verydifferent C uptake affinities and mechanisms, thus further analyses back in the laboratory (phytoplanktoncell counts and HPLC pigment measurements) will be useful in teasing apart the variability measured duringthis cruise.<strong>NBP09</strong>-<strong>01</strong> <strong>Cruise</strong> <strong>Report</strong> (p. 53 of 83) Revised February 27, 2009
Figure 34: Isotope disequilibrium experiment from station 131, a diatom-dominated station in the ice. Filledcircles represent an un-amended cell suspension and open circles represent the same cell suspension amendedwith DBS, an extracellular carbonic anhydrase inhibitor.Photosynthesis vs. Irradiance characteristicsGert L. van DijkenDuring this cruise a total of 163 P-E curves (photosynthesis vs. irradiance) were made to study the characteristicsphotosynthesis by natural phytoplankton assemblages at different light levels. These are used todetermine maximum photosynthetic rates, the light intensity to which the phytoplankton is adapted, lightlimited rates of photosynthesis and photoinhibition parameters.For this 13-14 20 mL PET scintillation vials were filled with 10mL of seawater sampled with trace metalclean GoFlo bottles. Radiolabelled bicarbonate (H 14 CO 3 ) was added (1 µCi/mL of seawater) before thevials were transferred into a photosynthetron where they were incubated for 2 hours at 2 o C under differentlight conditions, ranging from 2 to >600 µEin m 2 s −1 . After incubation samples were filtered over WhatmanGFF filters under very low vacuum pressure (
Elmer UV/VIS Lambda 18 spectrophotometer with an integrating sphere (Labsphere RSA-PE-18). Thespectrum will be used to quantify the amount of light absorbed during the photosynthetron incubation andsubsequently calculate quantum yield of photosynthesis. Water samples were filtered over GFF filters. Thefilter was mounted in front of the integrating sphere and light absorption was measured from 300-800 nm.Detrital absorption was measured after extraction of sample in 80% methanol.Photoinhibition in Antarctic phytoplanktonAnne-Carlijn Alderkamp0.5in situlow light recoveryFv/Fm0.40.30.210m10m +50m50m +0.100 50 100 150time (mins)Figure 35: A typical example of photochemical efficiency of photosystem II (Fv:Fm) dynamics during adeck incubation followed by recovery under low light conditions. Means and standard deviations are shownfor triplicate incubations of water collected at 10m and 50m depth, without and with (+) the addition oflincomycin, an inhibitor of repair of photosystem II.Phytoplankton residing in the upper 100 meters of the water column receive a variable light climate dueto seasonal and dial light cycles, changes in ice and cloud cover, and wind driven vertical mixing of thewatercolumn. These alterations require acclimation of light harvesting and protective mechanisms to ensuremaximum photosynthetic efficiency at low light levels and protection from photoinhibition at high light andUV levels. The objective of the <strong>NBP09</strong><strong>01</strong> cruise is to determine 1) if Antarctic phytoplankton experiencephotoinhibition when residing near the surface, 2) if photoinhibition is related to the depth of the mixedlayer, and 3) the importance of repair of photodamage versus photoprotection.Short term deck incubations were caried out at 31 stations in the Amundsen Sea, representing differentnatural phytoplankton assemblages at various stages of a phytoplankton bloom. The depth of the mixedlayer was determined based on the CTD profile. Samples contaning in situ phytoplankton were collectedfrom surface water and the chlorophyll maximum. The maximum photosynthetic efficiency of photosystemII (Fv:Fm) was analyzed with a PAM fluorometer. Samples were incubated for 20 mins at incident lightlevels in deck incubators. The decrease in photosynthetic efficiency of photosystem II (Fv:Fm) of the phytoplanktonwas determined by PAM fluorometer. Subsequently, recovery of photosynthetic efficiency wasmeasured during incubation at in situ temperatures and low light levels. In parallel experiments, the repair<strong>NBP09</strong>-<strong>01</strong> <strong>Cruise</strong> <strong>Report</strong> (p. 55 of 83) Revised February 27, 2009
of photodamage was prevented by addition of 0.6 * 10−3 mol L −1 (final concentration) of the inhibitorlincomycin. Lincomycin inhibits transcription of chloroplast encoded proteins, such as the D1 protein, whichis a crucial component of photosystem II and one of the first proteins to become damaged by high light.Preliminary data A significant decrease in photosynthetic efficiency of photosystem II was observedafter incubating in situ phytoplankton samples in deck incubators at incident light levels (Fig. 35), bothfor samples from the surface as well as the chlorophyll maximum. Part of the decrease in photosyntheticefficiency was reversible during 120 mins of recovery under low light conditions. The inhibition of repair bythe addition of lincomycin did not affect the decrease in photosynthetic efficiency directly after exposure tosurface irradiance, but reduced the recovery in almost all experiments. The addition of lincomycin in PEcurves (G. van Dijken, see PE-curve section) confirmed significant photoinhibition at high light levels (> 300µE m −2 s −1 ) when repair was inhibited. Experiments conducted early in the morning, or at low incidentlight levels showed the least photoinhibition, which was rapidly reversed. Experiments conducted at higherlight levels showed strong photoinhibition, that was not (completely) reversed during 120 mins of recovery.In these cases, lincomycin prevented recovery completely, as shown in Fig. 35.Future work The microscopic analysis of phytoplankton slides, as well as the analysis of photo-syntheticand -protective pigments will be related to the characteristics of the mixed layer to help explain differencesobserved in the dynamics of photosynthetic efficiency in the experimentsConcentrations of dissolved iron in the Amundsen SeaPatrick LaanFigure 36: Depth profile of dissolved Fe concentrations from stations 16 (upwelling at the southern end ofthe PIG) and 107 (central Pine Island Polynya).Dissolved iron (DFe) concentrations of 40 profile stations and 7 surface stations were measured directly onboard by an automated Flow Injection Analysis (FIA) after a modified method of De Jong et al. 1998. In<strong>NBP09</strong>-<strong>01</strong> <strong>Cruise</strong> <strong>Report</strong> (p. 56 of 83) Revised February 27, 2009
Figure 37: Section plot of dissolved Fe concentrations from the PIG area through the central Pine IslandPolynya.addition, unfiltered samples from 17 profiles and 7 surface stations were acidified and stored to determinethe total Fe concentrations in the NIOZ laboratory after 6-12 months of dissolution (see table 7). Filtered(0.2µm) and acidified (pH 1.8) seawater was concentrated on a column containing aminodiacetid acid (IDA).This material binds only transition metals and not the interfering salts. After washing the column with ultrapure water, the column is eluted with diluted acid. After mixing with luminol, peroxide and ammonium,the oxidation of luminol with peroxide is catalyzed by iron and a blue light is produced and detected with aphoton counter. The amount of iron is calculated using a standard calibration line, where a known amountof iron is added to low iron containing seawater. Using this calibration line a number of counts per nM ironis obtained. Samples were analyzed in duplicate sample bottles, each of which was measured in triplicate,and average DFe concentrations and standard deviation are given. Concentrations of DFe measured on the<strong>NBP09</strong><strong>01</strong> cruise ranged from 30 pM up to 0.7 nM. The standard deviation varied between 0% and 10% (thelatter being exceptional), but was generally < 5% in samples with DFe concentrations higher than 0.1nM.Since samples containing less than 0.1nM DFe are near the detection limit of the system; the standarddeviation of these measurements was sometimes high (
Preliminary results The profile from station 16 clearly shows high iron input near the PIG (Fig. 36).DFe concentrations are high throughout the entire water column and indicate a constant input of DFe intothe polynya. Profile 107, which is in the central Pine Island Polynya, shows much lower values throughoutthe first 300 meter which can be explained by the high phytoplankton abundance in the surface water. DFeconcentrations during a transect from Pine Island Glacier (PIG) (1<strong>01</strong> S,30W) through the central Pine IslandPolynya in north westwards direction clearly show the high DFe concentrations near the PIG and the rapiddecrease of the DFe in the polynya, especially in waters shallower than 50m (Fig. 37). Extreme low DFevalues in the central polynya correlate with the biological productive area as observed from the fluorometerdata and Chl a measurements.Physical and chemical speciation of iron in seawaterCharles-Edouard ThuroczyFigure 38: Section plot of the ratio of ligand/dFe concentrations from the PIG area through the central PineIsland Polynya. CTD station numbers are indicated above the graph.The distribution and biological availability of Fe is strongly controlled by its physical-chemical speciationwithin seawater, where colloids and Fe-organic complexes are dominant factors. In order to study thedistribution and the biological availability of Fe the natural Fe organic complexes were determined in thesurface waters of the Amundsen Sea (300 m).Methods Samples were collected using Go Flo bottles and filtered under ultra-clean conditions in flowbenches (class 0). The concentration of iron binding ligands (organic compounds which strongly bind Fe) andtheir binding strength (conditional stability constant) were studied in 5 size classes here: unfiltered water,0.2 µm filtered water, < 1000 kDa (Stereapore, Mitsubishi-rayon Co. Ltd, Nishioka and al., 2000, 2005),< 100 kDa and < 10 kDa ultra-filtrated water (Sartorius, Vivaflow 50, Schlosser and Croot, 2008). Theleft-over fraction from the ultra filtrations (retentates) were also analyzed for dFe and ligand characteristicsto ensure a mass balance calculation and validate the ultrafiltration method.The dissolved iron concentrations in all the size fractions (and retentates) were measured (see dFe measurementsection) using a chemo luminescence method (FIA) with acidified samples (pH 1.8). Total ironconcentrations will be measured 6-12 months after the acidification of the unfiltered sample.Ligand characteristics were determined by using a complexing ligand titration with addition of iron (between0 and 10 nM of Fe added) in buffered seawater (mixed NH 3 /NH 4 OH borate buffer, 5 mM). The competing<strong>NBP09</strong>-<strong>01</strong> <strong>Cruise</strong> <strong>Report</strong> (p. 58 of 83) Revised February 27, 2009
ligand ’TAC’ (2-(2-Thiazolylazo)-p-cresol) with a final concentration of 10 µM was used and the complex(TAC) 2 -Fe was measured after equilibration (> 15 h) by cathodic stripping voltammetry (CSV) (Croot andJohansson, 2000). The electrical signal recorded with this method (nA) was converted to a concentration of(TAC) 2 -Fe (nM). Subsequently, the ligand concentration and the binding strength were estimated using thenon-linear regression of the Langmuir isotherm (Gerringa and al., 1995) and a newer “Leo” model currentlybuilt up (Gerringa et al , in prep). The voltammetric equipment consisted of a µAutolab potentiostat (TypeII and III, Ecochemie, The Netherlands), a mercury drop electrode (model VA 663 from Metrohm). Allequipment was protected against electrical noise by a current filter (Fortress 750, Best Power).Sampling statistics 26 stations were sampled on this cruise (see table 7). These included 14 profilesand 5 stations where different size fractions were analyzed after 4 filtrations with different filter sizes (0.2µm cut-off, 1000 kDa, 100 kDa and 10 kDa). In addition, 11 Fe/Ligand experiments were analyzed (seeFe/ligand experiment section). Special attention was given to determine the iron binding ligands before andafter incubation with and without artificial ligands in these experiments, to look at the response of algaeand the change of the ligand characteristics during the incubations.Preliminary results An average ligand concentration of 0.789 nEq was found on the <strong>NBP09</strong><strong>01</strong> cruise,varying from 0.2 and 1.6 nEq of Fe. Highest ligand concentrations were found at 10 m depth followed by aminimum at 25 m. Concentrations increased with depth to become rather constant at 200 and 300 m. LowFe binding strength of the ligands was found at 10 and 25 m in the polynya suggesting freshly producedligands by organisms (phytoplankton or bacteria) or by a change in the ligand content and characteristicsdue to the biologic activity (the pool of strong binding ligands may be removed or used).The ratio ligand/dissolved iron (Fig. 38) clearly shows differences between the surface water and deepersamples. Very high ratios (∼10) were found in the surface waters of the Pine Island polynya due to thelow dissolved iron concentration and high ligand concentrations. In the deep water (200 and 300 m) of thepolynya and the circumpolar deep water upwelling in front of the PIG the ligand/dissolved iron ratio wasclose to 1 indicating a saturation of the ligands by iron and the possibility for iron to be removed from thewater column by precipitation.Fe/Ligand Bioassay ExperimentsMatthew M. MillsMethods We conducted a total of 12 bioassay experiments investigating phytoplankton utilization of iron(Fe) and ligand bound Fe (Table 1). Trace metal clean techniques were used throughout the preparationand execution of the bioassay experiments. Surface seawater (60 L) was collected from ∼10 m using GoFlo bottles and used to randomly fill 2.0 L acid-washed polycarbonate bottles. Under a laminar flow hoodlocated in a clean room, the bottles were amended with iron (Fe) and ligands, alone and in combination, tofinal concentrations of 4.0 nmole L −1 . Three different ligands were used; desferroxamine mysalate (DFB),phytic acid (PA), and -(-)gallocatechin (GA). In experiment 8 and 10, two additional treatments containingnitrogen were conducted. Treatments were thus; control (C), +Fe, +DFe, +PA, +GA, and +PA+Fe,+Ga+Fe, +NH 4 NO 3 , +NH 4 NO 3 +Fe. All treatments were conducted in triplicate. The bottles were thensealed with parafilm, placed in Ziplok bags, and set in on-deck incubators with circulating surface seawaterfor 4-5 days. The light level in the incubator was adjusted to 25% of incident irradiance. At termination ofthe experiments the control and +Fe treatments were sampled for dissolved Fe (dFe) concentrations (see dFemeasurements section) and ligand measurements (binding strength and concentration, see speciation of ironin seawater section), while all treatments were sampled for the macronutrients NO − 3 and PO3− 4 , chlorophylla (chl a) concentration, maximum photochemical efficiency of photosystem II (Fv:Fm), particulate organiccarbon, nitrogen, and phosphorus, pigment analysis, and cell abundance. Subsamples from each treatmentwere pooled and 14 CO 2 fixation was measured at increasing irradiance (photosynthesis vs. irradiance; see<strong>NBP09</strong>-<strong>01</strong> <strong>Cruise</strong> <strong>Report</strong> (p. 59 of 83) Revised February 27, 2009
Figure 39: Mean (±sd) chlorophyll a (a-d) and photochemical efficiency of photosystem II (Fv:Fm, e-h)responses in four of the Fe/ligand bioassay experiments.P vs. E section). Additionally, the effect of Fe limitation on photoinhibition and recovery characteristics ofthe phytoplankton was determined in short-term deck incubations described in the photoinhibition sectionabove.Preliminary results The responses to the Fe and ligand amendments were variable between experiments.For experiment 1, started in the ice just north of the Pine Island Polynya (Fig. 39a), Chl a concentrationsin the +Fe treatments were approximately 30% higher than in the control treatment. Fv:Fm respondedsimilarly in the +Fe and +PA+FE treatments, while the +DFB+Fe showed no Fv:Fm change relative tothe control (Fig. 39e). In the ligand alone treatments both chl a and Fv:Fm decreased relative to the controlswhile no change was observed in the +PA amended bottles. Within Pine Island Bay the response to the+DFB amendment was similar as in Exp. 1, but the +PA addition resulted in both lower chl a concentrationsand Fv:Fm (Fig 39b,f). However, when either ligand was added with Fe the chl a concentrations were higherin comparison to the control. In the center of the Pine Island Polynya (Fig. 39c,g) there was little chla response to added Fe alone or when added with ligands, however Fv:Fm was higher in the Fe amendedtreatments. Surprisingly, chl a increased approximately 50% in those treatments amended with N. While noincrease in Fv:Fm was observed in the +N treatments, higher values were recorded, relative to the control,when N and Fe were added together. These are the first data that we know of suggesting N can play a role inbloom termination in the algal blooms of the Amundsen Sea. Samples for macro-nutrient (NO − 3 and PO3− 4 )analysis were also collected and will help to confirm that NO − 3 was at limiting concentrations. Finally, in thesea-ice northwest of the Amundsen Polynya the phytoplankton were clearly Fe limited with strong responses(increases) in both chl a and Fv:Fm in those bottles amended with Fe (Fig. 39d,h). Both DFB and GA hadsimilar, if not slightly higher chl a concentrations, in comparison to the control when added alone, thoughlittle change in Fv:Fm was observed in these treatments. Additions of either ligand with Fe resulted insimilar responses to the Fe alone addition.Overall, the data from Fe/ligand bioassay experiments suggest that the phytolankton communitites in andaround the Amundsen Sea are able to access ligand bound Fe, though the between experiment variabilitysuggests a differential ability to utilize this Fe source which may be specific to different algal communities.<strong>NBP09</strong>-<strong>01</strong> <strong>Cruise</strong> <strong>Report</strong> (p. 60 of 83) Revised February 27, 2009
Both GA and PA, at times, resulted in equal or slightly higher chl a concentrations relative to controls whenadded alone, and enhanced chl a when added with Fe. In contrast, DFB often resulted in lower chl a andFv:Fm when added alone and did not always stimulate chl a equal to the Fe addition alone. The resultssuggest Fe bound to DFB is less available to phytoplankton than Fe bound to either PA or GA. Furtheranalyses characterizing the phytoplankton communities within the experiments will help to understand theconnection between different phytoplankton and their ability to use ligand bound Fe.8.3 Underway <strong>Data</strong> AcquisitionRemote SensingGert L. van DijkenFigure 40: Oceancolor image showing the 2 intense phytoplankton blooms in the Amundsen Sea. This dailycomposite is based on 5 individual MODIS/Aqua satellite scenes from January 20, 2009. Color legend showschl a concentration (mg chl a m −3 ). PSSM ice cover of the same day derived from SSM/I satellite data isshown as grey. White is continent/ice shelves and red is the coastline.Ocean color satellite imagery was used to follow the spatial extent and temporal development of the intensephytoplankton blooms in the Pine Island and Amundsen polynyas. An automated system was set up atStanford University where near real-time satellite imagery acquired by the MODIS/Aqua sensor was downloadedevery 3 hours from NASA ftp-servers. The chlorophyll product was extracted, somewhat manipulatedand mapped to a common polar stereographic projection. In addition daily composites were generated fromthe individual scenes (4-6 per day). On these daily chlorophyll composite images ice cover was superimposed(see figure 40). The ice data was generated from SSM/I brightness temperatures, retrieved twice daily fromthe NSIDC ftp-site and processed to sub-pixel resolution (6.25 km) using the PSSM algorithm. Finally, allprocessed MODIS scenes and daily composites were automatically e-mailed to the R/V N.B Palmer in PNG<strong>NBP09</strong>-<strong>01</strong> <strong>Cruise</strong> <strong>Report</strong> (p. 61 of 83) Revised February 27, 2009
format.Underway gases/MIMSChristopher Payne, Philippe Tortell (not on board)The fine-scale (
9 Other Sampling and Profiling9.1 O-18Chris Little, Stan JacobsOn selected CTD stations, water samples were drawn for later oxygen isotope analysis. Sampling was focusedon waters near and above the pycnocline, likely to contain evidence of glacial meltwater, and in the surfaceand Tmin layers, more influenced by sea ice melting and freezing. Occasional deep samples were also takenfor reference values. The work was done by C Little, K Leonard, R Robertson, and K Mankoff according tothe procedures provided (dump, triple rinse and fill, leaving a little head space). In all, 455 d18O sampleswere taken from 92 CTD/rosette casts; one surface sample was taken from the seawater line. The sampleswill be analyzed at a laboratory in the US that can achieve an accuracy of better than 0.03 per mil.9.2 TCO 2Stan Jacobs, Sharon Stammerjohn, and Robin RobertsonIn support of the underway pCO 2 monitoring project (Takahashi & Sweeney, PIs), samples were drawntwice daily for total CO 2 (TCO 2 ) from the ships uncontaminated seawater line. CTD/rosette casts alongtwo roughly N-S transects across the Amundsen continental shelf were also sampled for TCO 2 . The lattersampling was light by Wocean standards, but should be sufficient to define the upper water column abovethe temperature maximum, i.e., waters that have had recent contact with the sea surface, or have likelymixed with same. It should also complement TCO 2 work done aboard ship in the Amundsen Sea duringNBP94-02. Some deeper samples were taken for reference, along with duplicates on two stations, and areoccupation of site 727 from the 1992 SO4 line. The TCO 2 samples will be returned to US laboratories forprocessing.9.3 DriftersStan Jacobs and the RPS MTsEleven APEX floats were deployed by the RPS MTs in the northern Amundsen Sea for S Riser and R Rupan ofthe Univ of Washington. Rupan set up the drifters in Punta Arenas prior to the cruise and specified that theybe deployed in the Amundsen, but in water deeper than 3000 m and 100 km apart. This relegated them to theregion north of the continental rise. All but one drifter, which was launched shortly after leaving the ChileanEEZ (200 nm from the coastline), were ice capable, although icebergs and seamounts in the deploymentareas could present operational challenges. The floats reside for most of the time near 1000 m, making aprofile once every 10 days first to 2000 m, rising to the surface to transmit data, then returning to 1000 m.Notifications were sent to R&R @ Udub after each 1-2 deployments indicating float number, ship positionand other parameters. Drifter data may be logged at http://www.runt.ocean.washington.edu/ice9.4 ADCPPierre DutrieuxUpper ocean currents are routinely measured aboard the NB Palmer by Ship-mounted Acoustic DopplerCurrent Profilers (SADCP). Two instruments are currently mounted: a 150 kHz Work Horse and a 38kHz Ocean Surveyor from RD Instruments. The higher-frequency unit measures currents from 36 to 416m depth with a 10 m bin vertical resolution, although most measurements rarely reach below 300m. The<strong>NBP09</strong>-<strong>01</strong> <strong>Cruise</strong> <strong>Report</strong> (p. 63 of 83) Revised February 27, 2009
Figure 41: Currents measured from the 150 kHz Work Horse SADCP during <strong>NBP09</strong>-<strong>01</strong> in front of the PineIsland Glacier, averaged as vectors showing speed and direction from 50 to 75 m depth. The background isa MODIS satellite image from December 28, 2008.lower-frequency device could have been an invaluable instrument to the campaign scientific objectives, withits ability to measure currents down to 1200 m. However, it was nonfunctional again during <strong>NBP09</strong>-<strong>01</strong>, ason the last Amundsen Sea cruise.Preliminary data processing and recording is automatically and routinely done on board using a setupcreated and maintained by E Firing and J Hummon from the University of Hawaii. The preprocessed datais available in 15 minute bin-averaged Matlab format binary files. Further processing and editing will benecessary at the end of the cruise, and the data will be made available at 2 or 5 minute bin average formats.Environmental conditions were excellent for SADCP observations in the ice-free Pine Island Bay in early2009, and the extensive work in front of the Pine Island Glacier resulted in a comprehensive survey of thenear surface ocean currents there. Figure 41 shows the measured currents, accurate to ∼2 cm/s in mostcases, averaged from 50 to 75 m at the time of the cruise. In general, currents were slightly surface intensified,but consistent in direction over the top 300 m, and were dominated by a cyclonic gyre in front of the glacier.This feature is represented by a doming of the thermocline at the centre of the gyre in CTD observations.9.5 PIG Frontal TransectKen Mankoff, Katherine Leonard, Kathleen GavahanOn January 28, 2009 between 1400 and 1830 GMT The Nathaniel B. Palmer (NBP) sailed at 5 knots(kts) along a track 0.2 nautical miles (nm) from the Pine Island Glacier (PIG) ice front, from the northernto southern end. Expendable Bathy-Thermographs (XBTs) were deployed at 15 minute intervals to measuretemperature. Synchronous with XBTs the following data were obtained: Distance from the ice shelf(obtained from the NBP bridge radar), height of the ice shelf (via sextant), draft of ice shelf (via NBPmultibeam), visual description and photography of the ice shelf and local conditions, underway ship data<strong>NBP09</strong>-<strong>01</strong> <strong>Cruise</strong> <strong>Report</strong> (p. 64 of 83) Revised February 27, 2009
Figure 42: XBTs gridded as if they were evenly spaced along-track. The left side of the image is in thenorthern notch and the right side in the southern notch. Both contours and colors show temperature.Latitude Longitude Radar (nm) Obs. (m) Angle Height XBT-74 45.52 -1<strong>01</strong> 15.39 0.187 336.55 06 40.6 39.4 48-74 46.50 -1<strong>01</strong> 19.46 0.271 492.22 05 26.4 46.9 49-74 47.56 -1<strong>01</strong> 21.79 0.265 477.80 06 07.0 51.2 50-74 48.79 -1<strong>01</strong> 23.61 0.158 279.51 11 17.8 55.8 51-74 50.03 -1<strong>01</strong> 24.25 0.215 385.14 08 40.6 58.8 52-74 51.63 -1<strong>01</strong> 24.79 0.195 348.07 09 08.6 56.0 53-74 52.60 -1<strong>01</strong> 26.<strong>01</strong> 0.183 325.84 08 24.2 48.1 54-74 53.96 -1<strong>01</strong> 26.83 0.165 292.48 08 52.0 45.6 55-74 55.30 -1<strong>01</strong> 28.59 0.165 292.48 09 13.8 47.5 56-74 56.57 -1<strong>01</strong> 30.37 0.180 320.28 08 08.6 45.8 57-74 57.87 -1<strong>01</strong> 31.76 0.182 323.98 08 21.8 47.6 58-74 59.19 -1<strong>01</strong> 32.95 0.162 286.92 10 39.6 54.0 59-75 00.44 -1<strong>01</strong> 34.81 0.163 288.77 09 57.0 50.7 61-75 <strong>01</strong>.63 -1<strong>01</strong> 37.30 0.200 357.34 08 14.4 51.7 62-75 02.48 -1<strong>01</strong> 41.49 0.200 357.34 09 11.2 57.8 63-75 03.46 -1<strong>01</strong> 45.36 0.200 357.34 09 29.6 59.8 64-75 04.47 -1<strong>01</strong> 46.41 0.150 264.68 07 33.4 35.1 65-75 06.02 -1<strong>01</strong> 42.98 0.335 607.52 02 41.8 28.6 66Table 8: Sextant angle and associated metadata for Pine Island Glacier freeboard measurements.(from NBP Thermosalinograph (TSG)), ocean currents (NBP Acoustic Current Doppler Profiler (ADCP)),and bathymetry (NBP multibeam). In addition to this XBT transect, seen in Figure 42, Conductivity TemperatureDepth (CTD) profilers were used to profile the water column in close geospatial (within 3 km)and temporal (within 11 days) proximity to the XBT stations. The metadata associated with each sextantreading is shown in Table 8. Additional analysis of data collected is included in a seperate PIG Transectreport compiled by K Mankoff.<strong>NBP09</strong>-<strong>01</strong> <strong>Cruise</strong> <strong>Report</strong> (p. 65 of 83) Revised February 27, 2009
The PIG transect was performed to add to the limited knowledge base of West Antarctic floating glacialtermini and specifically the interactions of PIG with the surrounding bay. Figure 42 shows a steep temperaturegradient occurs at approximately 350 m, near the mean draft of the ice shelf. There is a warm verticalintrusion near the center of the image surrounded by two colder regions on either side near 300 m, and ananomalous vertical intrusion in the south notch (right side of figure).9.6 SnowfallKatherine Leonard20<strong>01</strong>8<strong>01</strong>60snowflakes per 10s14<strong>01</strong>2<strong>01</strong>0080604020<strong>01</strong>/07 1/12 1/17 1/22 1/27 2/<strong>01</strong> 2/06 2/11 2/16 2/21 2/26Figure 43: Snowfall measured by the particle counters on top of the ice tower. The red lines representsnowflakes blowing across the ship, the blue lines are snowflakes blowing parallel to the boat’s long axis.<strong>Data</strong> are reported in flakes counted per ten second interval. The vertical scale has been abbreviated at 200,but counts exceeding that number were common at the end of the cruise.The timing and relative intensity of snowfall events experienced during <strong>NBP09</strong><strong>01</strong> were measured usingphotoelectric particle counters mounted on the ship’s ice tower, continuing measurements conducted onthe ship during cruises NBP07-02 and NBP07-09. These earlier records show shipboard measurements arewell correlated with the timing and relative intensity of precipitation forecast by the ECMWF and someother weather models. During the current cruise, two particle counters (Wenglor model YH03NCT08) weremounted on the forward edge of the top of the ice tower with one counter’s beam aligned with the ship, andthe other oriented across the ship’s long axis.To correlate the absolute magnitude of precipitation events documented on the ship with forecasts andreanalyses, knowledge of the size distribution and water equivalent mass contained in the falling crystalsis necessary, so macrophotographs of snowflakes were taken by K. Leonard and M. Stenzel during the raresnowfall events during the Antarctic portion of the cruise. As shown in figure 43, snowfall was more frequentand more intense following our departure from the southern Amundsen Sea. Most snow observed consistedof rimed dendrites, with occasional events close to the continent consisting mostly of plates, sector plates,rare hollow columns, and one snowfall event composed entirely of ice needles up to 3.5mm in length. Snowcaptured adjacent to the Dotson Ice Shelf in figure 44 consists mostly of sector plates with significant rime<strong>NBP09</strong>-<strong>01</strong> <strong>Cruise</strong> <strong>Report</strong> (p. 66 of 83) Revised February 27, 2009
on them. A single hollow column is visible in this photograph, along with a few needles, and a number ofcrystals so heavily rimed that their identification is questionable. The heavy precipitation experienced northof 67 o S typically consisted of rimed dendritic flakes mixed with raindrops.The most successful photographs (such as that in figure 44) were taken using an auto-focusing Canon 100mm macro lens and extension tube during heavy snowfall in low-wind conditions or sheltered locations onthe ship’s deck. More detail for individual snowflakes was acquired using a manually-focused Nikon bellowssystem with a 55 mm macro, however the paucity of snow during the cruise and the ship’s vibration madeexperimentation with different camera settings and configurations challenging. Several snowfall events werenot documented due both to delays in equipment collection and deployment and hesitance by others to wakethe snow photographers. Capturing snow also proved difficult in windy conditions.All snow photographs were illuminated with an LED panel beneath the Petri dish and hemacytometer onwhich the snow was collected. Most included a blue and a diffusing filter between the light and the Petridish. The blue light is transmitted through most of a flat-lying snow crystal, while internal structure andcrystal edges diffract that light, appearing white in photographs. The Canon system also included a flashwith a soft box diffuser covered in a piece of blue filter paper on an extension cable from the camera, whichhelped illuminate the snow. Two hemacytometers were used, an “improved neubauer” and a “Nageottebright-line”. These slides are typically used for counting blood cells, and have very precise fine-scaled grids.The bright-line hemacytometer has a larger gridded area, with coarser (200 µm) markings than the neubauer,which has a smaller field, with both 250 and 50 µm grids marked on it. These slides were stored in a portablecooler kept at -40 o C, along with a “SEAR” snow grain size card and three “Johnny Plastic-Ice XC-24 BRX-Cold Brick” chemical coolant packs. To collect snow, the hemacytometers were placed in Petri dishes seton top of the cold packs on the ship’s deck, and wiped clean between photographs. In future, a snowflakecollection method that can be deployed more rapidly and under more variable conditions (particularly wind)is recommended. For example, if a freezer for flammable liquids were available, iso-octane in small jars couldbe used to capture a few flakes per snowstorm and stored at -30 or -40 for later photography in a freezervan with a microscope or other vibration-isolated system.Figure 44: Snow captured during the February 4-5 event while the NBP was conducting a ctd transect alongthe Dotson Ice Shelf. The white lines are 200 µm (0.0002 m) apart.<strong>NBP09</strong>-<strong>01</strong> <strong>Cruise</strong> <strong>Report</strong> (p. 67 of 83) Revised February 27, 2009
The fine weather experienced during <strong>NBP09</strong>-<strong>01</strong> may or may not be representative of typical summer conditionsin the Amundsen Sea. December and January are often considered separately from the rest of theyear in discussions of Antarctic climatology, due to the high solar angle and incident radiation. Sublimationof falling snow could over-saturate the air with water, while reducing the mean size and total number offalling snowflakes, leading both to the low counts measured with the particle counters and the rime buildupon the unexpectedly large photographed snow crystals. However, the Amundsen experiences high annualsnowfall, as evidenced by the thick snow found on sea ice floes during the cruise. Our cruise track couldhave inadvertently dodged precipitation, the conditions might have been anomalous, or it may not snowvery much in January. Post-cruise data analysis and comparison with precipitation forecasts will determinewhether the previously observed correlation between snowflake count and modeled precipitation.10 Education and Public OutreachNBP-09<strong>01</strong> from the Photo-journalists’ perspectiveMaria Stenzel, Sarah ParkFigure 45: Journalists interview an Emperor Penguin about Circumpolar Deep Water.Stenzel, 2009.Photo c○MariaMore than a year ago we became interested in the West Antarctic Ice Sheet and its interactions with theSouthern Ocean. Our curiosity was increased by attending a ’WAIS’ meeting and communicating withscientists organizing an expedition to study the topic in more detail near and under the rapidly melting PineIsland Glacier. We believe this research has substantial societal relevance and needs to be fully documented<strong>NBP09</strong>-<strong>01</strong> <strong>Cruise</strong> <strong>Report</strong> (p. 68 of 83) Revised February 27, 2009
in ways that are accessible to a wider public audience. We thus inquired about participation in NB Palmercruise 09-<strong>01</strong>, and permission was eventually granted, leading to this report.We have tried to faithfully and accurately cover the science during 09<strong>01</strong>, from CTD casts, moorings andthe Autosub to sea ice studies and phytoplankton experiments. We have also covered many aspects of thephysical landscape, which have proven to be useful visual documents for the scientists, in addition to theirinherent value in conveying to others the wonders of the regional atmosphere and cryosphere. For example,the configuration and characteristics of ice shelves, the diverse melting and depositional patterns of icebergs,wave action during storms, the nature of sea smoke, wildlife congregations, the top and bottom stages of seaice formation and melting, the variety of snowflakes, patterns of snowfall and how the wind distributes it.These images have been shared with others and with the scientists working on related studies.About 24,000 still images and 300 hours of HD video were recorded, including a dozen interviews. The stilland video equipment we have used includes Canon digital cameras, various lenses from macro to telephoto,an underwater camera housing unit, Sony XD-CAM EX HD, tripods, various microphones, external harddrives, and laptops. The raw material will require hundreds of hours of editing to be formed into coherentstories, which the scientists will edit for factual content. Our goal is to publish at least one article in a majorgeneral audience magazine or newspaper, in tandem with a multimedia piece on that news outlet’s website.The twenty-four hour sunlit days meant that we ran ragged between good light and important events. Ofcourse that could not be avoided, or as one wag noted, “It’s been one long day since January 5.” As visualjournalists, perhaps it would have been helpful to have a cabin with a clear view of the outside rather thanbeing tucked in behind a lifeboat. But that was ameliorated by calls from the bridge crew at any time of dayor night to alert us to noteworthy happenings and scenery. Indeed, one of the successful aspects of the cruisewas the cooperation we received from everyone aboard. Most scientists were tirelessly willing to explain theirwork and their hypotheses in ways that the average person can understand. Raytheon staff cheerfully andcleverly modified the underwater camera housing so that it could be fired remotely from a five-meter-longcable, and built an expandable pole extension to lower it through the ice. They willingly drilled extra holesfor the camera in the sea ice and skillfully maneuvered the zodiac into position for still and video shots of theAutosub retrieval and other outings. They built a temporary studio for interviews, and escorted us up thescience mast numerous times in the cold. Andy Webb volunteered as a grip and technician after completingthe successful Autosub missions. Thank you, all, for being of the utmost help.BlogsRobin Robertson, Chris Little, Ken MankoffSeveral participants in <strong>NBP09</strong><strong>01</strong> utilized the limited bandwidth on board to communicate with friends,family, and the broader community. Some efforts were more formalized. A few of these efforts are highlightedbelow.Chris Little posted frequent updates to a blog (http://nbp-09<strong>01</strong>.blogspot.com) devoted to explainingsome of the onboard science goals and activities to a broader audience, primarily middle and early highschool teachers and students. Before setting forth, Chris worked with his former high school teacher andAPECS (Association for Polar Early Career Scientists) to spread the word and develop a format that fosteredinteraction. The site was set up so that comments were relayed to his NBP email account. One middleschool teacher was particularly active, and used temperature and salinity profiles from two Amundsen SeaCTD casts as a teaching tool. He intends to continue to use APECS as a tool for outreach, and theblog website will exist indefinitely. Chris also maintained a blog detailing his experiences on NBP0702(http://nbp0702.blogspot.com) that is easily found via the <strong>NBP09</strong><strong>01</strong> website.Ken Mankoff also posted frequent updates and photos to a blog (http://spacebit.org/category/projects/nbp09-<strong>01</strong>). Photos were of all aspects of the cruise including scenery, life on the boat, and the science instruments.Text was targeted more toward general public outreach and interest than education. The website<strong>NBP09</strong>-<strong>01</strong> <strong>Cruise</strong> <strong>Report</strong> (p. 69 of 83) Revised February 27, 2009
was also announced on the APECS mailing list prior to the cruise.Robin Robertson sent daily emails and weekly reportsto 3 school classes and a unit of Girl GuidesAustralia. A couple weeks after the cruise started,it was decided to further distribute the emails toall of Girl Guides Australia. The daily emails gavebrief accounts of the daily activities and life on theship, along with location, and air and surface watertemperatures. The weekly reports presented the scientificgoals and basic knowledge about the topics toexplain what we were doing and why. Additionally,one or two photos were sent out with the weeklyreports, when possible. The information in thesereports was used in various ways. One geographyclass followed the ship position, science classes usedthe air and water temperature for temperature dependenceon latitude, etc. However, the photos werethe biggest hit with the students, according to returnemails. Also question occasionally came fromthe students and were answered.Figure 46: Screenshot of Google Earth showing bathymetricmap, ship track, and location of XBTs andCTDs.The schools involved were Kaleen Primary inKaleen, Australia (Mrs. Felicity McNeice), GeorgeGrant Mason Elementary School in Tuxedo, NY, USA (Mrs. Barbara Voss), and Webatuck Middle Schoolin Millerton, NY, USA (Mrs. Christine Gillette).Google EarthKen Mankoff, Frank NitscheGoogle Earth KML layers were populated with local data to circumvent the lack of internet connectivity.<strong>Cruise</strong> participants were able to track the ship location, XBTs, and CTD casts in real-time, and see recentdata from MODIS and ship bathymetric mapping. A subset of this Google Earth layer will be released onthe SpaceBit (http://spacebit.org) website so that the general public can see the cruise track and worklocations in a global context.<strong>NBP09</strong>-<strong>01</strong> <strong>Cruise</strong> <strong>Report</strong> (p. 70 of 83) Revised February 27, 2009
AppendicesA<strong>Cruise</strong> ParticipantsPersonBen AaronAnne AlderkampSteve AndersonLouie AndradaGeorge AukonElbert BatallerBrandon BellPierre DutrieuxAnthony FordLauro GardeKathleen GavahanRaul GuerreroEric HuttJullie JacksonStan JacobsAdrian JenkinsBill JirsaPatrick LaanGerald LakarnafeauxKatie LeonardMike LewisChris LittleTed MaksymKen MankoffSteve McPhailMatt MillsAlejandra MonjeDave MunroeFrank NitscheEthan NorrisRogelio PagdangananSebastian PaoniSarah ParkChris PayneJames PerrettJohnny PierceDanilo PlazaVladimir RepinRobin RobertsonRolly RogandoLorenzo SandovalAffiliationEdison Chouest OffshoreStanford UniversityEdison Chouest OffshoreEdison Chouest OffshoreRaytheon Polar ServicesEdison Chouest OffshoreEdison Chouest Offshore<strong>British</strong> Antarctic SurveyEdison Chouest OffshoreEdison Chouest OffshoreRaython Polar ServicesInstituto Nacional de Investigacion y Desarollo PesqueroRaython Polar ServicesRaython Polar ServicesLamont Doherty Earth Observatory<strong>British</strong> Antarctic SurveyRaython Polar ServicesNetherlands Institute for Sea ResearchEdison Chouest OffshoreLamont Doherty Earth Observatory / Columbia UniversityRaython Polar ServicesPrinceton University<strong>British</strong> Antarctic SurveyColumbia University / NASA GISSNational Oceanography <strong>Centre</strong>, SouthamptonStanford UniversityEdison Chouest OffshoreEdison Chouest OffshoreLamont Doherty Earth ObservatoryRaython Polar ServicesEdison Chouest OffshoreEdison Chouest OffshoreMultimedia JournalistUniversity of <strong>British</strong> ColumbiaNational Oceanography <strong>Centre</strong>, SouthamptonEdison Chouest OffshoreEdison Chouest OffshoreEdison Chouest OffshoreUniv. of New South Wales @ ADFAEdison Chouest OffshoreEdison Chouest Offshorecontinued on next page<strong>NBP09</strong>-<strong>01</strong> <strong>Cruise</strong> <strong>Report</strong> (p. 71 of 83) Revised February 27, 2009
PersonAmy SchaubNestor SilverioSharon StammerjohnErnest StellyMaria StenzelGary TalbotRic TamayoCharles ThurozcyDmitry TizonGert Van DijkenSam VillanuevaGreg WatsonMichael WatsonAndy WebbDave WhiteScott WorrilowZim Zimmermancontinued from previous pageAffiliationRaython Polar ServicesEdison Chouest OffshoreUniversity of California, Santa Cruz, Ocean SciencesEdison Chouest OffshorePhotojournalistEdison Chouest OffshoreEdison Chouest OffshoreNetherlands Institute for Sea ResearchRaython Polar ServicesStanford UniversityEdison Chouest OffshoreRaython Polar ServicesEdison Chouest OffshoreNational Oceanography <strong>Centre</strong>, SouthamptonNational Oceanography <strong>Centre</strong>, SouthamptonWoods Hole <strong>Oceanographic</strong> InstituteRaython Polar ServicesTable 9: <strong>Cruise</strong> Personnel<strong>NBP09</strong>-<strong>01</strong> <strong>Cruise</strong> <strong>Report</strong> (p. 72 of 83) Revised February 27, 2009
BCTD Station TableNo. Date Time Latitude Longitude Pres. (dbar)0<strong>01</strong> 2009-<strong>01</strong>-10 16:33 65 21.15 S 093 28.57 W 10<strong>01</strong>002b 2009-<strong>01</strong>-12 12:36 69 59.67 S 102 03.67 W 20<strong>01</strong>003 2009-<strong>01</strong>-12 20:25 70 27.70 S 1<strong>01</strong> 55.99 W 2<strong>01</strong>5004 2009-<strong>01</strong>-13 09:04 70 59.65 S 102 06.79 W 1772005 2009-<strong>01</strong>-13 13:51 71 11.28 S 102 21.86 W 1088006a 2009-<strong>01</strong>-14 00:39 71 20.34 S 102 34.23 W 0627007 2009-<strong>01</strong>-14 05:31 71 43.65 S 103 02.14 W 0738008 2009-<strong>01</strong>-14 19:54 72 07.97 S 104 06.12 W 0579009 2009-<strong>01</strong>-15 05:51 72 32.86 S 104 58.41 W 0541<strong>01</strong>0 2009-<strong>01</strong>-15 16:26 73 00.49 S 106 21.20 W 0597<strong>01</strong>1 2009-<strong>01</strong>-15 23:02 73 26.51 S 106 43.49 W 0882<strong>01</strong>2 2009-<strong>01</strong>-16 06:56 74 <strong>01</strong>.22 S 106 20.07 W 1186<strong>01</strong>3 2009-<strong>01</strong>-16 12:02 74 21.64 S 104 53.34 W 1260<strong>01</strong>4 2009-<strong>01</strong>-16 19:15 74 43.10 S 104 <strong>01</strong>.47 W 1083<strong>01</strong>5 2009-<strong>01</strong>-17 02:14 75 04.03 S 1<strong>01</strong> 50.82 W 0943<strong>01</strong>6 2009-<strong>01</strong>-17 23:35 75 05.51 S 1<strong>01</strong> 46.41 W 0945<strong>01</strong>7 2009-<strong>01</strong>-18 <strong>01</strong>:44 75 02.61 S 1<strong>01</strong> 42.27 W 1047<strong>01</strong>8 2009-<strong>01</strong>-18 03:50 75 00.32 S 1<strong>01</strong> 34.85 W 1065<strong>01</strong>9 2009-<strong>01</strong>-18 05:26 74 57.28 S 1<strong>01</strong> 31.42 W 0982020 2009-<strong>01</strong>-18 06:56 74 54.40 S 1<strong>01</strong> 27.42 W 0832021 2009-<strong>01</strong>-18 08:41 74 51.49 S 1<strong>01</strong> 24.69 W 0777022 2009-<strong>01</strong>-18 10:31 74 48.78 S 1<strong>01</strong> 23.57 W 0708023 2009-<strong>01</strong>-18 12:23 74 46.42 S 1<strong>01</strong> 11.80 W 0713024 2009-<strong>01</strong>-19 03:20 75 06.13 S 1<strong>01</strong> 59.39 W 0228025 2009-<strong>01</strong>-19 04:09 75 04.85 S 102 <strong>01</strong>.26 W 0444026 2009-<strong>01</strong>-19 05:03 75 04.21 S 102 02.71 W 0624027 2009-<strong>01</strong>-19 06:<strong>01</strong> 75 03.36 S 102 04.06 W 0756028 2009-<strong>01</strong>-19 07:17 75 02.24 S 102 <strong>01</strong>.78 W 0911029 2009-<strong>01</strong>-19 08:37 75 <strong>01</strong>.25 S 1<strong>01</strong> 59.00 W 0920030 2009-<strong>01</strong>-19 09:53 75 00.08 S 1<strong>01</strong> 56.25 W 0951031 2009-<strong>01</strong>-19 11:25 74 58.70 S 1<strong>01</strong> 53.13 W 0995032 2009-<strong>01</strong>-19 12:45 74 59.21 S 1<strong>01</strong> 49.00 W 1<strong>01</strong>8033 2009-<strong>01</strong>-19 14:05 74 59.80 S 1<strong>01</strong> 45.71 W 1041034 2009-<strong>01</strong>-19 15:27 75 00.34 S 1<strong>01</strong> 41.05 W 1065035 2009-<strong>01</strong>-19 17:03 75 00.79 S 1<strong>01</strong> 36.81 W 1081036 2009-<strong>01</strong>-19 18:52 74 58.80 S 1<strong>01</strong> 53.07 W 0200037 2009-<strong>01</strong>-20 19:58 75 02.23 S 102 00.80 W 0922038 2009-<strong>01</strong>-20 23:02 74 56.71 S 1<strong>01</strong> 50.69 W 1004039 2009-<strong>01</strong>-21 00:27 74 54.71 S 1<strong>01</strong> 48.66 W 0942040 2009-<strong>01</strong>-21 <strong>01</strong>:49 74 52.81 S 1<strong>01</strong> 46.61 W 0782041 2009-<strong>01</strong>-21 03:11 74 53.21 S 1<strong>01</strong> 41.36 W 0769042 2009-<strong>01</strong>-21 04:17 74 53.62 S 1<strong>01</strong> 35.72 W 0766043 2009-<strong>01</strong>-21 05:26 74 54.17 S 1<strong>01</strong> 27.74 W 0834044 2009-<strong>01</strong>-21 11:30 74 50.90 S 1<strong>01</strong> 44.48 W 0675045 2009-<strong>01</strong>-21 12:50 74 48.82 S 1<strong>01</strong> 42.40 W 0635continued on next page<strong>NBP09</strong>-<strong>01</strong> <strong>Cruise</strong> <strong>Report</strong> (p. 73 of 83) Revised February 27, 2009
continued from previous pageNo. Date Time Latitude Longitude Pres. (dbar)046 2009-<strong>01</strong>-21 14:03 74 47.06 S 1<strong>01</strong> 40.31 W 0633047 2009-<strong>01</strong>-22 09:49 75 03.57 S 1<strong>01</strong> 57.34 W 0798048 2009-<strong>01</strong>-22 22:24 74 54.88 S 1<strong>01</strong> 55.76 W 0879049 2009-<strong>01</strong>-23 <strong>01</strong>:42 74 45.28 S 1<strong>01</strong> 37.12 W 0508050 2009-<strong>01</strong>-23 02:55 74 44.32 S 1<strong>01</strong> 33.99 W 0541051 2009-<strong>01</strong>-23 04:02 74 43.67 S 1<strong>01</strong> 25.19 W 0532052 2009-<strong>01</strong>-23 05:<strong>01</strong> 74 44.18 S 1<strong>01</strong> 23.85 W 0530053 2009-<strong>01</strong>-23 05:58 74 45.33 S 1<strong>01</strong> 21.36 W 0599054 2009-<strong>01</strong>-23 07:00 74 45.97 S 1<strong>01</strong> 18.93 W 0654055 2009-<strong>01</strong>-23 08:08 74 46.44 S 1<strong>01</strong> 17.68 W 0676056 2009-<strong>01</strong>-24 00:58 75 <strong>01</strong>.19 S 103 57.07 W 0634057 2009-<strong>01</strong>-24 02:17 75 03.12 S 103 58.20 W 0473058 2009-<strong>01</strong>-24 20:58 75 05.44 S 1<strong>01</strong> 46.52 W 0905059 2009-<strong>01</strong>-24 22:00 75 05.42 S 1<strong>01</strong> 46.50 W 09<strong>01</strong>060 2009-<strong>01</strong>-24 22:59 75 05.44 S 1<strong>01</strong> 46.53 W 0803061 2009-<strong>01</strong>-25 00:14 75 05.42 S 1<strong>01</strong> 46.50 W 09<strong>01</strong>062 2009-<strong>01</strong>-25 00:58 75 05.42 S 1<strong>01</strong> 46.52 W 09<strong>01</strong>063 2009-<strong>01</strong>-25 <strong>01</strong>:58 75 05.40 S 1<strong>01</strong> 46.51 W 0800064 2009-<strong>01</strong>-25 02:59 75 05.42 S 1<strong>01</strong> 46.50 W 0800065 2009-<strong>01</strong>-25 03:58 75 05.41 S 1<strong>01</strong> 46.48 W 0800066 2009-<strong>01</strong>-25 04:59 75 05.43 S 1<strong>01</strong> 46.51 W 08<strong>01</strong>067 2009-<strong>01</strong>-25 05:58 75 05.44 S 1<strong>01</strong> 46.56 W 08<strong>01</strong>068 2009-<strong>01</strong>-25 06:55 75 05.42 S 1<strong>01</strong> 46.51 W 0800069 2009-<strong>01</strong>-25 07:59 75 05.40 S 1<strong>01</strong> 46.47 W 0800070 2009-<strong>01</strong>-25 08:57 75 05.45 S 1<strong>01</strong> 46.53 W 08<strong>01</strong>071 2009-<strong>01</strong>-25 09:55 75 05.41 S 1<strong>01</strong> 46.47 W 0800072 2009-<strong>01</strong>-25 10:58 75 05.41 S 1<strong>01</strong> 46.46 W 0800073 2009-<strong>01</strong>-25 11:58 75 05.42 S 1<strong>01</strong> 46.51 W 08<strong>01</strong>074 2009-<strong>01</strong>-25 12:56 75 05.39 S 1<strong>01</strong> 46.42 W 0800075 2009-<strong>01</strong>-25 13:58 75 05.42 S 1<strong>01</strong> 46.51 W 08<strong>01</strong>076 2009-<strong>01</strong>-25 14:58 75 05.41 S 1<strong>01</strong> 46.49 W 08<strong>01</strong>077 2009-<strong>01</strong>-25 15:58 75 05.41 S 1<strong>01</strong> 46.49 W 0803078 2009-<strong>01</strong>-25 16:58 75 05.41 S 1<strong>01</strong> 46.49 W 0800079 2009-<strong>01</strong>-25 17:58 75 05.47 S 1<strong>01</strong> 46.60 W 0800080 2009-<strong>01</strong>-25 18:58 75 05.44 S 1<strong>01</strong> 46.57 W 0800081 2009-<strong>01</strong>-25 19:58 75 05.45 S 1<strong>01</strong> 46.56 W 09<strong>01</strong>082 2009-<strong>01</strong>-26 03:59 74 38.59 S 1<strong>01</strong> 42.95 W 0609083 2009-<strong>01</strong>-26 05:12 74 38.59 S 1<strong>01</strong> 55.48 W 0630084 2009-<strong>01</strong>-26 06:29 74 38.65 S 102 10.56 W 0621085 2009-<strong>01</strong>-26 08:52 74 39.46 S 102 35.<strong>01</strong> W 0752086 2009-<strong>01</strong>-26 10:39 74 43.06 S 102 48.20 W 1<strong>01</strong>2087 2009-<strong>01</strong>-26 13:08 74 45.93 S 102 56.74 W 1078088 2009-<strong>01</strong>-26 15:05 74 49.66 S 103 09.41 W 1058089 2009-<strong>01</strong>-26 18:32 74 53.66 S 103 28.55 W 0872090 2009-<strong>01</strong>-26 21:00 74 57.13 S 103 48.74 W 0721091 2009-<strong>01</strong>-27 09:06 74 12.50 S 105 35.68 W 1627092 2009-<strong>01</strong>-28 12:10 74 46.29 S 1<strong>01</strong> 11.71 W 0667093 2009-<strong>01</strong>-28 18:43 75 05.55 S 1<strong>01</strong> 46.52 W 0926continued on next page<strong>NBP09</strong>-<strong>01</strong> <strong>Cruise</strong> <strong>Report</strong> (p. 74 of 83) Revised February 27, 2009
continued from previous pageNo. Date Time Latitude Longitude Pres. (dbar)094 2009-<strong>01</strong>-28 21:58 75 <strong>01</strong>.52 S 102 44.54 W 0789095 2009-<strong>01</strong>-29 00:00 75 03.04 S 102 44.49 W 0628096 2009-<strong>01</strong>-29 <strong>01</strong>:06 75 03.58 S 102 44.66 W 0413097 2009-<strong>01</strong>-29 <strong>01</strong>:59 75 04.09 S 102 44.50 W 0305098 2009-<strong>01</strong>-29 13:46 74 54.34 S 102 22.69 W 0945099 2009-<strong>01</strong>-29 15:40 74 49.83 S 102 37.55 W 0997100 2009-<strong>01</strong>-29 18:37 74 50.82 S 103 17.12 W 109<strong>01</strong><strong>01</strong> 2009-<strong>01</strong>-30 13:36 74 45.46 S 104 16.25 W 1224102 2009-<strong>01</strong>-30 20:25 74 33.03 S 103 10.60 W 1079103 2009-<strong>01</strong>-31 03:11 74 38.43 S 104 23.66 W 1516104 2009-<strong>01</strong>-31 17:56 74 09.97 S 104 00.11 W 0316105 2009-<strong>01</strong>-31 21:57 73 55.03 S 104 59.86 W 0304106 2009-02-<strong>01</strong> <strong>01</strong>:16 73 44.98 S 106 00.05 W 0869107 2009-02-<strong>01</strong> 04:57 73 35.06 S 106 59.98 W 0605108 2009-02-<strong>01</strong> 09:08 73 25.<strong>01</strong> S 108 00.13 W 0631109 2009-02-<strong>01</strong> 12:17 73 20.<strong>01</strong> S 109 00.12 W 0462110 2009-02-02 07:42 73 08.02 S 112 <strong>01</strong>.40 W 0408111 2009-02-02 12:22 72 54.96 S 114 00.11 W 050<strong>01</strong>12 2009-02-02 18:03 72 46.44 S 115 45.47 W 0641113 2009-02-03 02:21 73 09.78 S 115 00.99 W 0759114 2009-02-03 06:55 73 38.02 S 115 15.30 W 0918115 2009-02-03 11:45 73 52.62 S 116 49.68 W 1142116 2009-02-03 15:08 73 48.99 S 117 59.11 W 1209117 2009-02-03 21:48 73 57.68 S 118 02.71 W 1274118 2009-02-04 13:22 73 42.76 S 113 17.28 W 084<strong>01</strong>19 2009-02-04 18:41 74 10.37 S 113 20.39 W 0588120 2009-02-04 21:11 74 11.54 S 113 12.72 W 0811121 2009-02-04 22:50 74 13.<strong>01</strong> S 112 52.49 W 0745122 2009-02-05 00:35 74 13.03 S 112 31.88 W 1184123 2009-02-05 02:42 74 13.79 S 112 11.64 W 1<strong>01</strong>3124 2009-02-05 04:17 74 13.22 S 111 56.50 W 0593125 2009-02-05 07:35 74 11.55 S 112 31.24 W 1066126 2009-02-06 09:14 74 17.13 S 109 50.71 W 0892127 2009-02-07 00:08 73 31.65 S 110 24.87 W 0313128 2009-02-07 19:41 73 02.31 S 110 <strong>01</strong>.06 W 0431129 2009-02-07 22:31 73 08.42 S 109 10.70 W 0456130 2009-02-08 09:14 72 22.04 S 108 48.09 W 0537131 2009-02-08 17:<strong>01</strong> 72 17.54 S 106 56.49 W 0683132 2009-02-09 09:16 71 42.41 S 105 09.47 W 0531133 2009-02-09 21:27 70 59.29 S 106 <strong>01</strong>.20 W 154<strong>01</strong>34 2009-02-10 <strong>01</strong>:20 71 02.03 S 105 58.52 W 1084135 2009-02-10 04:10 71 08.05 S 106 <strong>01</strong>.81 W 0515136 2009-02-10 06:03 71 11.89 S 106 03.31 W 0515137 2009-02-10 13:31 71 45.96 S 106 53.78 W 0527138 2009-02-10 23:42 71 30.46 S 108 18.70 W 049<strong>01</strong>39 2009-02-11 05:45 71 20.08 S 109 46.57 W 0461140 2009-02-11 10:53 71 39.10 S 110 34.61 W 0471141 2009-02-12 00:55 71 53.27 S 112 13.25 W 0529continued on next page<strong>NBP09</strong>-<strong>01</strong> <strong>Cruise</strong> <strong>Report</strong> (p. 75 of 83) Revised February 27, 2009
continued from previous pageNo. Date Time Latitude Longitude Pres. (dbar)142 2009-02-12 11:21 71 34.07 S 113 <strong>01</strong>.83 W 0597143 2009-02-12 15:34 71 27.28 S 113 25.21 W 0633144 2009-02-12 18:50 71 24.52 S 113 29.90 W 1079145 2009-02-12 23:55 71 38.71 S 114 23.43 W 0455146 2009-02-13 08:40 71 59.68 S 115 36.77 W 0445147 2009-02-13 15:00 72 20.09 S 117 00.39 W 0519148 2009-02-13 23:06 73 20.24 S 117 51.44 W 0358149 2009-02-14 04:32 73 55.35 S 118 49.47 W 0751150 2009-02-14 05:52 73 56.37 S 118 40.10 W 1466151 2009-02-14 07:43 73 58.50 S 118 30.22 W 1336152 2009-02-14 09:39 73 59.75 S 118 18.69 W 1061153 2009-02-14 11:27 74 00.68 S 118 07.86 W 1006154 2009-02-14 14:07 74 <strong>01</strong>.12 S 117 54.04 W 1202155 2009-02-14 16:22 74 <strong>01</strong>.70 S 117 39.00 W 0639156 2009-02-15 04:52 72 06.72 S 117 55.36 W 0505157 2009-02-15 08:26 71 57.16 S 118 26.43 W 0593158 2009-02-15 10:19 71 54.10 S 118 43.24 W 1113159 2009-02-17 05:39 66 26.98 S 129 28.23 W 12<strong>01</strong>160 2009-02-18 04:02 66 59.99 S 128 58.06 W 4498Table 10: Table listing of all CTD date, time, location, and maximum pressure<strong>NBP09</strong>-<strong>01</strong> <strong>Cruise</strong> <strong>Report</strong> (p. 76 of 83) Revised February 27, 2009
CPre-cruise Project PlansC.1 Amundsen Sea Influence on West Antarctic Ice Sheet Stability and SeaLevel RiseStan Jacobs (Lamont Earth Observatory), Adrian Jenkins (<strong>British</strong> Antarctic Survey) Hartmut Hellmer(Alfred-Wegener Institute)Figure 47: Circumpolar Deep Water crosses the continental shelf break and ponds in deep, glacially-cuttroughs on the Amundsen continental shelf, from which it gains access to vulnerable ice shelf groundinglines. Moorings and measurements during <strong>NBP09</strong>-<strong>01</strong> will focus on the eastern and central troughs, shelfbreak, ice shelf fronts and cavities, sea ice cover and sea floor bathymetry.Research ObjectivesWest Antarctica is a marine ice sheet grounded below sea level in an evolving ocean. Its stability in achanging climate hinges on the balance between surface accumulation, ice stream flow, iceberg calving andin situ basal melting of its fringing ice shelves. In the Amundsen Sea’s greater Pine Island Bay, deep shelf iceis melting orders of magnitude faster than elsewhere around Antarctica, driven by large intrusions of ’warm’deep water onto the continental shelf. Remote sensing studies have correlated that melting with thinning iceshelves, increased velocity of inflowing ice streams and drawdown of the adjacent ice sheet. Multi-year timeseries of ocean properties and currents are needed to better understand seasonal and interannual variabilityof deep water access to the continental shelf and ice shelf cavities. To clarify Amundsen Sea influence onthe regional ice shelves and the effects of ice sheet change on the coastal ocean, we will begin to monitor theocean properties and circulation, within an IPY context. Water column profiling and sampling will provideinformation about thermohaline variability and meltwater content 15 years after the first observations in thissector. Pack ice investigations will focus on the roles of snow ice and ocean heat transport in sea ice massbalance. Swath mapping of the sea floor will concentrate on the deep troughs and outer shelf depressions thatfunnel the warm, salty deep water to potentially vulnerable ice shelf grounding zones. The measurements<strong>NBP09</strong>-<strong>01</strong> <strong>Cruise</strong> <strong>Report</strong> (p. 77 of 83) Revised February 27, 2009
obtained will be used to model ocean properties, circulation, and interactions with the cryosphere.Field-Season OverviewDuring a 54-day cruise of the NB Palmer to the eastern Amundsen Sea (<strong>NBP09</strong>-<strong>01</strong>) in Jan-Feb 2009, we willattempt to set 15 arrays of instruments to record temperature, conductivity, pressure and ocean currentsnear the shelf break, ice shelf fronts, and along/across deep glacial troughs on the continental shelf (figure47). CTD/rosette/LADCP casts and water sampling will be done at the mooring sites, along nominal N-Sand E-W transects and at locations where CTD stations have previously been occupied. Porpoising oceandrifters and XBTs will be deployed at various points along the ship’s track. Sea ice cores will be obtainedand processed aboard, and buoys set out on the ice to transmit position and mass balance parameters overtime. The sea floor will be mapped via multibeam sonar, and a variety of standard and enhanced surfacemeasurements made underway. Water samples will be processed aboard ship for salinity and dissolved oxygen,and returned to US laboratories for CO 2 and oxygen isotope analyses. This work will share time and becoordinated with three other <strong>NBP09</strong>-<strong>01</strong> projects. Moored arrays set during the cruise will be reset/recoveredin early 2<strong>01</strong>0/2<strong>01</strong>1.C.2 Ocean Circulation and Ice Shelf Melting on the Amundsen Sea ContinentalShelfAdrian Jenkins (<strong>British</strong> Antarctic Survey), Stan Jacobs (Lamont Earth Observatory)BackgroundThe Antarctic ice sheet, which represents the largest of all potential contributors to sea level rise, appearsto be losing mass at a rate that has accelerated over recent decades. Ice loss is focussed in a number of keydrainage basins where dynamical changes in the outlet glaciers have led to increased discharge. The mostsignificant recent mass losses have been from the basins that drain along the Amundsen Sea coast. Thesynchronous response of several independent glaciers, coupled with the observation that thinning is mostrapid over their floating termini, is generally taken as an indicator that the changes have been driven fromthe ocean, but the precise mechanism has remained speculative. Observations have revealed that the deeperparts of the Amundsen Sea shelf are flooded by almost unmodified Circumpolar Deep Water (CDW) witha temperature around 1 o C, and that this drives rapid melting of the floating ice. We need to understandwhat processes determine the strength of the CDW inflow and how it interacts with the floating ice in orderto quantify the past, present and possible future oceanic forcing on the glaciers.ObjectivesThis project will use the UK Natural Environment Research Council’s autonomous underwater vehicle(Autosub-III) to study how the warm CDW gets beneath the Amundsen sea ice shelves and how it determinesthe melt rate of the ice shelves. Specifically we aim to: map the seabed beneath the ice shelves;map the underside of the ice shelves; and determine where and how heat is transferred from the inflowingCDW to the outflowing ice-ocean boundary layer. To do this Autosub-III will carry the following instrumentation:Seabird CTD, with dual C and T sensors plus DO sensor and transmissometer; Simrad multi-beamechosounder; upward-looking RDI 300 kHz ADCP; downward-looking RDI 150 kHz ADCP.Our primary target will be Pine Island Glacier (PIG), which is also the target of a US IPY project thataims to drill through the ice shelf and deploy moored instruments within the cavity. Our spatial survey ofwater properties beneath the glacier will complement their time-series of observations in one small area. The<strong>NBP09</strong>-<strong>01</strong> <strong>Cruise</strong> <strong>Report</strong> (p. 78 of 83) Revised February 27, 2009
Figure 48: Missions, three each, penetrating 60 and 120 km into cavity (side view). Note grounding lineis now thought to be near the break in slope at around 15 km. The seabed depth is completely unknownbetween there and the ice front. That shown is a guess only.ideal set of missions would comprise: 3 x 60 km missions to depth 600 m, in the outer half of the cavity;3 x 120 km missions to depth of 1000 m, extending as far into the cavity as possible (a minimum watercolumn thickness of 100m being the cut-off). A rough cross-section of one short and one long mission isshown below. The other two would run parallel to this. Mission duration for the shorter ones will be around20 hours, for the longer ones around 30 hours (including deployment and recovery time). Turnaround timewill be about 12 hours between missions. In addition a short test mission (8 hours) will be required in openwater anywhere on the continental shelf.ContingencyIf ice blocks access to the PIG front, mission tracks will be longer. In this case fewer mission will be run(total run time is limited by battery capacity). If the length of the traverse beneath the sea ice makes workbeneath PIG impractical, Thwaites, Crosson, Dotson, Getz of Abbott ice shelves would make worthwhiletargets (in that order of priority). We would lose the advantage of a parallel sub-ice shelf mooring project,but the key processes controlling inflow to the cavity and melting within it would be the same.C.3 Shedding dynamic light on iron limitation: The interplay of iron limitationand dynamic irradiance conditions in governing the phytoplanktondistribution in the Ross SeaKevin Arrigo (Stanford University)<strong>NBP09</strong>-<strong>01</strong> <strong>Cruise</strong> <strong>Report</strong> (p. 79 of 83) Revised February 27, 2009
Research ObjectivesThe Southern Ocean plays an important role in the global carbon cycle, due to its large size and uniquephysiochemical characteristics. Approximately 25% of total anthropogenic CO 2 uptake by the oceans takesplace in the Southern Ocean, mainly via primary production by phytoplankton. However, changes in theAntarctic climate may impact phytoplankton primary productivity and hence, the carbon export by theSouthern Ocean. Primary production in the Southern Ocean is dominated by two phytoplankton groupsthat bloom in distinct locations and times: diatoms dominate blooms in the shallow mixed layer of the continentalshelf, whereas the colony forming Phaeocystis antarctica (Prymnesiophyceae) dominates blooms inthe more deeply mixed, open regions. Understanding what controls the dynamics of these two phytoplanktontaxa is essential because they dominate virtually all polar waters, they have vastly different nutrientutilization characteristics, and both support very different marine food webs. In addition, this understandingis needed to recognize the potential impact of climate change on the Antarctic phytoplankton communityand predict their role in the carbon export in the future. Previous experiments in our laboratory suggestthat taxon-specific differences in photoacclimation contribute to the observed distribution. However, photoacclimationdoes not seem to be the only factor that controls the phytoplankton distribution. Iron (Fe)limitation of the algal communities in both the sub-Arctic and the Southern Ocean is now well documented.Moreover, phytoplankton Fe demand varies as a function of irradiance. Therefore, the main hypothesis of theproposed research is: The interaction between Fe limitation and dynamic irradiance governs phytoplanktondistributions in the Southern Ocean.Field Season OverviewResults from our cruise to the Amundsen Sea in the Antarctic summer 2009 will be compared to resultsobtained last year during the ANT XXIV/3 cruise. IPY-partner Prof. H.J.W. de Baar (Royal NIOZ, TheNetherlands) is sending his expert team to join us to measure concentrations of the total dissolved Fe. Atlocations harboring one of the two dominant phytoplankton communities at different stages of their respectiveblooms, photoregulatory processes, pigment ratios, and the effect of the prevailing Fe-levels on the extentto which phytoplankton are protected against photoinhibition when they reside close to the surface, willbe determined. In addition, the extent to which the phytoplankton community is Fe-limited and able touse organically bound (ligand bound) Fe will be assessed in bottle experiments. Phytoplankton sampleswill be incubated over six days with the addition of dissolved Fe and/or a ligand (e.g., the siderophoreferrioxamine B), whereas in control experiments no Fe will be added. Increases in phytoplankton biomasswill be determined from cell counts and POC content.We will need to sample regions with phytoplankton at different stages of bloom development. Transect workwould be ideal, as would be the ability to sample some stations more than once. Depending on cruise track,we would be interested in sampling the Amundsen polynya (centered at 115 o W) while in transit to PineIsland Bay. We would like to sample one station each day, preferably in the morning. On even days, we willrequire 40 L of water to be collected from a single depth (∼50 m) using the standard rosette that accompaniesthe CTD package. A second cast will be performed at this station using trace-metal clean Niskin bottlesattached to a Kevlar wire that will sample from multiple depths near the ocean surface (
C.4 Collaborative Research: Sampling the ocean - sea ice interaction in thePacific center of the Antarctic DipoleXiaojun Yuan (Lamont Earth Observatory), Janet Sprintall (Scripps Institution of Oceanography), DouglasMartinson (Lamont Earth Obsservatory)Project SummaryFigure 49: Target mooring site and topography.The Antarctic Dipole (ADP) presents thestrongest tropical-polar teleconnectionclimate signal in the Southern Ocean,with poles centered within the Ross Gyreof the Pacific sector and the central WeddellGyre of the Atlantic sector. TheADP is a standing mode pattern characterizedby out-of-phase relationships inthe surface air temperature, sea surfacetemperature, and sea ice fields. The opposinglarge-scale spatial patterns of theADP within the Pacific and Atlantic centersare clearly associated with both positiveand negative phases of ENSO. Outsidethese sectors the anomalies are notcoherent or distinct. Furthermore, theanomalous signals persist in the subpolarwaters for nearly a year after the demiseof the ENSO event in the tropics. Whilethe atmospheric and sea surface signaturesof the ADP have received much recentattention, little is known about therole of the upper ocean in maintainingand reinforcing the ADP climate anomaliesin the Southern Ocean. Clearly the upper ocean has a longer memory and larger heat capacity than theatmosphere to preserve anomalous climate signals.ObjectivesThe main objective of this proposal is to investigate the response of the upper ocean and the variabilityin the air-sea-ice system in the centers of the ADP in the Southern Ocean. Specifically, we are motivatedby the desire to better understand the local and regional processes underlying the response of the ADP toclimate forcing on synoptic to ENSO time scales. Our key goal is to determine the role of the upper oceanin maintaining the ADP climate signal in the Southern Ocean. Specifically, this international program willdocument and investigate the processes of ocean-sea ice interaction that amplify and maintain the strongADP signal in the subpolar South Pacific.Fieldwork overviewTo achieve our goal, multi-year mooring deployments are planned within each center of the ADP in thewestern Ross gyre and the central Weddell Gyre. While German scientists have led the monitoring effort inthe Weddell Gyre, this project is to support the U.S. led effort to deploy a mooring in the Pacific center of<strong>NBP09</strong>-<strong>01</strong> <strong>Cruise</strong> <strong>Report</strong> (p. 81 of 83) Revised February 27, 2009
the ADP in west of the Amundsen Sea. The target mooring site is at 66.45 o S, 129.47 o W, where the largestADP climate signal frequently appears in sea ice and surface temperature fields; high resolution topographydata are available; and sea floor is relatively flat. The moorings will be initially deployed in austral summer2008-9, redeployed in austral summer 2<strong>01</strong>0-11, and recovered in austral summer 2<strong>01</strong>2-13. The mooring willconsist of an ice profiling sonar, McLane Moored Profiler (MMP), discrete SeaBird temperature, conductivityand pressure sensors, as well as a current meter. This mooring will resolve the upper ocean stratification andvelocity between 75 and 550m over a variety of time scales from daily to interannual. The ice profiling sonarwill be installed at the top of the mooring to provide simultaneous measurements of the ice draft. A fulldepth CTD station at the mooring site is planned during the first deployment for ballasting the MMP andproviding background stratification. In case of severe weather that prohibits the deployment at the targetsite, the mooring can be deployed at an alternative site, as close as possible to the target site. Combinedwith satellite measurements of sea ice concentration/drift, winds, sea surface and air temperatures, the directmeasurements of the stratification and sea ice thickness from the mooring data will allow us, for the firsttime, to unambiguously determine the dynamical processes of the coupled upper ocean-air-ice system in theSouthern Ocean that link these polar regions to large-scale climate variability.<strong>NBP09</strong>-<strong>01</strong> <strong>Cruise</strong> <strong>Report</strong> (p. 82 of 83) Revised February 27, 2009