High pressure X-ray diffraction study of SrMnO3 perovskite
High pressure X-ray diffraction study of SrMnO3 perovskite
High pressure X-ray diffraction study of SrMnO3 perovskite

You also want an ePaper? Increase the reach of your titles
YUMPU automatically turns print PDFs into web optimized ePapers that Google loves.
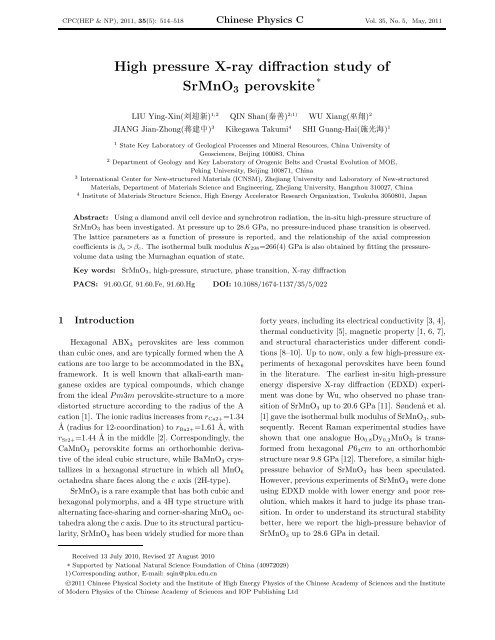
CPC(HEP & NP), 2011, 35(5): 514–518 Chinese Physics C Vol. 35, No. 5, May, 2011<strong>High</strong> <strong>pressure</strong> X-<strong>ray</strong> <strong>diffraction</strong> <strong>study</strong> <strong>of</strong>SrMnO 3 <strong>perovskite</strong> *LIU Ying-Xin() 1,2 QIN Shan() 2;1) WU Xiang() 2JIANG Jian-Zhong() 3 Kikegawa Takumi 4 SHI Guang-Hai() 11 State Key Laboratory <strong>of</strong> Geological Processes and Mineral Resources, China University <strong>of</strong>Geosciences, Beijing 100083, China2 Department <strong>of</strong> Geology and Key Laboratory <strong>of</strong> Orogenic Belts and Crustal Evolution <strong>of</strong> MOE,Peking University, Beijing 100871, China3 International Center for New-structured Materials (ICNSM), Zhejiang University and Laboratory <strong>of</strong> New-structuredMaterials, Department <strong>of</strong> Materials Science and Engineering, Zhejiang University, Hangzhou 310027, China4 Institute <strong>of</strong> Materials Structure Science, <strong>High</strong> Energy Accelerator Research Organization, Tsukuba 3050801, JapanAbstract: Using a diamond anvil cell device and synchrotron radiation, the in-situ high-<strong>pressure</strong> structure <strong>of</strong>SrMnO 3 has been investigated. At <strong>pressure</strong> up to 28.6 GPa, no <strong>pressure</strong>-induced phase transition is observed.The lattice parameters as a function <strong>of</strong> <strong>pressure</strong> is reported, and the relationship <strong>of</strong> the axial compressioncoefficients is β a > β c. The isothermal bulk modulus K 298=266(4) GPa is also obtained by fitting the <strong>pressure</strong>volumedata using the Murnaghan equation <strong>of</strong> state.Key words:SrMnO 3, high-<strong>pressure</strong>, structure, phase transition, X-<strong>ray</strong> <strong>diffraction</strong>PACS: 91.60.Gf, 91.60.Fe, 91.60.Hg DOI: 10.1088/1674-1137/35/5/0221 IntroductionHexagonal ABX 3 <strong>perovskite</strong>s are less commonthan cubic ones, and are typically formed when the Acations are too large to be accommodated in the BX 6framework. It is well known that alkali-earth manganeseoxides are typical compounds, which changefrom the ideal P m3m <strong>perovskite</strong>-structure to a moredistorted structure according to the radius <strong>of</strong> the Acation [1]. The ionic radius increases from r Ca2+ =1.34Å (radius for 12-coordination) to r Ba2+ =1.61 Å, withr Sr2+ =1.44 Å in the middle [2]. Correspondingly, theCaMnO 3 <strong>perovskite</strong> forms an orthorhombic derivative<strong>of</strong> the ideal cubic structure, while BaMnO 3 crystallizesin a hexagonal structure in which all MnO 6octahedra share faces along the c axis (2H-type).SrMnO 3 is a rare example that has both cubic andhexagonal polymorphs, and a 4H type structure withalternating face-sharing and corner-sharing MnO 6 octahedraalong the c axis. Due to its structural particularity,SrMnO 3 has been widely studied for more thanforty years, including its electrical conductivity [3, 4],thermal conductivity [5], magnetic property [1, 6, 7],and structural characteristics under different conditions[8–10]. Up to now, only a few high-<strong>pressure</strong> experiments<strong>of</strong> hexagonal <strong>perovskite</strong>s have been foundin the literature. The earliest in-situ high-<strong>pressure</strong>energy dispersive X-<strong>ray</strong> <strong>diffraction</strong> (EDXD) experimentwas done by Wu, who observed no phase transition<strong>of</strong> SrMnO 3 up to 20.6 GPa [11]. Søndenå et al.[1] gave the isothermal bulk modulus <strong>of</strong> SrMnO 3 , subsequently.Recent Raman experimental studies haveshown that one analogue Ho 0.8 Dy 0.2 MnO 3 is transformedfrom hexagonal P 6 3 cm to an orthorhombicstructure near 9.8 GPa [12]. Therefore, a similar high<strong>pressure</strong>behavior <strong>of</strong> SrMnO 3 has been speculated.However, previous experiments <strong>of</strong> SrMnO 3 were doneusing EDXD molde with lower energy and poor resolution,which makes it hard to judge its phase transition.In order to understand its structural stabilitybetter, here we report the high-<strong>pressure</strong> behavior <strong>of</strong>SrMnO 3 up to 28.6 GPa in detail.Received 13 July 2010, Revised 27 August 2010* Supported by National Natural Science Foundation <strong>of</strong> China (40972029)1) Corresponding author, E-mail: sqin@pku.edu.cn©2011 Chinese Physical Society and the Institute <strong>of</strong> <strong>High</strong> Energy Physics <strong>of</strong> the Chinese Academy <strong>of</strong> Sciences and the Institute<strong>of</strong> Modern Physics <strong>of</strong> the Chinese Academy <strong>of</strong> Sciences and IOP Publishing Ltd
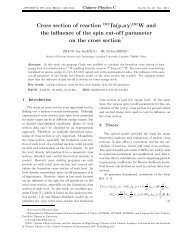
No. 5 LIU Ying-Xin et al: <strong>High</strong> <strong>pressure</strong> X-<strong>ray</strong> <strong>diffraction</strong> <strong>study</strong> <strong>of</strong> SrMnO 3 <strong>perovskite</strong> 5152 ExperimentsThe SrMnO 3 sample used in this <strong>study</strong> was synthesizedusing the standard solid state method. Thereagents SrCO 3 and MnO 2 (Chempur, 99.9%) weredried for 5 hours at 500 degrees centigrade. Mixtures<strong>of</strong> stoichiometric amounts were heated form 500to 1000 degrees centigrade at a rate <strong>of</strong> 30 degreescentigrade per hour, then cooled down to room temperaturein a furnace slowly. After periodic regrindingin an agate mortar, the samples were fired from1000 to 1400 degrees centigrade in air. After that,the samples were kept at 1400 degrees centigrade formore than 23 hours, and then cooled rapidly to roomtemperature in air. Quantitative chemical analyseswere obtained using a JEOL JXA-8100 electron microprobe(EMP) at the Key Laboratory <strong>of</strong> OrogenicBelts and Crustal Evolution <strong>of</strong> MOE, Peking University.The system was operated using a defocusedelectron beam (φ1 µm) at an accelerating voltage <strong>of</strong>15 kV and with a beam current <strong>of</strong> 10 nA. A range <strong>of</strong>standard minerals from SPI was used for standardizationand all data were reduced using the PHZ correctionroutine. The resulting chemical formula representsan average <strong>of</strong> 3 analyses and was calculatedon a 3-oxygen basis (Table 1).Table 1.Chemical composition <strong>of</strong> SrMnO 3. ¯x: average values over three EMP data.MnO 2 SrO CaO Mn (wt.%) Sr (wt.%) Ca (wt.%) O (wt.%) Mn/mol Sr/mol Ca/mol O/mol1 45.77 53.68 0.062 28.92 45.39 0.04 25.15 1.000 0.988 0.002 32 45.14 54.90 0.049 28.52 46.42 0.04 25.11 0.993 1.013 0.002 33 45.36 54.09 0.067 28.66 45.74 0.05 25.07 0.999 1.000 0.002 3¯x 45.42 54.22 0.059 28.70 45.85 0.04 25.11 0.999 1.000 0.002 3The high-<strong>pressure</strong> angular dispersive X-<strong>ray</strong><strong>diffraction</strong> (ADXD) measurement was performed atBeam Line 13A, KEK, in Japan, with a 400 µmculet Mao-Bell Diamond Anvil Cell (DAC) and animaging plate detector. The X-<strong>ray</strong> beam was focusedto a 50 µm×50 µm dimension. Monochromaticsynchrotron radiation at λ=0.4263 Å was used fordata collection with 2θ ranging between 5 ◦ and 22 ◦ .Twenty runs up to 28.6 GPa were carried out. A typicalexposure time <strong>of</strong> about 7 min was employed fora <strong>diffraction</strong> pattern at high <strong>pressure</strong>.16:4:1 methanol-ethanol-water mixture was usedas the <strong>pressure</strong> medium in DAC, with T301 stainlesssteel as the sealing gasket. The SrMnO 3 sampleswere ground into powder and loaded together with aruby chip into a 200 µm hole, which was drilled on agasket and pressurized to 50 µm thick. The <strong>pressure</strong>was measured by the shift <strong>of</strong> the R1 photoluminescenceline <strong>of</strong> ruby [13].SrMnO 3 under ambient conditions were obtained,which are in good agreement with other experimentalvalues [6, 8, 15, 16].The selected patterns <strong>of</strong> different <strong>pressure</strong>s up to28.6 GPa are illustrated in Fig. 1. All <strong>of</strong> these <strong>diffraction</strong>lines have been normalized and eliminated thebackgrounds. More than 20 <strong>diffraction</strong> peaks were observedand indexed at normal atmospheric <strong>pressure</strong>,with several peaks indexed as the reaction residues.With an increase in <strong>pressure</strong>, all <strong>of</strong> these peaks shifttoward higher degrees. Due to the lower initial intensity,couples <strong>of</strong> peaks seem to merge into one at28.6 GPa, such as 202 and 104 near 12 ◦ , 212 and 204around 15 ◦ . In order to figure them out, we plottedthe analysis result <strong>of</strong> the representative 202 and 1043 Results and discussionTwo-dimensional ring patterns were processed usingthe program WINPIP in order to yield the intensityversus 2θ plots. The phase analysis was performedby fitting the ADXD pr<strong>of</strong>ile with the Rietveldmethod using the GSAS s<strong>of</strong>tware [14]. Refined parametersinclude histogram scale factors, background coefficients,zero point shift, lattice parameters, atomicpositions, pr<strong>of</strong>ile parameters, and linewidths. Cellparameters a=5.4426(8) Å and c=9.0793(16) Å <strong>of</strong>Fig. 1. Selected ADXD patterns <strong>of</strong> SrMnO 3 atdifferent <strong>pressure</strong>s.
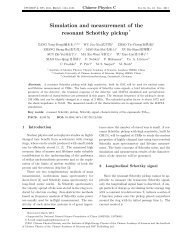
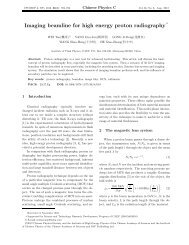
516 Chinese Physics C (HEP & NP) Vol. 35peaks in Fig. 2. It can be seen that the calculatedpattern is in better agreement with the observed patternwhen two peaks are used, which means that theweak <strong>diffraction</strong> line has only been covered by thehigher one. Similar fitting results were also obtainedin other peaks up to 28.6 GPa, which indicates thatthe structure <strong>of</strong> SrMnO 3 is unchanged. Accordingto the fitting result, the P 6 3 /mmc structure modelwas used to refine the pattern under 28.6 GPa andsatisfactory results were obtained (Fig. 3).Fig. 2. The observed ADXD pattern (ellipses and dash lines) <strong>of</strong> SrMnO 3 between 11.7 ◦ and 12.6 ◦ comparedwith the calculated pattern (solid lines) at 28.6 GPa (the right pattern fitted with two peaks was morematchable than the left one, which was calculated with one peak).Fig. 3. The observed (shown as crosses), calculated(solid line on the crosses) and difference(solid line below the ticks) plots from thestructural refinement <strong>of</strong> SrMnO 3 (P 6 3/mmc)against the ADXD data collected at 28.6 GPa.Tick marks indicate the calculated positions <strong>of</strong>peaks.increasing <strong>pressure</strong>. Therefore, the Mn-Mn distancegets shorter at higher <strong>pressure</strong>. According to Pauling’srules, the repulsive force will play a dominantrole when the Mn-Mn distance gets short enough.Correspondingly, the Mn-Mn distance shortens withmore and more difficulty because <strong>of</strong> the stronger repulsiveforce. While the <strong>pressure</strong> continues to beloaded, the MnO 6 octahedra will be distorted moreobviously along their corner-sharing directions, whichare almost parallel to the a axis. This may be the potentialreason for the higher compressibility <strong>of</strong> the aaxis.Values <strong>of</strong> cell parameters as a function <strong>of</strong> <strong>pressure</strong>are listed in Table 2. The relative compression <strong>of</strong> unitcell parameters is plotted in Fig. 4. As shown in thisfigure, it can be seen that the a axis is more compressible.The compression ratios are β a =1.11×10 −3GPa −1 and β c =0.85×10 −3 GPa −1 , with β a: β c =1:0.77. According to the GSAS refinement, the averagebond distance <strong>of</strong> Mn-O in MnO 6 polyhedra is Mn-O1=1.9246 Å and Mn-O2=1.8460 Å originally. Whenthe <strong>pressure</strong> is up to 28.6 GPa, the bond distanceschange to 1.8750 Å and 1.6394 Å, respectively, whichsuggests that the torsion <strong>of</strong> MnO 6 octahedra is increased.These phenomena can be explained by theirhigh-<strong>pressure</strong> crystal structure (Fig. 5). It is wellknown that the d-spacing in a unit cell decreases withFig. 4. Relative compression <strong>of</strong> SrMnO 3, showingthe variation in relative axial ratios as afunction <strong>of</strong> <strong>pressure</strong>.The Murnaghan equation <strong>of</strong> state (EOS) was usedto fit the <strong>pressure</strong>-volume (P -V ) data, where V 0 , K 298and K ′ 0are the volume per unit cell, the bulk modulusand its <strong>pressure</strong> derivative at zero <strong>pressure</strong>, respectively.The isothermal bulk modulus K 298 =266(4)
No. 5 LIU Ying-Xin et al: <strong>High</strong> <strong>pressure</strong> X-<strong>ray</strong> <strong>diffraction</strong> <strong>study</strong> <strong>of</strong> SrMnO 3 <strong>perovskite</strong> 517Table 2.Cell parameters <strong>of</strong> SrMnO 3 as a function <strong>of</strong> <strong>pressure</strong>.P /GPa a/Å c/Å V /Å 3 R p(%) wR p(%)0.0001 5.4426(8) 9.0793(16) 232.9(1) 2.95 5.501.1 5.4345(13) 9.0754(22) 232.1(1) 4.34 7.072.1 5.4221(16) 9.0634(28) 230.8(2) 3.83 5.563.0 5.4161(20) 9.0542(36) 230.0(2) 3.99 5.715.5 5.4072(21) 9.0314(36) 228.7(2) 2.98 4.566.1 5.3964(20) 9.0207(34) 227.5(2) 2.89 4.337.6 5.3884(20) 9.0083(35) 226.5(2) 3.18 4.798.6 5.3848(20) 8.9956(36) 225.9(2) 3.47 5.079.5 5.3797(17) 8.9942(31) 225.4(2) 3.06 4.5510.5 5.3751(16) 8.9860(30) 224.8(2) 3.06 4.5111.3 5.3720(16) 8.9832(28) 224.5(2) 2.99 4.4513.6 5.3560(19) 8.9812(34) 223.1(2) 2.72 3.9914.5 5.3516(51) 8.9755(83) 222.6(5) 2.63 3.7816.3 5.3373(20) 8.9547(36) 220.9(2) 2.24 3.9017.7 5.3245(20) 8.9322(35) 219.3(2) 2.16 3.1718.7 5.3174(23) 8.9237(41) 218.5(2) 2.11 3.0720.7 5.3087(27) 8.9157(48) 217.6(3) 2.24 3.2224.1 5.2846(27) 8.8801(47) 214.8(3) 1.87 2.8327.1 5.2785(27) 8.8721(48) 214.1(3) 1.88 2.7828.6 5.2688(31) 8.8592(56) 212.8(3) 1.87 2.78Note: the numbers in parentheses are the estimated standard deviation in units <strong>of</strong> the last digit(s). R p and wR p are theexpected pr<strong>of</strong>ile R-factor and the weighted pr<strong>of</strong>ile R-factor in the Rietveld refinements.Fig. 5.Schematic structure <strong>of</strong> SrMnO 3 (a) and MnO 6 octahedra (b) at 28.6 GPa.GPa and V 0 = 232.9(1)Å 3 are obtained (Fig. 6) Here,we fixed K ′ =4, which is a commonly accepted valuefor silicates and oxides [17].In the literature, only Søndenå et al. [1] studiedthe P -V EOS <strong>of</strong> SrMnO 3 and gave K 298 =126GPa (calculated result) and 136 GPa (experimentalresult), which are lower than the value reportedhere. The K 298 =177 GPa obtained by Wu [11] isalso lower than our data. After comprehensive comparisonwith previous studies, it is assumed that thedifference in the isothermal bulk modulus might betriggered by the following factors. On the one hand,the cell parameters that we calculated under ambientconditions are smaller than others, especially thecell parameters a=5.489 Å and c=9.114 Å obtainedby Søndenå [1]. On the other hand, the <strong>pressure</strong>transmittingmedium and <strong>pressure</strong> gauge used in ourexperiments are different from those used by Søndenå(nitrogen as <strong>pressure</strong>-transmitting medium) [1] andWu (Pt powder as <strong>pressure</strong> gauge) [11]. Furthermore,the <strong>pressure</strong> we achieved may be higher thanthe actual <strong>pressure</strong> due to the <strong>pressure</strong> gradient inthe sample chamber, which was caused by the unsatisfactoryposition <strong>of</strong> the ruby chip. Thus, all <strong>of</strong> thesefactors might cause the difference between the EOSparameters in this <strong>study</strong> and the reported ones in the