Indonesia Health Profile 2010
Indonesia Health Profile 2010
Indonesia Health Profile 2010
- No tags were found...

Create successful ePaper yourself
Turn your PDF publications into a flip-book with our unique Google optimized e-Paper software.
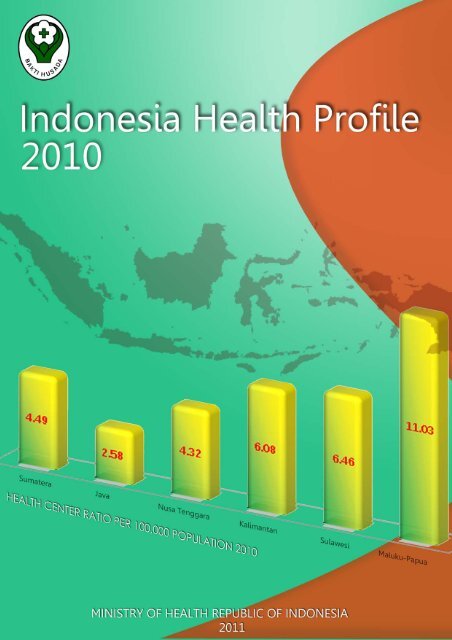
351.770212IndIINDONESIA HEALTH PROFILE<strong>2010</strong>MINISTRY OF HEALTH REPUBLIC OF INDONESIA2011
Catalog in Publishing Ministry of <strong>Health</strong> RI351.770.212Ind <strong>Indonesia</strong>. Ministry of <strong>Health</strong>. Center for Data and InformationI <strong>Indonesia</strong> <strong>Health</strong> <strong>Profile</strong> <strong>2010</strong>, -- Jakarta :Ministry of <strong>Health</strong> RI. 2011ISBN 978-602-8937-89-41. Title I. HEALTH STATISTICSThis book is published byMinistry of <strong>Health</strong> Republic of <strong>Indonesia</strong>Jalan HR. Rasuna Said Blok X-5 Kav 4-9, Jakarta 12950Phone no: 62-21-5229590, 5221432, 5277169Fax no: 62-21-5203874E-mail: statkes@depkes .go.idWeb site: http://www.depkes.go.id________________________________________________________________________
EDITOR OF BOARDAdvisordr. Ratna Rosita, MPHMGeneral Secretary Ministry of <strong>Health</strong> RIChiefdr. Jane SoepardiCenter for Data and InformationEditorDra. Rahmaniar Brahim, Apt, MKesdrg. Vensya Sitohang, M.EpidIskandar Zulkarnaen, SKM, M.KesMembersSunaryadi, SKM,MKes; Nuning Kurniasih, S.Si, Apt, MSi;Marlina Indah Susanti, SKM; Supriyono Pangribowo, SKM; Istiqomah, SS;Athi Susilowati Rois, SKM; Budi Prihantoro, S.Si ; Margiyono, SKom;Doni Hadhi Kurnianto, SKom; B.B. Sigit;Muslichatul Hidayah, Hanna Endang Wahyuni; Endang Kustanti;Sondang Tambunan; Hellena Maslinda; SininContributorsBiro Perencanaan dan Anggaran; Biro Keuangan dan Perlengkapan;Pusat Penanggulangan Krisis; Pusat Pembiayaan dan Jaminan Kesehatan;Biro Kepegawaian; Set. Ditjen Bina Gizi dan KIA; Dit. Bina Gizi; Dit Bina Kesehatan Ibu;Dit Bina Kesehatan Anak; Set. Ditjen Bina Upaya Kesehatan; Set. Ditjen PengendalianPenyakit dan Penyehatan Lingkungan; Dit. Pengendalian Penyakit Menular Langsung;Dit. Pengendalian Penyakit Bersumber Binatang; Dit. Surveilans Imunisasi dan Karantina;Set. Ditjen Bina Kefarmasian dan Alat Kesehatan; Set. Badan Penelitian dan PengembanganKesehatan; Set. Badan PPSDM Kesehatan.
<strong>Indonesia</strong> <strong>Health</strong> <strong>Profile</strong> is one tool that can be used to report the results ofmonitoring and evaluation of health achievement of development results, includingthe performance of the implementation of minimum service standards in the healthand achievement of the Millennium Development Goals indicators in health, as well asthe various efforts related to health development held across sectors such as BPSStatistics <strong>Indonesia</strong> and National Population and Family Planning.<strong>Health</strong> profile, both District/Municipality <strong>Health</strong> <strong>Profile</strong>, Province <strong>Health</strong><strong>Profile</strong> and <strong>Indonesia</strong> <strong>Health</strong> <strong>Profile</strong> present health data/information which relativelycomplete, including health status, health efforts, health resources, and general dataand health‐related environment data. Therefore, the preparation of the health profileshould be observed and where possible use a good quality data. The data used tocompile <strong>Indonesia</strong> <strong>Health</strong> <strong>Profile</strong> is sourced from the Provincial <strong>Health</strong> <strong>Profile</strong>, areport from the unit manager of health development programs, inter‐related sectors,such as Riskesdas survey results, and other data sources. Data presented at the<strong>Indonesia</strong> <strong>Health</strong> <strong>Profile</strong> can be used to compare the state of health developmentbetween one province to another province, then a comparison of health developmentin <strong>Indonesia</strong> with several countries in Southeast Asia and other member countries ofSEARO. With the publication of <strong>Indonesia</strong> <strong>Health</strong> <strong>Profile</strong>, it is expected thatcomparison of health development, both between provinces and <strong>Indonesia</strong> with otherSoutheast Asian countries can be clearly defined.The book is conceived and strived rising faster than in previous years. There isan increasing awareness of the Provincial <strong>Health</strong> <strong>Profile</strong>s managers and programmanagers in the Ministry of <strong>Health</strong>, so that the preparation of <strong>Indonesia</strong> <strong>Health</strong><strong>Profile</strong> can be completed in a relatively fast. Although the Technical Guidelines forpreparation of District/Municipality <strong>Health</strong> <strong>Profile</strong>s on responsive gender has beencirculated since the end of <strong>2010</strong>, but the availability of data from the data source havenot be compiled properly, so not all data are presented in the form of annexesaccording to responsive gender‐based data from technical guidelines of responsivegender. With the availability of health data profiles which are gender responsive, thatis expected to identify the presence or absence and amount of gap on the conditions,needs and problems faced by men and women in terms of access, participation,control, and health benefits in the health development field.i
This <strong>Indonesia</strong> <strong>Health</strong> <strong>Profile</strong> is presented in printed and soft copy (CD) andalso can be downloaded at the website www.depkes.go.id, making it easier for usersof <strong>Indonesia</strong> <strong>Health</strong> <strong>Profile</strong> to get it. Hopefully this publication can be useful to allparties, including government, profession organizations, private and public.We thank you all those who have contributed in the preparation of <strong>Indonesia</strong><strong>Health</strong> <strong>Profile</strong> <strong>2010</strong>.Jakarta, June 2011Center for Data and Informationdr. Jane SoepardiNIP. 195809231983112001ii
I warmly welcome for the publication of "<strong>Indonesia</strong> <strong>Health</strong> <strong>Profile</strong> <strong>2010</strong>" fasterwhen compared to previous years. Although there found many obstacles and barriersand a lot of challenges in the process of data collection and health information, finallyCenter for Data and Information managed to collect data year <strong>2010</strong> and compile themin the form of "<strong>Indonesia</strong> <strong>Health</strong> <strong>Profile</strong> <strong>2010</strong>".There have been many efforts doing by Center for Data and Information sothat data can be collected quickly and have high data quality. While these efforts havenot achieved maximum results, but still attempted to present it better and faster thanin previous years. Challenges and constraints in the provision of data and timelyinformation is quite a lot, so that data and information from every province andprogram managers in the Ministry of <strong>Health</strong> and related cross‐sector still can notcompletely filled. With the publication of "<strong>Indonesia</strong> <strong>Health</strong> <strong>Profile</strong> <strong>2010</strong>", I hope willbe useful for various parties, both government institutions, private institutions,professional organizations, students and other community groups in getting the dataand health information. <strong>Health</strong> profile is also expected to be used as material forevaluation of health development programs, both at central and regional levels.On this occasion I express gratitude and highest appreciation to all parties,especially to Center for Data and Information which has been a coordinator in thepreparation of <strong>Indonesia</strong> <strong>Health</strong> <strong>Profile</strong>. A big thank you also goes to the contributorsof data in the central, local government and inter‐related sectors in compiling<strong>Indonesia</strong> <strong>Health</strong> <strong>Profile</strong>. My hope that <strong>Indonesia</strong> <strong>Health</strong> <strong>Profile</strong> for years upcomingmay rise faster and higher quality.Jakarta, June 2011General SecretaryMinistry of <strong>Health</strong>dr. Ratna Rosita, MPHMNIP. 195212051980032001iii
FOREWORDACKNOWLEDGEMENT OF GENERAL SECRETARYLIST OF CONTENTLIST OF ANNEXESiiiivviiCHAPTER I INTRODUCTION 1CHAPTER II GENERAL DESCRIPTION AND PEOPLE BEHAVIOR 7A. Demographic Situation 9B. Economy Situation 16C. Environmental <strong>Health</strong> Situation 23D. People Behavior Situation 27CHAPTER III HEALTH STATUS SITUATION 33A. Mortality 35B. Morbidity 40CHAPTER IV HEALTH EFFORT SITUATION 69A. Primary <strong>Health</strong> Care 71B. Referral <strong>Health</strong> Care 96C. Disease Control and Prevention 100D. Community Nutrition Improvement 115E. <strong>Health</strong> Care in Disaster Situation 125CHAPTER V HEALTH RESOURCE SITUATION 127A. <strong>Health</strong> Facility 129B. <strong>Health</strong> Personnel 145C. <strong>Health</strong> Budgetting 152CHAPTER VI COMPARISON BETWEEN INDONESIA WITH ASEAN AND SEAROCOUNTRIES 155A. Demographic 157B. <strong>Health</strong> Status 164C. <strong>Health</strong> Effort 173v
BIBLIOGRAPHY 179ANNEXES***vi
Annex 2.1 Distribution of Government Administration by Province, <strong>2010</strong>Annex 2.2 Total Population by Sex and Sex Ratio by Province, <strong>2010</strong>Annex 2.3 Total Population by Sex and Age Groups, <strong>2010</strong>Annex 2.4 Population Growth Rate by Province, 1971 ‐ <strong>2010</strong>Annex 2.5 Mainland Area, Total Population and Population Density byProvince, <strong>2010</strong>Annex 2.6 Number of Population by Sex, Age Group and Dependency Ratioby Province, <strong>2010</strong>Annex 2.7 Number and Percentage of Underdeveloped Districts by Province,2006 ‐ <strong>2010</strong>Annex 2.8 38 Districts as Priority and Very Priority Area in Border and OuterIslands Region in <strong>Indonesia</strong>, <strong>2010</strong>Annex 2.9 Poverty Line of Poor People by Province and Area, March, <strong>2010</strong>Annex 2.10 Number and Percentage of Poor People by Province and Area,2008 ‐ <strong>2010</strong>Annex 2.11 Percentage of Households with Physical Quality of Drinking Waterby Province in <strong>Indonesia</strong>, Riskesdas <strong>2010</strong>Annex 2.12 Percentage of Households by Source of Clean Water Facilities forDomestic Purpose by Province in <strong>Indonesia</strong>, Riskesdas <strong>2010</strong>Annex 2.13 Percentage of Households by Source of Drinking Water Facilitiesfor Domestic Purpose by Province in <strong>Indonesia</strong>, Riskesdas <strong>2010</strong>Annex 2.14 Percentage of Households for Access to Quality Drinking Water byProvince in <strong>Indonesia</strong>, Riskesdas <strong>2010</strong>Annex 2.15 Percentage of Households by Access to Drinking Water byProvince in <strong>Indonesia</strong>, Riskesdas <strong>2010</strong>Annex 2.16 Percentage of Households by Number of Water Usage(Person/Day) by Province in <strong>Indonesia</strong>, Riskesdas <strong>2010</strong>Annex 2.17 Percentage of Households with Toilet Facility by Province in<strong>Indonesia</strong>, Riskesdas <strong>2010</strong>Annex 2.18 Percentage of Households by Type of Closet Facility by Province in<strong>Indonesia</strong>, Riskesdas <strong>2010</strong>Annex 2.19 Percentage of Households by the End of Feces Disposal byProvince in <strong>Indonesia</strong>, Riskesdas <strong>2010</strong>Annex 2.20 Percentage of Households by Access to Proper of Waste Disposalin Accordance MDGs by Province in <strong>Indonesia</strong>, Riskesdas <strong>2010</strong>Annex 2.21 Percentage of Households by Way of Defecation in Accordancewith JMP WHO‐UNICEF 2008 by Province in <strong>Indonesia</strong>, Riskesdas<strong>2010</strong>vii
Annex 2.22 Percentage of Households by <strong>Health</strong>y Houses Criteria by Provincein <strong>Indonesia</strong>, Riskesdas <strong>2010</strong>Annex 2.23 Prevalence of Population 15 Years of Age and Over, Smoking andNot Smoking by Province in <strong>Indonesia</strong>, Riskesdas <strong>2010</strong>Annex 2.24 Prevalence of Smokers 15 Years of Age and Over by First Smokingor Chewing Tobacco by Province , Riskesdas <strong>2010</strong>Annex 2.25 Percentage of Households by Waste Handling Criteria by Provincein <strong>Indonesia</strong>, Riskesdas <strong>2010</strong>Annex 2.26 Percentage of Women Aged 10‐59 Years by Age in First Marriageby Province in <strong>Indonesia</strong>, Riskesdas <strong>2010</strong>Annex 2.27 Percentage of Marriage Women Aged 10 ‐ 59 Years by Number ofChildren Birth and Province in <strong>Indonesia</strong>, Riskesdas <strong>2010</strong>Annex 3.1 Estimation of Infant Mortality Rate, Underfive Mortality Rate(UMR) in 2007 and Life Expectancy Rate by Province, 2009Annex 3.2 Human Development Index and Component by Province, 2008‐2009Annex 3.3 10 Main Diseases of Hospital Inpatients, <strong>2010</strong>Annex 3.4 10 Main Diseases of Hospital Outpatients, <strong>2010</strong>Annex 3.5 Prevalence of Underfive Nutritional Status Based on Weight perAge by Province, <strong>2010</strong>Annex 3.6 Prevalence of Underfive Nutritional Status Based on Height perAge by Province, <strong>2010</strong>Annex 3.7 Prevalence of Underfive Nutritional Status Based on Weight perHeight by Province, <strong>2010</strong>Annex 3.8 Prevalence of Underfive Nutritional Status Based on Height perAge and Weight per Height by Province, <strong>2010</strong>Annex 3.9 Prevalence of Adult Nutritional Status (>18 Years of Age) Basedon Body Mass Index (BMI) by Province, <strong>2010</strong>Annex 3.10 Number of Cases and Morbidity of Malaria by Province, <strong>2010</strong>Annex 3.11 Annual Parasite Insidence (API) of Malaria by Province on 2007‐<strong>2010</strong>Annex 3.12 Period Prevalence of Malaria in One Last Month by Diagnosis andProvince, <strong>2010</strong>Annex 3.13 Case Detection Coverage of Pulmonary TB by Province, <strong>2010</strong>Annex 3.14 TB Acid Flaccid Bacil (AFB) Positive New Cases by Sex andProvince, <strong>2010</strong>Annex 3.15 TB AFB Positive New Cases by Age Group, Sex, and Province, <strong>2010</strong>Annex 3.16 TB AFB Positive, Cured, and Complete Treatment and SuccessRate (SR) by Province, 2009viii
Annex 3.17 TB Period Prevalence (D) and Suspect TB Period Prevalence (G)on > 15 Years of Age Population by Province, Riskesdas <strong>2010</strong>Annex 3.18 AIDS New Cases, AIDS Cumulative Cases, Death Cases, and CaseRate AIDS per 100,000 Population by Province up to December,<strong>2010</strong>Annex 3.19 AIDS Cumulative Cases per Quarter by Province, <strong>2010</strong>Annex 3.20 Number of Cases and Percentage of AIDS on Injecting Drug Users(IDU) by Province up to December <strong>2010</strong>Annex 3.21 Number of Underfive Pneumonie Cases by Province, <strong>2010</strong>Annex 3.22 Leprosy New Cases, Case Detection Rate (CDR), Proportion ofDeformity, Cases on Children, and Women by Province, <strong>2010</strong>Annex 3.23 Number of Tetanus Neonatorum Cases and Risk Factors byProvince, <strong>2010</strong>Annex 3.24 Number of Measles Cases by Month and Province, <strong>2010</strong>Annex 3.25 Number of Measles Cases by Age Group and Province, <strong>2010</strong>Annex 3.26 Number of Cases, Deaths, and Incidence Rate of Measles byProvince, <strong>2010</strong>Annex 3.27 Outbreak Frequency and Number of Cases on Measles Outbreakby Province, <strong>2010</strong>Annex 3.28 Measles Outbreak Based on Laboratory Confirmation by Province,<strong>2010</strong>Annex 3.29 Number of Diphteria Cases by Age Group and Province, <strong>2010</strong>Annex 3.30 Number of Diptheria Cases per Month by Province, <strong>2010</strong>Annex 3.31 Number of AFP Cases and Non Polio AFP Rate by Province, <strong>2010</strong>Annex 3.32 Number of Dengue Haemorrhagic Fever (DHF) Cases, Deaths, CaseFatality Rate (%), and Incidence Rate per by Province, 2006 ‐<strong>2010</strong>Annex 3.33 Number of Districts/Municipalities Infected by DHF and Province,2006 ‐ <strong>2010</strong>Annex 3.34 Diarrhea Outbreaks by Province, 2006 ‐ <strong>2010</strong>Annex 3.35 Number of Chikungunya Cases by Province, <strong>2010</strong>Annex 3.36 Rabies Cases in <strong>Indonesia</strong>, 2008‐<strong>2010</strong>Annex 3.37 Number of Filariasis Cases by Province, 2006 ‐ <strong>2010</strong>Annex 3.38 Pest Situation by Province, <strong>2010</strong>Annex 3.39 Number of Leptospyrosis Cases, Deaths, and Case Fatality Rate(CFR) by Province, 2004 ‐ <strong>2010</strong>Annex 3.40 Number of Antrax Cases On Human by Province, 2006 ‐ <strong>2010</strong>Annex 4.1 Number of Avian Influenza Cases, Deaths, and Case Fatality Rate(%) by Province, 2005 ‐ <strong>2010</strong>ix
Annex 4.2 Percentage of Women Aged 10‐59 Years by Pregnant Women CareCoverage (K1 and K4) by Last Pregnancy per Province, Riskesdas<strong>2010</strong>Annex 4.3 Percentage of Women Age 10‐59 Years for Last Child Pregnancyby Personnel <strong>Health</strong> and Province, Riskesdas <strong>2010</strong>Annex 4.4 Percentage of Women Age 10‐59 Years Had Cesarian Section forLast Child in Last Five Years Period by Province, Riskesdas <strong>2010</strong>Annex 4.5 Coverage of New Family Planning and Active Family PlanningAcceptors by Province, <strong>2010</strong>Annex 4.6 Percentage of New Family Planning Acceptors by ContraceptionMethod and Province, <strong>2010</strong>Annex 4.7 Proportion of New Family Planning Acceptors by Practice Place,<strong>2010</strong>Annex 4.8 Percentage of Active Family Planning Acceptors by ContraceptionMethod and Province, <strong>2010</strong>Annex 4.9 Percentage of Women That Married in Age 10‐49 Years by FamilyPlanning Using Status, Riskesdas <strong>2010</strong>Annex 4.10 Coverage of Neonates Care with Complication and Obstetric Carewith Complication by Province, <strong>2010</strong>Annex 4.11 Coverage of Neonates Visits by Province, <strong>2010</strong>Annex 4.12 Percentage of Neonates Visit in Underfive Age by Province,Riskesdas, <strong>2010</strong>Annex 4.13 Percentage of Complete Neonates Visit (KN1, KN2, KN3) inUnderfive Age by Province, Riskesdas <strong>2010</strong>Annex 4.14 Coverage of Infant and Underfive <strong>Health</strong> Care by Province, <strong>2010</strong>Annex 4.15 Coverage of Primary School Performing for Embracing 1 st ClassStudents by Province, <strong>2010</strong>Annex 4.16 Coverage of Underfive Weighted by Province, <strong>2010</strong>Annex 4.17 Percentage of Weighing Frequency of Children Age 6‐59 MonthsDuring Last Six Months by Province, Riskesdas <strong>2010</strong>Annex 4.18 Coverage of Exclusive Breast Feeding for Infant Age 0‐5 Monthsby Province, 2009Annex 4.19 Percentage of Children Age 0‐23 Months Who Have/Had BeenBreastfeeding by Province, Riskesdas <strong>2010</strong>Annex 4.20 Coverage of Vitamin A Capsule Distribution for Underfive andPostpartum Mothers by Province, <strong>2010</strong>Annex 4.21 Coverage of 90 Iron Tablet Distribution (Fe3) for PregnantWomen by Province, <strong>2010</strong>Annex 4.22 Percentage of Children Age 6‐59 Months Having Vitamin ACapsule During Last Six Months by Province, Riskesdas <strong>2010</strong>x
Annex 4.23 Percentage of Population by Energy Sufficiency and ProteinConsumption, Riskesdas <strong>2010</strong>Annex 4.24 Coverage of Universal Child Immunization (UCI) Village byProvince, 2008 ‐ <strong>2010</strong>Annex 4.25 Coverage of Infants Basic Immunization by Province, <strong>2010</strong>Annex 4.26 Percentage of Children Age 12‐23 Months Getting BasicImmunization by Province, Riskesdas <strong>2010</strong>Annex 4.27 Percentage of Children Age 12‐23 Months Getting Complete BasicImmunization by Province, Riskesdas <strong>2010</strong>Annex 4.28 Drop Out Rate of Immunization Coverage DPT‐HB1 ‐ Measles inInfants by Province, 2007 – <strong>2010</strong>Annex 4.29 Coverage of Students Immunization by Province, <strong>2010</strong>Annex 4.30 Coverage of Tetanus Toxoid Immunization in Pregnant Women byProvince, <strong>2010</strong>Annex 4.31 Percentage of Mother Getting Tetanus Toxoid Injection DuringLast Children Pregnancy by Province, Riskesdas <strong>2010</strong>Annex 4.32 Coverage of Tetanus Toxoid Immunization in Productive AgeWomen by Province, <strong>2010</strong>Annex 4.33 Coverage of Pulmonary TB AFB Positive, Healed, CompleteMedication and Succes Rate (After TB Medication Year 2009) byProvince, <strong>2010</strong>Annex 4.34 Percentage of Tuberculosis Patient Had Finished Treatments withAnti Tuberculosis Drug by Province, Riskesdas <strong>2010</strong>Annex 4.35 Number of Underfives Pneumonia Cases by Province, <strong>2010</strong>Annex 4.36 Number of Inpatient Visit in Hospital by Province, <strong>2010</strong>Annex 4.37 Indicator of General Hospital Care of MOH and Local Governmentby Province, 2008 ‐ <strong>2010</strong>Annex 4.38 Examination of Dental and Oral <strong>Health</strong> In Local Government andMinistry of <strong>Health</strong> Public Hospital Services by Province, <strong>2010</strong>Annex 4.39 Jamkesmas (Community <strong>Health</strong> Insurance) Participant Visits in<strong>Health</strong> Center, <strong>2010</strong>Annex 4.40 Number of Advance Level Outpatient (RJTL) Visit of JamkesmasParticipants, <strong>2010</strong>Annex 4.41 Number of Advance Level Inpatient (RITL) Case of JamkesmasParticipants, <strong>2010</strong>Annex 4.42 Recapitulation of Disaster by Type and Number of Victims, <strong>2010</strong>Annex 4.43 Percentage of Drug and Vaccine Availability in <strong>Indonesia</strong>, June2011Annex 4.44 Percentage of Drug and Vaccine Availability in <strong>Indonesia</strong>, June2011xi
Annex 5.1 Number of <strong>Health</strong> Center and Its Ratio to Population by Province,2006 ‐ <strong>2010</strong>Annex 5.2 Number of <strong>Health</strong> Center with Bed and <strong>Health</strong> Center without Bedby Province, 2006 – <strong>2010</strong>Annex 5.3 Number of Hospital in <strong>Indonesia</strong> by Management and Province,<strong>2010</strong>Annex 5.4 Number of Hospital and Bed by Management, 2006 ‐ <strong>2010</strong>Annex 5.5 Number of General Hospital and Bed of MOH/GovernmentOwnership by Hospital Class and Province, <strong>2010</strong>Annex 5.6 Number of Specific Hospital and Bed by Type of Hospital, 2006 ‐<strong>2010</strong>Annex 5.7 Number of Bed in General Hospital and Specific Hospital by BedClass and Province, 2009Annex 5.8 Number of Production Facility in Pharmaceutical and MedicalDevice by Province, 2008‐<strong>2010</strong>Annex 5.9 Number of Distribution Facility in Pharmaceuticals and MedicalDevice by Province, 2008‐<strong>2010</strong>Annex 5.10 Number of <strong>Health</strong> Effort Community Based (UKBM) by ProvinceIn <strong>Indonesia</strong>, 2009Annex 5.11 Number of <strong>Health</strong> Polytechnic Institution (Poltekkes) by Programand Province, <strong>2010</strong>Annex 5.12 Number of Non <strong>Health</strong> Polytechnic Institution (NonPoltekkes) byStudy Program and Province, <strong>2010</strong>Annex 5.13 Number of Academic Field/Study Program of <strong>Health</strong> Polytechnic(Poltekkes) by Accreditation and Strata, <strong>2010</strong>Annex 5.14 Number of Non Polytechnic Institution (NonPoltekkes) byAccreditation and Strata, <strong>2010</strong>Annex 5.15 Number of <strong>Health</strong> Personnel Institution of Non‐<strong>Health</strong> Polytechnicby Ownership, <strong>2010</strong>Annex 5.16 Recapitulation of Poltekkes Student by Type of <strong>Health</strong>Personnelacademic Year <strong>2010</strong>/2011Annex 5.17 Recapitulation of Non Poltekkes Student by Type of <strong>Health</strong>Personnel Academic Year <strong>2010</strong>/2011Annex 5.18 Recapitulation of Student of Diploma IV Program by Type ofEducation Institution, 2007‐ 2009Annex 5.19 Graduation of Diknakes Poltekkes and Non Poltekkes by Type of<strong>Health</strong> Personnel, <strong>2010</strong>Annex 5.20 Number of Poltekkes Graduated by Academic Field/StudyProgram from <strong>Health</strong> Personnel Institution in <strong>Indonesia</strong> AcademicYear <strong>2010</strong>/2011xii
Annex 5.21 Recapitulation of Graduation from Non Poltekkes Institution in<strong>Indonesia</strong> by Type and Province Academic Year <strong>2010</strong>/2011Annex 5.22 Recapitulation of <strong>Health</strong> Manpower by Province, December <strong>2010</strong>Annex 5.23 Number of Human Resource in <strong>Health</strong> Center by Type andProvince, <strong>2010</strong>Annex 5.24 Ratio of Physician, Dentist, Nurse and Midwife to Number of<strong>Health</strong> Center by Province, <strong>2010</strong>Annex 5.25 Recapitulation of Human Resource of Government Hospital byType and Province, <strong>2010</strong>Annex 5.26 Recapitulation of Physician as Active Non Permanent Employee,<strong>2010</strong>Annex 5.27 Recapitulation of Dentist As Active Non Permanent Employee,<strong>2010</strong>Annex 5.28 Recapitulation of Midwife As Active Non Permanent Employee,<strong>2010</strong>Annex 5.29 Recapitulation of Physician Recruitment As Active Non PermanentEmployee, <strong>2010</strong>Annex 5.30 Recapitulation of Dentist Recruitment As Active Non PermanentEmployee, <strong>2010</strong>Annex 5.31 Recapitulation of Midwife Recruitment As Active Non PermanentEmployee, <strong>2010</strong>Annex 5.32 Active Physician/Dentist As Non Permanent Employee in Ministryof <strong>Health</strong> until December <strong>2010</strong>Annex 5.33 Recapitulation of Physician Recruitment As Non PermanentEmployee, <strong>2010</strong>Annex 5.34 Recapitulation of Dentist Recruitment As Non PermanentEmployee, <strong>2010</strong>Annex 5.35 Distribution of Involved Level from <strong>Health</strong> Education Institutionin <strong>Indonesia</strong> in Training and Education Institution, 2009Annex 5.36 Distribution of Widyaiswara from Training and EducationInstitution in <strong>Indonesia</strong> by Age Group, 2009Annex 5.37 Distribution of Training Frequency and Number of Participants in<strong>Health</strong> Training and Education In <strong>Indonesia</strong> by Type of Trainingand Education Institution, 2009Annex 5.38 Allocation and Realization Ministry of <strong>Health</strong> by Echelon I, <strong>2010</strong>Annex 5.39 Data of <strong>Health</strong> Insurance Participant, <strong>2010</strong>Annex 5.40 Distribution of MOH Employee in Central Office, TechnicalImplementation Unit and DPK/DPB Details by Education Strata inDecember, <strong>2010</strong>Annex 6.1 Demography in ASEAN and SEARO Member States, <strong>2010</strong>xiii
Annex 6.2 Birth Rate, Mortality Rate and Human Development Index inASEAN and SEARO Member StatesAnnex 6.3 Population Using Clean Water Source and Hygienic SanitationFacilities in ASEAN and SEARO, 2008Annex 6.4 Tuberculosis in ASEAN and SEARO States, 2008/2009Annex 6.5 Estimation of HIV/AIDs in ASEAN and SEARO States, 2009Annex 6.6 Number of Vaccine‐Preventable Diseases in ASEAN and SEAROStates, <strong>2010</strong>Annex 6.7 Basic Immunization to Infants in ASEAN and SEARO, 2009Annex 6.8 <strong>Health</strong> Efforts in ASEAN and SEARO Member States, 2000‐<strong>2010</strong>Annex 6.9 <strong>Health</strong> Expenditures in ASEAN and SEARO Member States, 2008***xiv
Ministry of <strong>Health</strong>'s vision is "<strong>Health</strong>y Communities Independent and Justice", whileMinistry of <strong>Health</strong>'s missions to achieve that vision are explained as follows:1. Improving the community health status, through community empowerment,including the private sector and civil society.2. Protecting public health by ensuring the availability of health efforts which isplenary, equitable, quality, and equitable.3. Ensure availability and equitable distribution of health resources.4. Creating a good governance.The vision and missions should be guided by the values of Ministry of <strong>Health</strong> asfollows: 1) Pro People, 2) Inclusive, 3) Responsive, 4) Efficient, and 5) Clean. In theimplementation of the Vision and Mission of the Ministry of <strong>Health</strong>, there is muchneeded data and information.According to WHO, Subsystem of Information always be in the <strong>Health</strong> Systemto support other subsystems. Other subsystems may not be able to work without thesupport of the <strong>Health</strong> Information System. In the other hand, <strong>Health</strong> InformationSystem may not work alone, but must be with the other subsystems. This is alsoreflected in National <strong>Health</strong> System 2009 (Ind: SKN 2009=Sistem Kesehatan Nasional),where there is a subsystem of Management and <strong>Health</strong> Information, whichovershadow the development of <strong>Health</strong> Information Systems.Law of the Republic of <strong>Indonesia</strong> Number 36 Year 2009 on <strong>Health</strong>, article 17paragraph 1 states that the government is responsible for the availability of access toinformation, education, and health care facilities to improve and maintain health ishighest. In addition, Article 168 states that to organize an effective and efficienthealth efforts there is needed health information system, which is done throughinformation systems and through cooperation across sectors, with further provisionswill be arranged by Government Regulation. While the government mentioned inArticle 169 provides convenience to the public to obtain access to health informationin an effort to improve community health status.One output of the implementation of national health information system is the<strong>Indonesia</strong> <strong>Health</strong> <strong>Profile</strong>, which is relatively complete one packet presentation ofhealth data/information, contains data/information on health status, health effort,health resources, and other relevant data/information, as well as published every3
year. In line with the preparation of <strong>Indonesia</strong> <strong>Health</strong> <strong>Profile</strong>, provincial health officehave also been prepare provincial health profile, and district/municipality healthoffice compose district/municipal health profile. In the future, utilizing technologiesof information and communication are evolving rapidly, the preparation of the healthprofile is expected to be held in stages. Provincial health profile is arranged based ondistrict/municipal health profile and health development results that held by theprovince, including the results of inter‐related sectors; and <strong>Indonesia</strong> <strong>Health</strong> <strong>Profile</strong> isorganized by the provincial health profiles and the results of health developmentorganized centers, including the results of cross‐cutting activities related to nationallevel.<strong>Indonesia</strong> <strong>Health</strong> <strong>Profile</strong>, provincial health profile, district/municipalicityhealth profile are expected to be important media to monitor and evaluate the resultsof the implementation of health development in the central and local levels. For thepreparation of qualified health profile, which can be published faster, present datacomplete, accurate, consistent, and as needed into our collective expectations.<strong>Indonesia</strong> <strong>Health</strong> <strong>Profile</strong> <strong>2010</strong> is based on data/information obtained from<strong>Indonesia</strong> regions of health office, program managers within the Ministry of <strong>Health</strong>,inter‐related sectors, as well as other source of data/information, including theagencies/institutions/ national and international health organizations.<strong>Indonesia</strong> <strong>Health</strong> <strong>Profile</strong> <strong>2010</strong> consists of 6 (six) chapters, namely:Chapter I ‐ Introduction. This chapter presents the publication background of<strong>Indonesia</strong> <strong>Health</strong> <strong>Profile</strong> <strong>2010</strong> and its systematic presentation.Chapter II ‐ General Description and People Behavior. This chapter presents thegeneral overview, including: demography, economy, and the physical environment;and people behavior related to health.Chapter III ‐ <strong>Health</strong> Status Situation. This chapter contains a description of the variousindikator health status, which includes about mortality, life expectancy, morbidityand nutritional status of the community.Chapter IV ‐ <strong>Health</strong> Efforts Situation. This chapter contains a description of theobjectives of health development programs in health. The picture of health effortshave been made include the achievement of basic health services, referral health careachievement, achievement of the prevention and eradication of disease, and efforts toimprove nutrition.Chapter V ‐ <strong>Health</strong> Resource Situation. This chapter describes the development ofhealth sector resources until the year <strong>2010</strong>. Picture of the resources situationincludes on the state of health facilities, health personnel, and health financing.Chapter VI ‐ Comparison of <strong>Indonesia</strong> with member countries of ASEAN and SEARO.This chapter presents a comparison of several indicators that includes data on4
population, birth rate, mortality rate, Human Development Index, tuberculosis data,the estimated number of HIV/AIDS, infectious disease cases are preventable byimmunization, immunization coverage in infants and health efforts.***5
<strong>Indonesia</strong> is a country located in Southeast Asia, geographically between twocontinents, Asia and Australia as well as between the Indian and Pacific Ocean.Astronomically <strong>Indonesia</strong> lies between North latitude line 6 o to 11 o South latitudelines, and 95 o to 141 o east longitude line that includes the circuit of the island fromSabang to Merauke. Thus, <strong>Indonesia</strong> is at a cross position, which have significance inrelation to the economy.<strong>Indonesia</strong> is the largest archipelagic country in Southeast Asia. According todata sourced from National Coordination Board of Survey and Mapping (Ind:Bakosurtanal), the number of islands in <strong>Indonesia</strong> were 17,504 islands. The numberof islands including those in the estuary and the river, and river deltas. This strategicposition has a very extremely influence on the cultural, social, political, and economic.This fact makes <strong>Indonesia</strong> has a diversity of cultures and customs with characteristicsthat differ from each other. Diversity in those various aspects are also associated withbehavior in health aspect.In <strong>2010</strong>, <strong>Indonesia</strong> administrativelly is divided into 33 provinces, 497 districts(399 districts and 98 municipalities), 6,598 subdistricts and 75,638 villages.Distribution of administrative area in <strong>Indonesia</strong> in <strong>2010</strong> can be seen in Annex 2.1.In this chapter general description and behavior of <strong>Indonesia</strong> people in <strong>2010</strong>will be described which include: state of the population, economic situation,environmental conditions, and behaviors related to health.A. DEMOGRAPHIC SITUATIONAccording to the Population Census Year <strong>2010</strong>, number of <strong>Indonesia</strong>population was 237,641,326 people, consisted of 119,630,913 males and 118,010,413females (Annex 2.2). Comparing to Population Census Year 2000, number ofpopulation was 205,132,458 people, so that number of <strong>Indonesia</strong> population hasincreased about 32.5 million people with population growth rate per year 1.49%.Based on provincial level, population number has increased with various populationgrowth rate. The lowest population growth rate 0.37% was in Central Java and thehighest population growth rate 5.46% was in Papua.9
Population growth is the change in the number of population in a certain areaat a given time than ever before. The rate of population growth is very useful toestimate the number of population in the future. Population growth rate in <strong>Indonesia</strong>has increased over the last 10 years, although the period of 20 years before the ratewas smaller. The rate of population growth in <strong>Indonesia</strong> since the Population CensusYear 1971 to Population Census Year <strong>2010</strong> can be seen in Annex 2.4.GRAPH 2.1POPULATION GROWTH RATE OF INDONESIA, 1971 <strong>2010</strong>(% per Year)Source: BPS-Statistics <strong>Indonesia</strong>, 2011Trend in population growth rate is presented in Graph 2.1. Population growthrate per year during 1971‐1980 at 2.31% and decreased sharply over a span of years1990‐2000. Decrease in the rate of population growth is possible because of thesuccess of family planning program, announced by the government at that time.The results of population census in <strong>2010</strong> showed that the rate of populationgrowth period from 2000 to <strong>2010</strong> of 1.49% per year, increased when compared withthe population growth rate in 1990‐2000. The higher population growth rate led to apopulation that more and more in the future.Based on the population growth rate as mentioned above, the population of<strong>Indonesia</strong> has increased more and more as seen in Graph 2.2. The results ofpopulation census in <strong>2010</strong> <strong>Indonesia</strong>'s population reached 237,641,326 people,greatly increased when compared with 1990 and 2000. The increasing number ofpeople in <strong>Indonesia</strong> who constantly if not controlled will bring unfavorable impact,among them the burden of development, including development in health.10
GRAPH 2.2TREND OF TOTAL POPULATION IN INDONESIA, 1961 <strong>2010</strong>(in million)Source: BPS-Statistics <strong>Indonesia</strong>, 2011Sex Ratio is the ratio of the number of male population per 100 femalepopulation. Data on sex ratio is useful for the development of gender‐orienteddevelopment planning, especially in connection with the construction of the balanceof men and women fairly.Nationally, the sex ratio of population of <strong>Indonesia</strong> in <strong>2010</strong> was 101, whichmeans the male population of one percent more than the population of women. Thisvalue means that every 100 females there were 101 males. The highest sex ratios wasin the province of Papua that was 113 and the smallest found in West Nusa Tenggarathat was 94. Graph 2.3 presents the trend of the national sex ratio since thePopulation Census 1961 to Population Census <strong>2010</strong>.GRAPH 2.3SEX RATIO TREND OF INDONESIA POPULATION1961 – <strong>2010</strong>Source: BPS-Statistics <strong>Indonesia</strong>, 201111
Age structure of population by sex can be depicted graphically in the form ofthe population pyramid. The basis of population pyramid shows the total population.Left part of the population pyramid body shows the number of male population andright part of the population pyramid body shows the number of female population byage group. Pyramid is a picture of the structure of the population consisting of youngpopulation structure, adult, and elderly. This population structure is the basis forpopulation policy, social, cultural, and economic.GRAPH 2.4PYRAMID OF INDONESIA POPULATION, <strong>2010</strong>(in million)Source: BPS-Statistics <strong>Indonesia</strong>, 2011Graph 2.4 shows that the structure of the population in <strong>Indonesia</strong> includes ayoung population structure. This can be seen from the large number of young people(0‐14 years), although the number of births has decreased when compared with fiveyears ago and life expectancy is increasing which is marked by the increasing numberof elderly. Pyramid body sweld, it indicates the number of working‐age population,especially in the age group 25‐29 years, both men and women.Based on population distribution by sex and age group we can obtain adescription of the population pyramid of <strong>Indonesia</strong> since the implementation of thePopulation Census 1961 to the Population Census in <strong>2010</strong>. <strong>Indonesia</strong>'s populationpyramid is presented in Graph 2.5.12
GRAPH 2.5PYRAMID OF INDONESIA POPULATION, 1961 – <strong>2010</strong>(in million)Source: BPS-Statistics <strong>Indonesia</strong>, 2011Pyramid Year 1961, 1971 and 1980 shows a conical pyramid. Base of thepyramid shape is widened with a sharp peak. This indicated high fertility, highmortality and life expectancy was still low. Number of babies born to live to old agewas still low. Pyramid Year 1990 began to show differences, number of births beganto decline and number of elderly population began to increase. This shows theincreasing life expectancy and the proportion of people who were born to live to oldage is increasing.Pyramid Year 1990 and 2000 has very different shape than the shape of thepyramid Year 1961 and 1971. Base of the pyramid narrows, which means thatnumber of births decreased. Top of the pyramid widens, which means that the level oflife expectancy for population and life expectancy for babies born up to age 75 yearswas higher or greater. Age structure was still at a young age. This makes the challengefor the government for the provision of educational services, health and employmentincreases.Nationally, with the total area of <strong>Indonesia</strong> 1,910,931.32 km2 so thepopulation density in <strong>2010</strong> was 124 people per km2. Level of high density was stilldominated by provinces in Java island. Province has the highest population densitywas DKI Jakarta, which were 14,440 people per km2. West Java Province was a regionwhich had the second highest population density with a density of 1,216 people per13
km2. Provinces with the highest level of third density was DI Yogyakarta by 1,102people per km2. The lowest population density in West Papua, which were only 8people per km2. Papua was a province with the second lowest population density thatwere equal to 9 people per km2, then followed by Central Kalimantan with a densityof 14 people per km2. The population and population density by province in <strong>2010</strong> canbe seen in Annex 2.5GRAPH 2.6PERCENTAGE OF AREA AND DISTRIBUTION OF INDONESIA POPULATIONBY BIG ISLANDS GROUPS, <strong>2010</strong>Source: BPS-Statistics <strong>Indonesia</strong>, 2011Related problems faced by the population distribution in <strong>Indonesia</strong> isgeographically the spread or the uneven distribution of population between Java andoutside Java. From the data on population distribution according to the island ofGraph 2.6 is known there are real disparities among the population distributionamong islands. The phenomenon of uneven distribution of the population is still afeature of demographic <strong>Indonesia</strong>. On the Island of Java, which has geographical area7%, it had 58% of the total population. Sumatra Island which cover 25% of total area,there is 21% of the total popultion, Borneo Island (Kalimantan) which covers 28% oftotal area contained only 6% of the total population, Sulawesi Island which covers10% of total area contained 7% of the total population, other islands (Nusa Tenggara,Maluku and Papua) which covers 30% of total area contained 8% of the totalpopulation.Essential indicator related to population distribution by age which is oftenused to determine the productivity of the population is Dependency Ratio.Dependency Ratio is a number that states the comparison between the number ofpeople who are not productive (age below 15 years and over 65 years) with manypeople including the productive age (aged 15‐64 years). In general, comparison of14
proportion shows the dynamics of dependency ratio between nonproductive age toproductive age. The higher dependency ratio, the higher the number ofnonproductive population were covered by population of productive age.TABLE 2.1POPULATION NUMBER AND DEPENDENCY RATIOBY SEX AND PRODUCTIVE AGE GROUP (AGE 1564)AND NON PRODUCTIVE (AGE 014 AND >65)IN INDONESIA, <strong>2010</strong>No Age Male Female Male + Female %1 Age 0 – 14 35,288,970 33,307,750 68,596,720 28.872 Age 15 – 64 78,935,732 78,046,486 156,982,218 66.053 Age > 65 5,361,028 6,619,670 11,980,698 5.044 Unknown 42,183 36,507 81,690 0.03Total 119,630,913 118,010,413 237,641,326 100.00Dependency Ratio (%) 51.50 51.16 51.33Source: BPS-Statistics <strong>Indonesia</strong>, 2011Composition of <strong>Indonesia</strong>'s population by age group is shown by Table 2.1 thatis young population (0‐14 years) of 28.87%, productive age (15‐64 years) of 66.05%,old age and elderly (≥ 65 years) of 5.04%. Thus, number of dependency ratio of<strong>Indonesia</strong>'s population in <strong>2010</strong> amounted to 51.33%. This means that 100 people in<strong>Indonesia</strong> who were still productive will bear 51 people who have not/no longerproductive. When compared between sexes, then number of dependency ratio of maleslightly larger when compared with dependency ratio of females, ie 51.50% for malesand 51.16% for females.Graph 2.7 shows dependency ratio in <strong>2010</strong> was nationally 51.33%. Provinceswith the highest dependency ratio were East Nusa Tenggara (73.23%), Maluku(67.20%) and West Sulawesi (67%). Provinces with the lowest dependency ratiowere DKI Jakarta (36.95%), Riau Island (45.72%) and DI Yogyakarta (46%).15
GRAPH 2.7DEPENDENCY RATIO BY PROVINCEIN INDONESIA, <strong>2010</strong>Source: BPS-Statistics <strong>Indonesia</strong>, 2011Details of population by age group, dependency ratio and province in <strong>2010</strong> canbe seen in Annex 2.6.B. ECONOMY SITUATIONEconomic condition is one aspect that is measured in determining the successof a country's development. <strong>Indonesia</strong>'s economy grew during the years 2006‐<strong>2010</strong>for each in the amount of 5.5% (2006), 6.3% (2007), 6.0% (2008), 4.5% (2009), and6.1% (<strong>2010</strong>).With the economic growth of 6.1% in <strong>2010</strong>, the value of Gross DomesticProduct (GDP) in <strong>2010</strong> rose by Rp 809.5 trillion. From Rp 5,613.4 trillion in 2009 toRp 6,422.9 trillion in <strong>2010</strong>. The highest growth occurred in transportation andcommunications sector, in the amount of 13.5%. The lowest growth occurred in theagricultural sector by 2.9%. While non‐oil GDP grew 6.6%.Economic growth is closely related to the work force and employmentopportunities in <strong>Indonesia</strong>. Any discussion of economic conditions need to beaccompanied by a discussion of work force and employment opportunities. Accordingto the National Work Force Survey (Ind: Sakernas), Work Force is the operationaldefinition of working age population who work or have a job but temporarily notworking. and unemployed. While Working by Sakernas definition is economic activity16
undertaken by someone with the intention of obtaining or aiding to obtain revenue orprofits, at least one hour (uninterrupted) in the past week. The activity also includesactivities that unpaid workers to help in a business or economic activity.Proportion of open unemployment of work force is useful to be benchmark forthe government in opening new jobs in the future. This figure also shows the successrate of manpower development program from year to year. Based on the publicationof data on the results of Sakernas Years 2008‐<strong>2010</strong> by BPS Statictics <strong>Indonesia</strong> therewas a decline in unemployment. This is due to increased employment in the sector ofsocial services such as carpentry services, domestic service, transportation andagriculture. Development of work force, employed population and unemployed(number and percentage) in the period of February 2008 ‐ February <strong>2010</strong> arepresented in Table 2.2.TABLE 2.2DESCRIPTION OF WORK FORCES NUMBER, WORKING PEOPLEAND OPEN UNEMPLOYMENT IN INDONESIA, 2008 – <strong>2010</strong>Feb 2008(millionpeople)Feb 2009(millionpeople)Feb <strong>2010</strong>(millionpeople)Number of work forces 111.48 113.74 115.99Number of working people 102.05 104.49 107.41Open unemployment 9.43 9.26 8.59Percentage of open unemployment (%) 8.46 8.14 7.40Source: BPS-Statistics <strong>Indonesia</strong>. 2011, National Work Force Survey (Ind: SAKERNAS) 2008‐<strong>2010</strong>Table 2.2 shows the increasing number of workforce and working population.Increasing in population has led to an increase in total work force. The increasingnumber of work forces causes limited employment opportunities due to fewer jobs.Growth of job demand is slower than work force growth. This has led to theemergence of open unemployment is quite high. The good news is the decline in thenumber of open unemployment from year to year, although unemployment is stillhigh.Interesting discussion about unemployment is unemployment by educationallevel. In Graph 2.8 can be shown that highest unemployment was the people whograduated at the high school level with percetange of 40.20%. The second highestunemployment existed in the population with junior high education level of 19.97%.The third highest unemployment rate was the population with elementary educationlevel of 16,86%. While the unemployment at university education level was 8.54%.17
GRAPH 2.8PERCENTAGE OF UNEMPLOYMENT LEVEL BY EDUCATIONIN INDONESIA, <strong>2010</strong>Source: BPS-Statistics <strong>Indonesia</strong>, 2011Economic development is expected to encourage progress, physically, socially,mentally and spiritually in all over the country, especially in areas where areclassified as underdeveloped areas. An area is considered to be underdevelopedregion due to several factors, namely: geography, natural resources, humanresources, infrastructure and facilities, disaster‐prone areas and social conflict, anddevelopment policies. Limitations of infrastructure on various areas including publichealth makes people in underdeveloped areas find it difficult to run economic andsocial activity.The smallest unit used in the disadvantaged areas of the National Strategy toAccelerate Development of Disadvantaged Regions (National Strategy of PPDT) is thearea of the district administration. By definition, disadvantaged areas are districtsthat are relatively less developed than other areas in the national scale and apopulation of relatively backward. Determination of criteria developed areas is doneby using an approach based on the calculation of the six basic criteria, namely:economy, society, human resources, infrastructure, the ability of local finance (fiscalgap), accessibility and regional characteristics, as well as by district located in thehinterland, islands (small islands and island groups), the borders between countries,disaster‐prone areas and areas prone to conflict and large parts of coastal areas.18
GRAPH 2.9PROVINCES WITH PERCENTACE OF UNDERDEVELOPED DISTRICTSIN INDONESIA, <strong>2010</strong>Source: National Strategy to Accelerate Development of Disadvantaged Regions(National Strategy of PPDT) Year 2004-2009Under that approach, then set 183 districts were categorized withunderdeveloped districts. Currently <strong>Indonesia</strong> has 19 border districts, 33 smallislands and 183 outer populated islands areas (including remote). In <strong>2010</strong> thepercentage of disadvantaged areas was 36.8% (of 497 districts/municipalities)located in 27 provinces. Province with the highest percentage of the highest numberof underdeveloped districts was in West Sulawesi, amounting to 100%, followed byEast Nusa Tenggara Papua 65.2% and 93.1%. The number and percentage of districtslagging behind by province can be seen in Annex 2.7.Based on the underdeveloped areas, there have been drawn up some prioritiesin bordered districts and outer small islands in <strong>Indonesia</strong> by the Ministry ofUnderdeveloped Area Development, Republic of <strong>Indonesia</strong>. There were 38 districtsincluded in the priorities and the very priorities that were spread across 9 provincesin <strong>Indonesia</strong>.19
TABLE 2.3NUMBER OF UNDERDEVELOPED DISTRICTS AND HEALTH CENTERSIN REMOTE, BORDER, ISLAND AREA (Ind: “DTPK”)IN INDONESIA. <strong>2010</strong>AreaNumber ofDistrictsDistrictsUnderdeveloped%<strong>Health</strong>Center<strong>Health</strong> Centers<strong>Health</strong>Center“DTPK”%Sumatera 151 46 30.5 1,946 862 44.0Java, Bali 127 9 7.1 3,524 500 14.0Kalimantan 55 16 29.1 764 275 36.0Sulawesi 73 34 46.6 911 590 65.0Papua, Maluku, NTT, NTB 91 78 85.7 870 787 90.0Total 497 183 36.8 8,015 3,014 37.6Source: DG of Community <strong>Health</strong> Care, MoH, <strong>2010</strong>Table 2.3 shows number of underdeveloped districts and type of healthcenters in <strong>Indonesia</strong> in <strong>2010</strong>. The highest percentage of area to the underdevelopeddistrict was Papua, Maluku, East Nusa Tenggara, West Nusa Tenggara with thepercentage reached 82.4%. The smallest number of underdeveloped districts werelocated in Java and Bali by the percentage of 14.4%, island of Borneo and Sumatra hadunderdeveloped district percentage by 40% and 4%. National average ofunderdeveloped districts in <strong>Indonesia</strong> was 43.5%. The amount was still quite largeand uneven spreading indicate imbalance in the development program. More detailsare presented in Annex 2.8.Poverty is also a major obstacle in fulfilling the needs of a healthy food so thatit can weaken the immune system that could affect susceptibility to developingcertain diseases. The phenomenon of poor nutrition and less often associated withpoor economic conditions if it refers to the fact that compliance with the limitationsof food can lead to malnutrition, kwashiorkor, vitamin deficiency diseases such asXeropthalmia, Scorbut, and Beriberi.Poverty is understood as an economic inability to meet basic needs ofpopulation and non‐food meals are measured from the expenditure. Povertymeasurement is done by setting the value of the minimum requirement standard forboth food and non food that must be met for someone to live decent lives. Thestandard value is used as a dividing line/minimum requirement to separate betweenpoor and nonpoor. The dividing line is often called the poverty line. Poverty line perprovince in <strong>Indonesia</strong> is presented in Annex 2.9.20
GRAPH 2.10PERCENTAGE OF POOR PEOPLE IN INDONESIA, 2006 – <strong>2010</strong>Source: BPS-Statistics <strong>Indonesia</strong>, Analisis dan Penghitungan Tingkat Kemiskinan Tahun <strong>2010</strong>Berita Resmi Statistik, BPS 2008, No. 45/07/Th. XIII, 1 Juli <strong>2010</strong>Poor category are those with levels of per capita expenditure of Rp 211.726per month or about USD 7.000 per day. This number increased in 2009 compared topoor category as of March which was recorded at Rp 200.262 per capita per month.Method of calculation was done with the concept of poverty ability to meet basicneeds. In March <strong>2010</strong>, the number of poor dropped to 31.2 million (13.3%) from32.53 million (14.15%) of poor people in March 2009. This suggests that a decline in1.51 million poor people. The percentage of poor population from the year 2008‐<strong>2010</strong> are presented in Table 2.4.TABLE 2.4DISTRIBUTION AND PROPORTION OF POOR PEOPLEBY BIG ISLANDS GROUPS IN INDONESIA, 2008 – <strong>2010</strong>March 2008 March 2009 March <strong>2010</strong>Big Islands Groups TotalTotalTotal%%%(million)(million)(million)Sumatera 7.3 20.9 5.3 17.3 6.7 21.4Java 19.9 57.1 18.1 59.1 17.3 55.8Kalimantan 2.4 6.8 2.2 7.3 2.2 7.1Bali and Nusa Tenggara 1.2 3.5 1.0 3.3 1.0 3.3Sulawesi 2.6 7.5 2.5 8.1 2.3 7.6Maluku and Papua 1.5 4.2 1.5 4.9 1.5 4.8Total 34.9 100.0 32.5 100.0 31.0 100.0Source: BPS-Statistics <strong>Indonesia</strong>, Analisis dan Penghitungan Tingkat Kemiskinan Tahun <strong>2010</strong>Berita Resmi Statistik, BPS 2008, No. 45/07/Th. XIII, 1 Juli <strong>2010</strong>21
Based on data of number of poor people by province of BPS‐Statistics<strong>Indonesia</strong> (Annex 2.10) there was significantly uneven distribution of poor peoplebetween inter‐islands in real difference. The number and proportion of poor peopleaccording to the island can be seen in Table 2.4. More than half of poor people in<strong>Indonesia</strong> were on the island of Java, namely 57.1% in 2008 and to 55.8% in <strong>2010</strong>.The rest 21.4% were scattered in Sumatra, Sulawesi 7.6%, Kalimantan 3.3%, Bali andNusa Tenggara Islands 7.1%, Maluku and Papua 4.8% (year <strong>2010</strong>). The percentage ofpoor population by province in <strong>2010</strong> is described in the Graph 2.10 below.GRAPH 2.11PERCENTAGE OF POOR PEOPLE IN INDONESIA, <strong>2010</strong>Source: BPS-Statistics <strong>Indonesia</strong>In the roadmap of public health reform the Ministry of <strong>Health</strong> there are 7priorities to be done to achieve the strategic objectives of health development. One ofthem is addressing the issue of health care in Problematic Area of <strong>Health</strong> (Ind: DBK)with specific approaches that can not be equated with other regions. Response ofProblematic Area of <strong>Health</strong> (Ind: PDBK) is a focused health efforts, integrated,evidence‐based, carried out gradually in the region which is be a priority withrelevant ministries, in a certain period of time, to be able to organize independently ofgovernment authority in the health field as wide as possible.By definition, the Problematic Area of <strong>Health</strong> (DBK) is a state/level of healthdistricts/municipalities which is illustrated by the results of Riskesdas/SUSENAS withCommunity <strong>Health</strong> Development Index (Ind: IPKM), according to the Ministry ofUnderdeveloped Area Development, Human Development Index (HDI) and thePoverty Index (Socio‐Economic Data Collection/PSE CPM).Results of Riskesdas 2007 produced instruments measurement of Community<strong>Health</strong> Development Index (IPKM). With IPKM, it is known where the problematicareas can be mapped based on the ranking of districts/municipalities. Areas that have22
IPKM
GRAPH 2.12PERCENTAGE OF HOUSEHOLD BY PHYSICAL QUALITY OF DRINKING WATERIN INDONESIA, <strong>2010</strong>Source: Riskesdas, National Board of <strong>Health</strong> Research and Development, <strong>2010</strong>Graph 2.11 shows the percentage of households with better physical quality ofdrinking water. Province with the percentage of households with the highest physicalquality of drinking water was in Bali (95.7%). While the lowest was in Papua (69.0%).In detail by province is presented in Annex 2.11.Result of Basic <strong>Health</strong> Research (RISKESDAS) in <strong>2010</strong> shows the percentage offamilies by type of water supply that used for domestic purposes and for drinkingwater purposes. Nationally, the highest percentage of different types of water use fordomestic purposes was protected dug well water (27.9%), drill well/pumps (22.2%),and tap water/PAM (19.5%). While the highest percentage of kind of clean waterused for drinking water was protected dug wells (24.7%), tap water/PAM (14.2%),and drill wells/pumps (14%). Details of the percentage of families by type of cleanwater used for household and drinking water can be seen in Annex 2.12 and Annex2.13.Description about percentage of households with good access to qualitydrinking water by province can be seen in Graph 2.12. Nationally, 67.5% ofhouseholds already had good access to drinking water quality.24
GRAPH 2.13PERCENTAGE OF HOUSEHOLD BY GOOD ACCESSTO QUALIFIED DRINKING WATERIN INDONESIA, <strong>2010</strong>Source: Riskesdas, National Board of <strong>Health</strong> Research and Development, <strong>2010</strong>Most households in <strong>Indonesia</strong> have easy access to drinking water. Percentageof households claimed to easy to get clean water by 81.70%, 17.8% of households wasdifficult to get clean water during dry season, and only 0.5% of households that weredifficult (all year) to get clean water. Ease of households in obtaining clean water byprovince can be seen in detail in Annex 2.15.2. Facilities and Access of Basic SanitationClean water and good sanitation are important elements that support humanhealth. Sanitation is related with environmental health that affect community healthstatus. Basic <strong>Health</strong> Research (Riskesdas) in <strong>2010</strong> produced percentage of familiesdata with basic sanitation facilities. Nationally, the highest percentage of families withaccess to basic sanitation facilities was the ownership of defecation facility (69.7%),percentage of households by access to excreta disposal in accordance MDGs (55.5%),and the percentage of households who handle waste properly (28.7%).Graph 2.14 shows the percentage of households by using of self‐owneddefecation facility by province.25
GRAPH 2.14PERCENTAGE OF HOUSEHOLD BY USING OF SELFOWNED DEFECATION FACILITYIN INDONESIA, <strong>2010</strong>Source: Riskesdas, National Board of <strong>Health</strong> Research and Development, <strong>2010</strong>Provinces with the highest percentage of households using of self‐owneddefecation facility by province were Riau (84.3%), Lampung (80.4%), and BangkaBelitung Island (79%). While the lowest was in Province of Gorontalo (32.1%),Central Kalimantan (49.4%), and North Maluku (49.6%). Details by province can beseen in Annex 2.17.According to the type of water closet that is used, most households in<strong>Indonesia</strong> used the goose neck closet type, it was 77.58%, cemplung/cubluk of14.32%, and plengsengan of 6.37%. Much as 59.3% of households in <strong>Indonesia</strong> usedseptic tanks as a place of final disposal of feces, 16.4% in landfill river/pond, and by11.7% in the hole of waste land. Details of the percentage of households with basicand healthy sanitation facilities ownership by province can be seen in Annex 2.18,Annex 2.19, Annex 2.20, and Annex 2.21.3. <strong>Health</strong>y HouseHouse is basically a shelter that is very important for the life of every person.The house not only serves as a place to take a rest after working all day, but it also hasan important function as a place to build a healthy family life and prosperous. Criteriafor a healthy house based on Basic <strong>Health</strong> Research (Riskesdas) <strong>2010</strong> is if it meets theseven criteria, namely roof ceiling, permanent walls, floors of non‐soil types,windows, adequate ventilation, adequate natural lighting, and not densely occupied(> = 8 m 2 /person).26
GRAPH 2.15PERCENTAGE OF HOUSEHOLD BY HEALTHY HOUSE CRITERIAIN INDONESIA, <strong>2010</strong>Source: Riskesdas, National Board of <strong>Health</strong> Research and Development, <strong>2010</strong>Results of Riskesdas in <strong>2010</strong> stated that the percentage of householdsnationwide that had a healthy house was only 24.9%. Graph 2.15 graph shows theprovinces with highest percentage of healthy house were East Kalimantan (43.6%),Riau Island (42.7%) and Riau (41.1%). Provinces with the lowest percentage ofhealthy house were East Nusa Tenggara (7.5%), Lampung (14.1%) and CentralSulawesi (16.1%). Percentage of healthy house by province is presented in Annex2.22.D. PEOPLE BEHAVIOR SITUATIONTo describe the state of people behavior that affect health, it will be presentedseveral indicators of smoking behavior, waste handling, the woman's age at firstmarriage and number of children ever born.1. Smoking BehaviorSmoking is a problem that can not be resolved until today. Smoking hasalready hit all walks of society in <strong>Indonesia</strong>, both children to the elderly, men andwomen. One of targets of healthy behavior programs and community empowermentis the reduced prevalence of current smokers and tobacco‐free healthy growingenvironment in schools, workplaces and public places.27
GRAPH 2.16PERCENTAGE OF PEOPLE AGE ≥ 15 YEARS WHO HAD SMOKING BEHAVIORIN INDONESIA, <strong>2010</strong>Source: Riskesdas, National Board of <strong>Health</strong> Research and Development, <strong>2010</strong>Graph 2.16 shows the results of Riskesdas <strong>2010</strong> on the smoking behavior of thepopulation. Nationally, the percentage of the population aged > 15 years who smokedwas 34.7%, comprising 28.2% daily smokers and 6.5% occasional smokers. Thehighest percentage of the population > 15 years of smoking (daily and occasional)were located in Province of Central Kalimantan (43.2%), East Nusa Tenggara(41.2%), and North Maluku (40.8%). While the lowest percentage were in SoutheastSulawesi (28.3%), South Kalimantan (05.30%), and Jakarta (30.8%). Percentage ofpopulation > 15 years of smoking by province is presented in Annex 2.23.Nationally, based on the results of Riskesdas <strong>2010</strong>, the largest percentage byage group was the first smoking at age 15‐19 years, in amount of 43.3%, then the agegroup 10‐14 years (17.5%), and the age group 20‐24 years (14.6 %). Among smokers,as much as 1.7% the first time smoking at age 5‐9 years. This condition indicates thatthe average population of <strong>Indonesia</strong> has been smoking cigarettes/chewing tobacco ata young age. This is also supported by the easy access of <strong>Indonesia</strong> to obtaincigarettes or tobacco. Breakdown by province is shown in Annex 2.24.2. Waste HandlingRiskesdas <strong>2010</strong> also collected data on waste handling. Waste handling is goodif garbage in householdis taken by dustman, composted, or buried in soil. Category ifthe household is not good in managing waste burned, dumped into the river, or28
carelessly. Percentage of households with the criteria of good waste handling can beseen at Graph 2.17.GRAPH 2.17PERCENTAGE OF HOUSEHOLD BY GOOD WASTE HANDLINGIN INDONESIA, <strong>2010</strong>Source: Riskesdas, National Board of <strong>Health</strong> Research and Development, <strong>2010</strong>Nationally, household in waste handling with good criteria was still low at only28.7%. Provinces with the highest percentage were DKI Jakarta, in amount of 84.3%,Riau Island 48.1%, and East Kalimantan 47.2%. The lowest percentages were inProvince of Gorontalo at 6.0%, West Kalimantan 10.5%, and East Nusa Tenggara11.7%.3. Woman’s Age of First MarriageWoman’s age at first marriage is the age when woman gets marriage legallyand biologically the first time. Woman who marry at a very young age have a greaterrisk to the safety of mother and child. This is due to immaturity of the young age ofthe woman's uterus for childbirth.Nationally, as shown in Graph 2.18, from women age 10‐59 years who hadbeen married, in amount of 41.9% of them were married at first time at age 15‐19years, then 33.6% of them were married at age 20‐24. This indicates the low age atfirst marriage of women in <strong>Indonesia</strong>. The average age at first marriage of womenoccurred at age 20. The highest average age of woman first marriage was in Provinceof Riau Island, namely age of 22.2 years and the lowest average age at first marriagewere in Province of Central Kalimantan and South Kalimantan, namely age of 19years.29
GRAPH 2.18PERCENTAGE OF WOMEN AGE 1059 YEARS WHO HAD BEEN MARRIEDBY AGE OF FIRST MARRIAGEIN INDONESIA, <strong>2010</strong>Source: Riskesdas, National Board of <strong>Health</strong> Research and Development, <strong>2010</strong>Percentage of women aged 10‐59 years who had married by age at firstmarriage by province can be seen in Annex 2.26.4. Number of Children BirthOne major factor in the growth of the population is birth. The greater thenumber of births the population growth will be even greater. Graph 2.19 shows theresults of Riskesdas <strong>2010</strong> regarding the percentage of women who had been marriedaccording to the number of children ever born. In amount of 56.1% by number ofchildren ever born for 1‐2 children and 29.9% with the number of children ever bornchildren 3‐4 children. There was still obtained at 3.4% with children ever bornamounted to 7 children or more. While that woman had not/did not have children thepercentage was very low, only 2.2%.30
GRAPH 2.19PERCENTAGE OF WOMEN AGE 1059 YEARS WHO HAD BEEN MARRIEDBY NUMBER OF CHILDREN BIRTHSIN INDONESIA, <strong>2010</strong>Source: Riskesdas, National Board of <strong>Health</strong> Research and Development, <strong>2010</strong>Condition in all provinces throughout <strong>Indonesia</strong> shows that relatively the samecase. Most households had 1‐2 children with the highest percentage occurred in EastJava 68.1% and Yogyakarta 67.7%. The lowest percentage was in East Nusa Tenggara(35.6%). Details by province can be seen in Annex 2.27.***31
There are several indicators used on evaluating public health status. Thoseindicators are related to morbidity, mortality, and nutritional status. Chapter IIIdescirbes public health status through Infant Mortality Rate (IMR), UnderfiveMortality Rate (UMR), Maternal Mortality Rate (MMR), and morbidity of diseases.Public health status can be determined by many factors. It is not onlyinfluenced by health sector such as health care, furthermore economic, educational,and social factors also contribute to public health status.A. MORTALITYMortality may describe number of death cases and case fatality rate of disasesduring certain period of time at certain place. Mortality situation can be represented asmortality rate. Mortality rate described on this chapter are IMR, UMR, MMR, and CrudeDeath Rate.1. Infant Mortality Rate (IMR)IMR can be defined as number of infants died before reach 1 year of age statedon 1,000 live births on the same year. <strong>Health</strong> programs are implemented in order todecrease IMR.Based on <strong>Indonesia</strong> Demography <strong>Health</strong> Survey (IDHS), IMR has showndeclining trend since 1991. IMR on 1991 was 68 per 1,000 live births. The numberthen decreased to 34 per 1,000 live births in 2007. Estimation of IMR calculated IMRon previous 5 years before survey. It means that IMR based on IDHS 2007 representsIMR on 2003‐2007.35
GRAPH 3.1ESTIMATION OF INFANT MORTALITY RATE PER 1,000 LIVE BIRTHSIN 19912007Source: Statistics <strong>Indonesia</strong>, <strong>Indonesia</strong> Demographic <strong>Health</strong> Survey, 2007Many factors may contribute to IMR decrease such as improvement on healthcare. Economic improvement can also influence IMR. It is indicated through incomeincrease leading to improvement of nutritional status and immune system.GRAPH 3.2ESTIMATION OF INFANT MORTALITY RATE PER 1,000 LIVE BIRTHSBY PROVINCE IN INDONESIA, 2007Source: Statistics <strong>Indonesia</strong>, <strong>Indonesia</strong> Demographic <strong>Health</strong> Survey, 2007IDHS on 2007 indicated that province having lowest IMR was DI Yogyakartawith 19 per 1,000 live births, followed by Aceh with 25 per 1,000 live live births, EastKalimantan, and Central Java with 26 per 1,000 live births. Meanwhile the highestIMR was West Sulawesi with 74 per 1,000 live births, followed by West NusaTenggara with 72 per 1,000 live births and Central Sulawesi with 60 per 1,000 livebirths. More information concerning to IMR can be seen on Annex 3.1.36
2. Underfive Mortality Rate (UMR)Underfive Mortality Rate describes children who died before 5 yearsrepresenting probability of death on the period between birth and 5 years old.Millenium Development Goals (MDGs) classifies UMR per 1,000 live births into 4normative intervals i.e very high, high, medium, and low. UMR with more than 140defined as very high, UMR on range 71‐140 defined as high, UMR on range 20‐70defined as medium, and UMR under 20 defined as low. The IDHS, 2007 estimatedUMR in <strong>Indonesia</strong> at 44 per per 1,000 live births. It represents condition from 2003 to2007.GRAPH 3.3UNDERFIVE MORTALITY RATE PER 1,000 LIVE BIRTHSIN INDONESIA IN 1991 – 2007Source: Statistics <strong>Indonesia</strong>, 2008Estimation of UMR at province level indicates that DI Yogyakarta has lowestUMR of 22 per 1,000 live births, followed by Central Java of 32 per 1,000 live birthsand Central Kalimantan of 34 per 1,000 live births. Meanwhile province with highestUMR was West Sulawesi of 96 per 1,000 live births, followed by Maluku of 93 per1,000 live births and West Nusa Tenggara of 92 per 1,000 live births. The followinggraph describes UMR by province in 2007.37
GRAPH 3.4ESTIMATION OF UNDERFIVE MORTALITY RATE PER 1,000 LIVE BIRTHSBY PROVINCE IN INDONESIA, 2007Source : Statistics <strong>Indonesia</strong>, <strong>Indonesia</strong> Demographic <strong>Health</strong> Survey, 20073. Maternal Mortality Rate (MMR)Maternal Mortality Rate (MMR) is one of significant indicators on determiningpublic health status. The indicator describes number of women who died due topregnancy, delivery, and post partum (42 days after delivery) without consideringduration of pregnancy per 100,000 live births.MMR can be influenced by health status, education, ante natal care, and postnatal care. Sensitivity of MMR on measuring health care improvement making it asone of indicator using to assess health development.The IDHS in 2007 indicated that IMR during 5 years before survey is 228 per100,000 live births. It is lower than IMR based on IDHS in 2003 of 307 per 100,000live births. The following Graph 3.5 describes declining trend of MMR in 1994‐2007.GRAPH 3.5MATERNAL MORTALITY RATE (PER 100,000 LIVE BIRTHS)IN INDONESIA, 1994200738Source : Statistics <strong>Indonesia</strong>, 2008
4. Crude Death RateCrude Death Rate describes number of deaths on certain place and time per1,000 population on the mid year. Based on Intercensal Survey, 2005 (SUPAS 2005),Crude Death Rate in 2007 was 6,9 per 1,000 population.5. Life Expectancy at Birth (Eo)Public health status can be measured through Life Expectancy at Birth (Eo).Life Expectancy at Birth is also one of significant factors on formulating HumanDevelopment Index (HDI). Life Expectancy at Birth in <strong>Indonesia</strong> showed rising trendin 2006‐2008.Based on Statistics‐<strong>Indonesia</strong>, Eo in 2006 was 68.5 year. It rose to 68.7 year in2007 and 69 year in 2008. It continued rising to 69.21 in 2009. Province with highestEo in 2009 was DI Yogyakarta of 73.16 year, followed by DKI Jakarta of 73.05 yearand North Sulawesi of 72.12 year. Meanwhile province with lowest Eo in 2009 wasWest Nusa Tenggara of 61.8 year, followed by South Kalimantan 63.45 year andBanten of 64.75 year. More details about Eo by province in 2009 are on Annex 3.2.GRAPH 3.6LIFE EXPECTANCY AT BIRTHBY PROVINCE IN INDONESIA, 2009Source : Statistics <strong>Indonesia</strong>, <strong>2010</strong>Life expectancy at birth is significant on formulating Human DevelopmentIndex, HDI by porovince in 2009 are described on the graph as follows based onStatistics <strong>Indonesia</strong>‐Statistics <strong>Indonesia</strong> Report.39
GRAPH 3.7HUMAN DEVELOPMENT INDEX BY PROVINCEIN INDONESIA, 2009Source: Statistics <strong>Indonesia</strong>, <strong>2010</strong>According to above graph, DKI Jakarta was province with highest HDI,followed by North Sulawesi, and Riau. Meanwhile province with lowest HDI wasPapua, followed by West Nusa Tenggara, and East Nusa Tenggara.B. MORBIDITYMorbidity can be indicated through as incidence or prevalence of disease. Thosemay describe event of disease on certain population and time period. The indicators aresignificant to assess public health status.1. 10 Main Disesases in HospitalTen main diseases on hospital inpatients based on Basic Tabulation List,showed that Diarrhea and gastroenteritis by certain infection (colitic infection) hadhighest cases of 71,889 cases. More description of 10 main diseases on hospitalinpatients are on Table 3.1 as follows.40
No1234TABEL 3.110 MAIN DISEASES ON HOSPITAL INPATIENSIN INDONESIA, <strong>2010</strong>CasesNumbber ofBasic Tabulation ListReleased Deaths CFR (%)Males FemalesPatientDiarrhea & gastroenteritisby certain infection37,281 34,608 71,889 1,289 1.79(infection colitic)Dengue HaemorrhagicFever (DHF)30,232 28,883 59,115 325 0.55Typhoid and paratyphoidfever19,706 21,375 41,081 274 0.67Penyulit kehamilan danpersalinan lainnya0 40,636 40,636 276 0.685 Dispeptia 9,594 15,122 24,716 166 0.6767Cedera YDT lainnya YTTdan daerah badan MultipelEsseential Hypertension(primary)14,405 7,328 21,733 605 2.788,423 11,451 19,874 955 4.818 Intracranial injury 12,010 7,371 19,381 1,025 5.299Other acute upperrespiratory infection9,737 8,181 17,918 589 3.2910 Pneumonie 9,340 7,971 17,311 1,315 7.60Source: DG of <strong>Health</strong> Efforts, Ministry of <strong>Health</strong> RI, 2011Above tabel indicates that highest CFR among 10 main diseases in hospitalinpatients is pneumonie of 7.6%, followed by intracranial injury of 5.29% andessential hypertension (primary) of 4.81%.Meanwhile, 10 main diseases on hospital outpatients indicated that otherupper acute respiratory infections had highest number of 291,356 cases. Thefollowing table provides data of 10 main diseases on hospital inpatients in <strong>2010</strong>.41
42No12345TABLE 3.210 MAIN DISEASES ON HOSPITAL INPATIENTSIN INDONESIA, <strong>2010</strong>Basic Tabulation ListCasesNew CasesMales FemalesVisitsOther upper acute repiratoryinfections147,410 143,946 291,356 433,354Cedera YDT lainnya YTT dandaerah badan Multipel77,337 49,739 127,076 168,768Dermatitis and othersubcutaneos diseases48,576 73,500 122,076 192,414Refraction and accomodationdisorder42,349 69,164 111,513 143,404Diarrhea & gastroenteritis bycertain infection (colitis53,389 51,890 105,279 141,556infection)6 Dispeptia 34,981 53,618 88,599 163,4287Disease of pulpa andperiapical39,427 46,994 86,421 163,2118Essential Hypertension(primary)35,462 45,153 80,615 277,8469Conjungtivitis and otherconjungtiva disorders30,250 37,776 68,026 87,51310Disease of ear and prosesusmastoid30,583 30,855 61,438 99,663Source: DG of <strong>Health</strong> Efforts, Ministry of <strong>Health</strong> RI, 20112. Nutritional StatusOne of indicator evaluated on MDGs is underfive nutritional status. It ismeasured through age, weight, and height. Weight and height are provided on threeindicators i.e weight per age, height per age, and weight per height. Weight per ageindicates general problem of nutrition. It does not explain chronic nor acute nutritionproblem because weight has positive correlation to age and height. On the otherwords, low weight may appear as a result of short (chronic), diarrhea or other acuteinfection.Meanwhile, height per age may describe chronic nutrition problem as a resultof long term cause, i.e poverty, lack of health behaviour, and poor child feedingbehaviour since birth leading to short. Weight per height and Body Mass Index (BMI)per age may describe acute nutrition problem as result of short term cause, i.edisease, less of nutrition intake led to thin.Indicator of weight per age based on Basic <strong>Health</strong> Survey (Riskesdas) <strong>2010</strong>indicates that province with highest prevalence of severe mal nutrition was Gorontaloof 11.2%, followed by West Nusa Tenggara of 10.6%, and West Kalimantan of 9.5%.Meanwhile, province with lowest prevalence of mal nutrition was DI Yogyakarta of1.4%, followed by Bali of 1.7%, and DKI Jakarta of 2.6%.
Chronic nutrition problem indicated by height per age antropometricindicator. Based on Riskesdas <strong>2010</strong>, province with highest prevalence of severestunted underfive was East Nusa Tenggara of 30.9%, followed by West Papua of28.6%, and West Nusa Tenggara of 27.8%. Meanwhile province with lowestprevalence of severe stunted underfive was DI Yogyakarta of 10.2%, followed by RiauIslands of 11.4%, and Bangka Belitung Islands of 12.5%.Weight per height indicator describe acute nutritional problem. Riskesdas<strong>2010</strong> indicated that province with highest prevalence of severe wasted underfive wasJambi at 11.3%, followed by Bengkulu at 9.7%, and Riau at 9.2%. Meanwhile provincewith lowest prevalence of severe wasted underfive was Bangka Belitung Islands at1.7%, followed by Riau Islands at 2%, and North Sulawesi at 2.6%.Nutritional issue on above 18 years of age popoulation can be measured byBMI. Riskesdas <strong>2010</strong> indicated that province with highest prevalence of wasted adultwas East Nusa Tenggara at 19.7%, followed by South Kalimantan at 18.6%, and DIYogyakarta at 17.5%. Meanwhile province with lowest prevalence of wasted adultwas North Sulawesi at 6%, followed by East Kalimantan at 8.4%, and North Sumateraat 8.7%.Following table provide underfive nutritional status based on antropometricindicator i.e weight per age, height per age, and weight per height by sex, educationlevel of head of family, and house hold expenses.TABLE 3.3PREVALENCE (%) OF UNDERFIVE NUTRITIONAL STATUS (WEIGHT PER AGE)BY CHARACTERISTIC OF RESPONDENT, RISKESDAS <strong>2010</strong>Characteristic of RespondentSexHouseholdExpensesper CapitaSevere MalNutritionUnderWeightNormalOverWeightTotalMales 5.2 13.9 75.0 5.9 100Females 4.6 12.1 77,5 5.8 100Total 4.9 13.0 76.2 5.8 100Quintil 1 7.1 15.6 72.2 5.2 100Quintil 2 4.9 14.2 75.8 5.1 100Quintil 3 4.6 13.0 77.4 5.0 100Quintil 4 3.8 11.5 78.4 6.4 100Quintil 5 2.5 7.9 80.5 9.0 100Total 4.9 13 76.2 5.8 100Source: Riskesdas <strong>2010</strong>, National Institute for <strong>Health</strong> Reaserch and Development, Ministry of <strong>Health</strong> RIAbove table describes that prevalence of severe mal nutrition and underweight on male underfives are higher than that on female underfives. It also indicatesthat declining of household expenses followed by increase of prevalence of severe malnutrition and under weight. Meanwhile prevalence of underfive normal nutritionincrease coherently to household expenses.43
TABLE 3.4PREVALENCE (%) OF UNDERFIVE NUTRITIONAL STATUS (HEIGHT PER AGE)BY CHARACTERISTIC OF RESPONDENT, RISKESDAS <strong>2010</strong>EducationLevel ofHead ofFamilyCharacteristic of RespondentSevereStuntedStunted Normal TotalNever school 24.6 17.3 58.0 100Under graduate ofelementary school21.2 19.9 58.8 100elementary school 20.1 18.6 61.3 100Junior high school 18.8 18.1 63.1 100High school 16.4 14.8 68.8 100Academy/University 11.3 12.9 75.8 100Total 18.5 17.2 64.4 100Quintil 1 22.6 20.5 56.9 100Householdexpensesper capitaQuintil 2 20.8 18.1 61.1 100Quintil 3 16.9 17.0 66.0 100Quintil 4 15.3 15.4 69.3 100Quintil 5 12.8 11.3 75.9 100Total 18.5 17.1 64.4 100Source: Riskesdas <strong>2010</strong>, National Institute for <strong>Health</strong> Reaserch and Development, Ministry of <strong>Health</strong> RIAbove table indicates that prevalence of severe stunted underfive and stuntedunderfive rise coherently to decrease of education level of head of familiy anddecrease of household expenses per capita. Prevalence of normal underfive increasecoherently to increase of education level of head of familiy and increase of householdexpenses per capita.The following table describes prevalence of underfive nutritional status basedon weight per height by characteristic of respondent. Based on the table it describesthat education of parents increase coherently to decrease of prevalence of severestunted underfive. Level of household expenses increase coherently to increase ofprevalence of normal underfive and decrease of prevalence of severe wastedunderfive.44
Educationlevel ofparentsTABLE 3.5PREVALENCE (%) OF UNDERFIVE NUTRITIONAL STATU (WEIGHT PER HEIGHT)BY CHARACTERISTIC OF RESPONDENT, RISKESDAS <strong>2010</strong>Characteristic of RespondentHouseholdexpensesper capitaSevereWastedWasted Normal ObeseTotalNever school 6.7 6.9 69.6 16.8 100Under graduate ofElementary school6.5 7.573.6 12.4 100Elementary school 6.5 7.5 72.5 13.5 100Junior high school 6.2 7.6 72.3 13.9 100High school 5.4 6.8 74.0 13.9 100Academy/University 4.5 7.0 71.4 17.1 100Total 6.0 7.3 72.8 14.0 100Quintil 1 6.6 8.1 71.6 13.7 100Quintil 2 6.6 7.3 72.6 13.5 100Quintil 3 6.3 6.9 73.1 13.6 100Quintil 4 5.1 7.0 73.2 14.7 100Quintil 5 4.3 6.3 74.4 14.9 100Total 6.0 7.3 72.8 14.0 100Source: Riskesdas <strong>2010</strong>, National Institute for <strong>Health</strong> Reaserch and Development, Ministry of <strong>Health</strong> RIFurther information about underfive and adult nutritional status are on Annex3.5, 3.6, 3.7, 3.8, and 3.9.3. Communicable Diseasesa. MalariaMalaria is one of communicable diseases addressed on MilleniumDevelopment Goals as global commitment. Malaria is caused by Plasmodium infectingthrough mosquito (Anopheles) bite. It can infect males, females, infants, underfives,and adults. There are 80% of districts/municipalities confirmed as malaria endemic,and more than 45% of population of those live on endemic village.Malaria endemic villages are remote areas with poor environment andsanitation, inaccessible transportation and communication, low accessibility to healthcare, low education and social‐economic level and poor health behaviour.DG of Diseases Control and Environmental <strong>Health</strong> establishes stratification ofmalaria endemicity in <strong>Indonesia</strong> into 4 strata :1. High Endemic, with Annual Parasite Incidence (API) > 5 per 1,000population.2. Medium Endemic, with API 1 – 5 per 1,000 population.3. Low Endemic, with API 0 ‐ 1 per 1,000 population.45
4. Non Endemic, area where malaria cases are not found, API = 0.The following graph descibes map of malaria endemicity atdistrict/municipality level in <strong>2010</strong>.GRAPH 3.8MAP OF MALARIA ENDEMICITY AT DISTRICT/MUNICIPALITY LEVELIN INDONESIA, <strong>2010</strong>Source: DG of Disease Control and Environmental <strong>Health</strong>, Ministry of <strong>Health</strong> RI, 2011Malaria cases from 2005 to <strong>2010</strong> remained decrease, from 4.10 in 2005 to 1.96per 1,000 population in <strong>2010</strong>. The decrease is influenced by improvement in malariacontrol including increase of laboratory confirmation. There were 982,828 (47%) ofblood specimens tested among 2,113,265 of clinical cases in 2005. Meanwhile, therewere 1,164,406 (63%) of blood specimens tested in <strong>2010</strong> among 1,848,999 of clinicalcases. The high coverage of test was result of malaria control program to eliminatemalaria cases which every clinical case must be laboratory confirmed.GRAPH 3.9ANNUAL PARASITE INCIDENCE OF MALARIA PER 1,000 POPULATIONBY PROVINCE IN INDONESIA, <strong>2010</strong>Source: DG of Disease Control and Environmental <strong>Health</strong>, Ministry of <strong>Health</strong> RI, 201146
DG of Diasease Control and Environmental <strong>Health</strong> has established API asindicator to 33 provinces in <strong>Indonesia</strong> since <strong>2010</strong>. API in <strong>2010</strong> achieved target of 2per 1,000 population. Based on above graph three provinces with highest API in <strong>2010</strong>were Papua, West Papua and East Nusa Tenggara with API 18.03; 17.86 and 12.14 per1,000 population. Meanwhile province with lowest API was DKI Jakarta of 0. Per1,000 population, DI Yogyakarta of 0.01 per 1,000 population, and Bali of 0.03 per1,000 population.Riskesdas <strong>2010</strong> describes malaria with period prevalence indicator in onelatest month. Period prevalence on Riskesdas divided into two categories i.econfirmed case by blood speciment test (D), and case with clinical symptoms orwithout clinical symptoms but taking anti‐malaria drugs (G).Riskesdas <strong>2010</strong> indicates that province with highest period prevalence (D)was West Papua at 10.6%, followed by Papua at 10.1%, and East Nusa Tenggara at4.4%. Meanwhile province with lowest period prevalence (D) was DI Yogyakarta at0%, followed by DKI Jakarta, West Java, Central Java, East Java, Banten, and Bali at0.1%.TABEL 3.6PERIOD PREVALENCE OF MALARIA (%) ON ONE LAST MONTHBY DIAGNOSIS AND CHARACTERISTIC OF RESPONDENT, RISKESDAS <strong>2010</strong>Charactersitic of RespondentPeriod Prevalence (%)ResidencesLevel ofEducationD G DGUrban 0.3 8.2 8.5Rural 0.8 12.1 12.8Never school 0.6 11.9 12.4Under graduate ofElementary school0.7 11.5 12.2Elementary school 0.5 11.6 12.0Junior high school 0.5 9.3 9.7High school 0.6 7.3 7.8Academy/University 0.4 5.2 5.6Under employee 0.4 10.2 10.5Type of WorkStudent 0.5 8.9 9.3GovernmentOfficer/ArmedForces/Police0.6 6.0 6.6Enterpreneur 0.4 8.4 8.8Farmer/Fisherman/Labour 0.8 12.8 13.5Others 0,7 10,3 10,9Note : D= diagnosis with blood test; G= diagnosis with clinical symptomDG= Combination of D and GSource: Riskesdas <strong>2010</strong>, National Institute for <strong>Health</strong> Reaserch and Development, MoH RI47
Above table shows us that prevalence of malaria of all criterion on rural areaare higher than that of prevalence on urban. Prevalence of malaria (DG) decreasecoherently to increase of education level. Prevalence of malaria of all criterion reachthe highest on farmer/fisherman/labour group. Meanwhile lowest prevalence ofclinical symptoms or without clinical symptoms but taking anti‐malaria drugs (G)criteria , and DG criteria are on government officer/Armed Forces/Police. Furtherinformation concerning to malaria are on Annex 3.10, 3.11, and 3.12.b. Pulmonary TBTuberculosis is one of communicable diseases caused by infection ofMycobacterium tuberculosis. Droplet containing the bacil may spread through air andcausing infection. Control of the diseases is addressed by MDGs target.WHO has recommended DOTS (Directly Observed Treatment Shortcourse) asone of strategy to control TB since 1995. It is proved that DOTS has become costefectivestrategy. It consists of five critical components i.e1. Political commitment2. Qualified sputum smear test3. Standarized short‐term treatment to all TB cases with appropriate casemanagement, and treatment observation4. TB drugs availability5. Recording‐reporting system supporting evaluation to treatment and wholeprogram performance.DOTS program has been implemented in 33 provinces and 497districts/municipalities. It has been conducted in health centers (96%), and hospitals(40%) consists of government, private, BUMN, Armed Forces/Police, B/BPKPM, andRSTP.Case Detection Rate is one of indicator using on TB control program. Itdescribes proportion of smear positive cases found and treated to all estimated newsmear positive cases. Ministry of <strong>Health</strong> has established minimum target of CDR in<strong>2010</strong> at 73%.Case Detection Rate in <strong>Indonesia</strong> on <strong>2010</strong> was 78,3%. It has fulfilled minimumtarget of CDR. In terms of province level, North Sulawesi reached highest percentage at96.2%, followed by DKI Jakarta at 79.9% and Gorontalo at 77.3%. Meanwhile, provincewith lowest percentage was Central Kalimantan at 29.8% followed by East Kalimantan at32.5% and West Nusa Tenggara at 33.3%. Based on the graph, it is clear that there are sixprovinces has fulfilled the minimum target of CDR i.e North Sulawesi, DKI Jakarta,Gorontalo, Maluku, Banten, and North Sumatera. The following Graph 3.10 describesCDR by province in <strong>Indonesia</strong>, <strong>2010</strong>.48
GRAPH 3.10CASE DETECTION RATE (CDR) OF TB IN INDONESIA, <strong>2010</strong>Source: DG of Disease Control and Environmental <strong>Health</strong>, Ministry of <strong>Health</strong> RI, 2011In order to evaluate effectivity of TB treatment, DG of Diseases Control andEnvironmental <strong>Health</strong> has establised three indicators, i.e cure rate, completetreatment, and success rate (SR). Cure rate represents proportion of cured cases tosmear positive cases. Percentage of complete treatment explains proportion of smearpositive cases taking complete treatment to smear positive cases. Cured rate andcomplete treatment in 2009 respactadly were 83.9% and 7,3%. Success Rateindicates new smear positive cases taking complete treatment and cured among newsmear positive cases. Success Rate from 2004 to 2009 are described on the graph asfollows.GRAPH 3.11SUCCESS RATE (SR) OF TB IN INDONESIA, 20042009Source: DG of Disease Control and Environmental <strong>Health</strong>, Ministry of <strong>Health</strong> RI, 2011According to the Graph 3.11 we know that SR from 2004 to 2009 has fulfilled theTarget at 85%. Although SR has met the target, it declined from 91% in 2005 to 87.6% in2006. SR rose to 91% in 2007 and continued to rise to 91.2% in 2009.49
Riskesdas <strong>2010</strong> provides period prevalence of TB consists of two criterion i.ediagnosed (D) and with clinical symptoms. Period prevalence of TB with diagnosedcriteria is generated through interview with respondents. Prevalence of diagnosed TBwere obtained through question whether they have ever diagnosed TB through smeartest and/or thorax image by health personnel. While to obtain prevalence of clinicalsymptoms or TB suspects, respondents who answered no to the question of whether theyhave ever diagnosed TB, were then asked whether they have experienced phlegmic coughfor a period of two weeks or more with more than one symptom of: phlegm with blood ,losing weight, sweating at night without physiscal activity, and fever for a period morethan one month.Province with highest period prevalence of TB with diagnosed criteria (D) wasPapua of 1.441% followed by Banten of 1.282%, and North Sulawesi of 1.221%.Meanwhile the lowest prevalence was Lampung of 0.27%, followed by Bali of 0.306% ,and DI Yogyakarta of 0.311%.Period prevalence TB by characteristic of respondent are described on followingtable. Further description of TB are on Annex 3.13, 3.14, 3.15, 3.16, dan 3.17.TABLE 3.7PERIOD PREVALENCE OF TB (D) DAN PERIOD PREVALENCE OF TB SUSPECT (G)ON POPULATION > 15 YEARS OF AGE BY CHARACTERISTIC, RISKESDAS <strong>2010</strong>Characteristic of RespondentPeriod Prevalence (%)Type ofResidencesLevel ofEducationDGUrban 0.703 2.320Rural 0.750 3.182Never school 1.041 4.074Under graduate ofElementary school0.974 3.948Elementary school 0.904 3.060Junior high school 0.566 2.305High school 0.455 1.922Academy/University 0.535 1.366Quintil 1 0.733 3.012Expenses perCapitaQuintil 2 0.707 2.870Quintil 3 0.768 2.74550Quintil 4 0.801 2.516Quintil 5 0.607 2.410Source: Riskesdas <strong>2010</strong>, National Institute for <strong>Health</strong> Reaserch and Development, MoH RIAbove table explains that period prevalence of two criterion on rural are higherthan that of urban. Prevalence of TB with diagnosed criteria decrease coherently withincrease of education level. Meanwhile, prevalence of TB with clinical symptoms decreasecoherently with increase of education level and increase of expenses per capita.
c. HIV/AIDSHIV/AIDS is one of communicable diseases caused by infection of HumanImmunodeficiency Virus infecting immune system. The virus weakens immnunesystem on protecting body from diseases. People with HIV/AIDS are easily infected bymany diseases.HIV cases can be detected through Voluntary Counseling and Test (VCT), serosurvey, and Integrated Biological and Behavioral Survey (IBBS). There were 20,028 clientsconfirmed as HIV positive among 192,076 clients tested on VCT in <strong>2010</strong>. It indicates thatpositive rate on VCT were 10.4%. Number of HIV positive cumulative cases on VCT were55,848 cases.Number of AIDS cumulative cases up to December <strong>2010</strong> were 24,131 cases. Graph3.12 illustrates new cases and cumulative cases of AIDS up to December, <strong>2010</strong>.GRAPH 3.12NUMBER OF NEW CASES AND CUMULATIVE CASES OF AIDSON HEALTH CARE IN INDONESIA, 2001 – <strong>2010</strong>Source: DG of Disease Control and Environmental <strong>Health</strong>, Ministry of <strong>Health</strong> RI, 2011From the graph it is shown that there is significant increase of AIDS new caseson 2005 and 2008. Number of AIDS new cases on <strong>2010</strong> were 4,158, they were higherthan that of 2009 at 3,863 cases. Magnitude of issue can also be identified throughAIDS case rate which indicates proportion of AIDS cumulative cases to totalpopulation. Province with highest AIDS case rate on <strong>2010</strong> was Papua of 173.69,followed by Bali of 49.16, and DKI Jakarta of 44.74 per 100,000 population. Thefollowing graph describes Case Rate per 100,000 population by province in<strong>Indonesia</strong>.51
GRAPH 3.13CASE RATE PER 100.000 POPULATION OF AIDS BY PROVINCE IN INDONESIAUP TO DECEMBER, <strong>2010</strong>Source: DG of Disease Control and Environmental <strong>Health</strong>, Ministry of <strong>Health</strong> RI, 2011HIV/AIDS can be transmitted through i.e sexual intercourse on heterosexual,male sex to male, shared injecting drug use, blood transfussion, and perinatal. Thefollowing Graph 3.14 explains percentage of cumulative cases by type of transmission.GRAPH 3.14PERCENTAGE OF AIDS CUMULATVE CASES BY TYPE OF TRANSMISSION IN INDONESIAUP TO DECEMBER, <strong>2010</strong>Source: DG of Disease Control and Environmental <strong>Health</strong>, Ministry of <strong>Health</strong> RI, 2011The above graph indicates that there were two main type of transmission withhigh percentage, i.e sexual intercourse on heterosexual at 52.7%, and IDU at 38.3%. Interms of sex, percentage of AIDS cumulative cases on male was higher than female,with 73% to 26.6%. Percentage of AIDS cumulative cases by sex is described on thegraph as follows.52
GRAPH 3.15PERCENTAGE OF AIDS CUMULATIVE CASESBY SEX IN INDONESIA UP TO DECEMBER, <strong>2010</strong>Source: DG of Disease Control and Environmental <strong>Health</strong>, Ministry of <strong>Health</strong> RI. 2011In terms of age group, most of AIDS cases are on age group of 20‐29 years old,30‐39 years old, and 40‐49 years old. Those age groups are sexually active andpotential to use IDU.GRAPH 3.16PERCENTAGE OF AIDS CUMULATIVE CASES BY AGE GROUPIN INDONESIA UP TO DECEMBER, <strong>2010</strong>Source: DG of Disease Control and Environmental <strong>Health</strong>, Ministry of <strong>Health</strong> RI, 2011More information concerning to HIV/AIDS can be seen on Annex 3.18, Annex3.19, and Annex 3.20.d. PneumoniaPneumonia is an acute infection on alveolous caused by bacteria, virus orfungus. Chemical substance entering human body through inhalation can also lead to thedisease. Chlidren under 2 years of age, elderly, and people with malnutrition or immunitydisfunction are vulnerable group to Pneumonia.53
Case detection of underfive pneumonia reached percentage of 23% with499.259 cases were found in <strong>2010</strong>. Below graph illustrates detection coverage ofunderfive pneumonia by province.GRAPH 3.17COVERAGE OF UNDERFIVE PNEUMONIA DETECTIONBY PROVINCE IN INDONESIA, <strong>2010</strong>Source: DG of Disease Control and Environmental <strong>Health</strong>, Ministry of <strong>Health</strong> RI, 2011The graph explains that province with the highest percentage was West NusaTenggara of 64.49%, followed by South Kalimantan of 49.6% and West Java of48.65%. Meanwhile, province with the lowest percentage was Bengkulu of 1.68%,followed by Riau Islands of 1.91%, and Aceh of 3.53%. Further data and informationof Pneomonia are on Annex 3.21.e. LeprosyLeprosy is communicable disease caused by infection of Mycobacterium leprae.Leprosy can be progressive when case management is not conducted properly.Increase of leprosy progressiveness can be indicated through permanent disorder ofskin, nervous system, extremities, and eyes. Patient was confirmed as leprosy whendiagnosis refers to three conditions :1. White spot or rash on skin with numbness2. Hardening on peripheral nerve system with nerve malfunction, numbness, andmuscle weakness3. Smear positive of skinThere were 13,734 new Multi Bacillary (MB) cases and 3,278 new PauciBacillary cases with 7.22 per 100,000 population of Newly Case Detection Rate(NCDR). Trend of those three indicators are described on following Graph 3.18.54
GRAPH 3.18NUMBER OF PAUCI BACILLARY (PB) AND MULTI BACILLARY (MB) LEPROSYAND NEWLY CASE DETECTION RATE (NCDR) PER 100.000 POPULATIONIN INDONESIA, 2005<strong>2010</strong>Source: DG of Disease Control and Environmental <strong>Health</strong>, Ministry of <strong>Health</strong> RI, 2011NCDR from 2005 to <strong>2010</strong> remained declined from 8.99 per 100,000population in 2005 to 7.22 per 100,000 population in <strong>2010</strong>. The MB cases remaineddecreased as well as NCDR from 2005 to <strong>2010</strong>. Meanwhile PB cases rose from 3,033cases in 2009 to 3,278 cases in <strong>2010</strong>.DG of Disease Control and Environmental <strong>Health</strong> has classified provinces in<strong>Indonesia</strong> into two groups of leprosy burden. They are high endemic province andlow endemic province. Provinces with NCDR > 10 per 100.000 population or newcases more than 1,000 are classified as high endemic. Provinces are classified as lowendemic when NCDR < 10 per 100,000 population. Description of leprosy burdensituation in 33 provinces are given on the graph as follows.GRAPH 3.19LEPROSY BURDEN IN INDONESIA, <strong>2010</strong>Source: DG of Disease Control and Environmental <strong>Health</strong>, Ministry of <strong>Health</strong> RI, 2011There are two indicators used on leprosy control i.e proportion of secondgrade deformity, and proportion of children among new cases. Proportion of secondgrade deformity may indicate performance of new case detection, and proportion of55
children (0‐14 years of age) among new cases can indicate transmission oncommunity. Proportion of second grade deformity in <strong>2010</strong> was 10.71%, andproportion of children (0‐14 years of age) among new cases was 11.19%.GRAPH 3.20PROPORTION OF SECOND GRADE DEFORMITYAND PROPORTION OF CHILDREN (014 YEARS) AMONG NEW CASESIN INDONESIA, 2001<strong>2010</strong>Source: DG of Disease Control and Environmental <strong>Health</strong>, Ministry of <strong>Health</strong> RI, 2011The Graph 3.20 illustrates that proportion of second grade deformity rosefrom 2002 to <strong>2010</strong>. There were rising rising trend of proportion of children from2005 to 2009. It slighly declined from 11.44% in 2009 to 11.19 in <strong>2010</strong>. Furtherinformation of leprosy are on Annex 3.22.f. YawsYaws may lead to disability when there are no proper case managementconducted. It is mostly found on areas with low accessibility of health care, and poorpersonal hygiene. Obstacle on accessing safe water may hinder eradication of yaws.The disease still remained as health burden although its prevalence was lowerthan 1 per 100,000 population. Yaws prevalence decreased dramatically from 2.21 in1985 to almost zero in 1995. After 1995, yaws control were no longer one of priorityprogram and the disease control were inadequate. Therefore yaws prevalence slowlydecreased after 1995. Cases and prevalence of yaws are given on the following Graph3.21.56
GRAPH 3.21PREVALENCE OF YAWS IN INDONESIA, 2005<strong>2010</strong>Source: DG of Disease Control and Environmental <strong>Health</strong>, Ministry of <strong>Health</strong> RI, 2011The graph explains that cases and prevalence of yaws significantly increasedfrom 2008 to <strong>2010</strong>. The increased occured due to intensification of case detection as apart of yaws eradication program.In order to achieve yaws eradication in 2005, Subdirectorate of Leprosy andYaws conducted Serology Survey in <strong>2010</strong> at 10 districts with no cases were found onlatest three years. When the survey reported no cases are found on the districts, theywill receive sertificate of free yaws from WHO. Case detection intensification ofleprosy and yaws are also implemented in areas with high cases of yaws.4. Preventable Diseases Through Immunization (PD3I)a. Tetanus NeonatorumTetanus Neonatorum (TN) is caused by Clostridium tetani infecting throughwound. The disease infects new born due to umbilical cord cut with unsterile decives.It is mostly found on low‐middle income countries especially with low percentage ofdelivery attended by health personnel.There were 147 cases, 84 deaths and 57.14% of CFR in <strong>2010</strong>. Cases found in<strong>2010</strong> were lower than TN cases in 2009 of 158 cases and 76 deaths. There were 19provinces reported TN cases and 14 provinces reported deaths in <strong>2010</strong>.In terms of immunization status, 54.4% of all cases were found onunvaccinated population. Based on risk factors of delivery attendant, TN cases weremostly found on traditional attendant with 67.3% of all cases. In terms of umbilicalcord treatment, most of cases were found on traditional group with 36.1% of allcases. More description by provinces of the disease and risk factors are on Annex3.23.57
. MeaslesMeasles is caused by infection of measles virus. It mostly infects childrenthrough secret containing virus from infected people. The following graph explainsIncidence Rate (IR) of measles by provinces.GRAPH 3.22INCIDENCE RATE (IR) OF MEASLES PER 10,000 POPULATIONBY PROVINCE IN INDONESIA, <strong>2010</strong>Source: DG of Disease Control and Environmental <strong>Health</strong>, Ministry of <strong>Health</strong> RI, 2011There were 17,139 cases found with Incidence Rate (IR) at 0.73 per 10,000population in <strong>2010</strong>. Province with the highest IR was Riau Islands of 3.51 per 10,000population, followed by DI Yogyakarta of 2.35 per 10,000 population, and Banten of2.21 per 10,000 population. Meanwhile, Maluku had the lowest IR of 0 per 10,000population, followed by Southeast Sulawesi of 0.01 per 10,000 population, and WestNusa Tenggara of 0.05 per 10,000 population. Number of cases during measlesoutbreak were 2.570 cases with 6 deaths.Further information concerning to measles by provinces can be seen on Annex3.24, 3.25, 3.26, 3.27, and 3.28.c. DiptheriaDiptheria is caused by Corynebacterium diphtheriae infecting respiratorysystem. It can be indicated through i.e stiff on neck, light fever, and pharingitis, andgrey membrane covered tonsil and respiratory track.Number of diptheria cases in <strong>2010</strong> were 385 cases. In terms of age group,cases on < 1 years, 1‐3 years, 4‐9 years, 10‐14 years, and > 14 years were 9 cases, 138cases, 141 cases, 54 cases, and 43 cases.58
GRAPH 3.23NUMBER OF DIPTHERIA CASES BY AGE GROUP (YEAR)IN INDONESIA, <strong>2010</strong>Source: DG of Disease Control and Environmental <strong>Health</strong>, Ministry of <strong>Health</strong> RI, 2011Further information of diptheria by provinces can be seen Annex 3.29, andAnnex 3.30.d. Polio and AFP (Acute Flaccid Paralysis)Polio is one of communicable disease that can be prevented throughimmunization. It is caused by polio virus infecting nervous system and leading toparalysis. Polio commonly infects children on 0‐3 years of age. The disease can beindicated through symptoms i.e fever, headache, nausea, stiff on neck, and ilness onleg and feet.Meanwhile AFP is an abnormal condition when there is a degradation ofmuscle strength due to uncertain causes. The abnormality may continue to paralysis.In order to measure performance of AFP surveillance, DG of Disease Control andEnvironmental <strong>Health</strong> has established Non Polio AFP Rate. It may indicate non polioAFP cases among children < 15 years of age. DG of Disease Control and Environmental<strong>Health</strong> has established minimun target of the indicator at 2 per 100,000 children < 15years of age. Non polio AFP rate in <strong>2010</strong> was 2.62 per 100,000 children < 15 years ofage. The following graph describes non polio AFP rate per 100,000 children < 15years of age in 33 provinces.59
GRAPH 3.24NON POLIO AFP RATE PER 100,000 CHILDREN < 15 YEARS OF AGEIN INDONESIA, <strong>2010</strong>Source: DG of Disease Control and Environmental <strong>Health</strong>, Ministry of <strong>Health</strong> RI, 2011Province with highest non polio AFP rate was North Sulawesi at 6.2 per100,000 children < 15 years of age, followed by Gorontalo and DI Yogyakarta at 5.67and 4.83 per 100,000 children < 15 years of age. Meanwhile province with the lowestnon polio AFP rate was North Maluku at 1 per 100,000 children < 15 years of age,followed by Central Kalimantan and West Sulawesi at 1.33 and 1.67 per 100,000children < 15 years of age. Further descripton of AFP can be seen on Annex 3.31.5. Potential Outbreak DiseaseThere are several diseases causing outbreak in <strong>Indonesia</strong> i.e DengueHemorrhagic Fever (DHF), Diarrhea, and Chikungunya. Outbreak of the diseases mayaffect to deaths and economic loss.a. Dengue Haemorrhagic Fever (DHF)The disease caused by infection of Dengue virus. Transmission of DHF occuredwhen Aedes aegypty, vector caring the virus biting people. Although DHF mostlyoccured on children under 15 years of age, adult can also be infected by the virus.There were 156,086 cases of DHF with 1,358 deaths in <strong>2010</strong>. Indicatorsindicates magnitude of the DHF burden are Incidence Rate (IR) per 100,000population and Case Fatality Rate (CFR). IR of DHF in <strong>2010</strong> was 65.7 per 100.000population. The number is lower than 2009, with 68.22 per 100,000 population. CFRof DHF decreased as well as IR, from 0.89% in 2009 to 0.87 in <strong>2010</strong>.60
GRAPH 3.25INCIDENCE RATE OF DHF PER 100.000 POPULATIONAND CASE FATALITY RATE DHF IN INDONESIA, 2005<strong>2010</strong>Source: DG of Disease Control and Environmental <strong>Health</strong>, Ministry of <strong>Health</strong> RI, 2011From the above graph, there was declining trend of CFR from 2005 to 2009. Itslightly increased from 2008 to 2009. Meanwhile IR per 100,000 populationincreased from 2005 to 2007.Province with the highest IR was Bali of 337.04 per 100,000 population,followed by DKI Jakarta of 227.44 per 100,000 population and East Kalimantan of167.31 per 100,000 population. Meanwhile province with the lowest IR was Malukuof 0.42. per 100,000 population, followed by Jambi of 5.99 per 100,000 population,and West Kalimantan of 13.86 per 100,000 population. IR of DHF by provinces aredescribed on the graph as follows.GRAPH 3.26INCIDENCE RATE OF DHF PER 100.000 POPULATIONIN INDONESIA, <strong>2010</strong>Source: DG of Disease Control and Environmental <strong>Health</strong>, Ministry of <strong>Health</strong> RI, 2011Province with the highest CFR was Maluku of 16.67%, followed by BangkaBelitung Islands of 4.39% and North Maluku of 3.46%. Meanwhile province with thelowest CFR was West Papua and West Sulawesi, when there were no cases reported,61
and DKI Jakarta of 0.17%. The following Graph 3.27 explains CFR of DHF on 33provinces in <strong>Indonesia</strong>.GRAPH 3.27CASE FATALITY RATE OF DHF (%) IN INDONESIA, <strong>2010</strong>Source: DG of Disease Control and Environmental <strong>Health</strong>, Ministry of <strong>Health</strong> RI, 2011Percentage of districts/municipalities infected DHF in <strong>2010</strong> was 80.48%. Thepercentage was higher than 2009 of 77.26%. Percentage of infecteddistricts/municipalities are described on the map as follows.GRAPH 3.28PERCENTAGE OF DISTRICTS/MUNICIPALITIES INFECTED BY DHFIN INDONESIA, <strong>2010</strong>Source: DG of Disease Control and Environmental <strong>Health</strong>, Ministry of <strong>Health</strong> RI, 2011Details of DHF by provinces can be seen on Annex 3.32 and Annex 3.33.b. DiarrheaDiagnosis of diarrhea is confirmed when there is a change of feces consistency,and frequency of defecation. Feces of people with diarrhea are usually more liquidthan normal condition. The defecation of people with diarrhea are three times ormore frequent than normal condition.There were 11 provinces reported diarrhea outbreak in <strong>2010</strong> with 4,204 casesand 73 deaths. Case Fatality Rate in <strong>2010</strong> was 1.74%. CFR of diarrhea from 2006 to<strong>2010</strong> are explained on the graph as follows.62
GRAPH 3.29CASE FATALITY RATE (CFR) ON DIARRHEA OUTBREAKIN INDONESIA, 2006 – <strong>2010</strong>Source: DG of Disease Control and Environmental <strong>Health</strong>, Ministry of <strong>Health</strong> RI, 2011The above graph describes significant increase of CFR from 1.79% in 2007 to2.94% in 2008. It declined to 1.74% in 2009 and <strong>2010</strong>. The decrease of CFR mayoccure due to improvement of case management.Outbreak in 33 provinces can be seen on the following map.GRAPH 3.30DIARRHEA IN INDONESIA, <strong>2010</strong>Source: DG of Disease Control and Environmental <strong>Health</strong>, Ministry of <strong>Health</strong> RI, 2011More details of diarrhea by provinces are on Annex 3.34.c. ChikungunyaChikungunya is an acute infection with main symptoms i.e fever, rash on skinand arthritis. It is caused by chick virus transmitted through bites of Aedes aegyptiand Aedes albopictus. Chikungunya mostly found on tropical or subtropical region.Epidemic of chikungunya may occur when there is poor herd immunity and highdensity of vectors. During rainy season, mounted of breeding places led to dramaticincrease of vectors.The disease affected on 20 provinces in <strong>2010</strong> with 53,899 cases and nonedeaths were reported.63
GRAPH 3.31NUMBER OF CHIKUNGUNYA CASES IN INDONESIA, <strong>2010</strong>Source: DG of Disease Control and Environmental <strong>Health</strong>, Ministry of <strong>Health</strong> RI, 2011Increase of cases also occured due to high population mobilization in manyareas. Further description of chikungunya can be seen on Annex 3.35.d.RabiesRabies is caused by infection of rabies virus transmitted through animal bitesi.e i.e dog, cat, bat, monkey, raccoon and wolf. It has spread to 24 provinces in<strong>Indonesia</strong>. Up to <strong>2010</strong>, there were only nine provinces reported no rabies cases i.eBangka Belitung Islands, DKI Jakarta, DI Yogyakarta, Central Java, East Java, WestNusa Tenggara, West Kalimantan, West Papua, and Papua.There are three indicators used on rabies control programs i.e animal bites(GHPR), vaccinated cases (VAR), and Lyssa. The following graph describes those from2004 to <strong>2010</strong>.GRAPH 3.32ANIMAL BITES INFECTED RABIES (GHPR), VACCINATED CASES (VAR), AND LYSSAIN INDONESIA, 2004<strong>2010</strong>64Source: DG of Disease Control and Environmental <strong>Health</strong>, Ministry of <strong>Health</strong> RI, 2011
Above graph shows rising trend of GHPR and VAR from 2004 to <strong>2010</strong>. Therewere 78,203 GHPR cases, 63,334 VAR cases, and 206 LYSSA cases in <strong>2010</strong>. Provincewith highest cases of GHPR, VAR, and LYSSA in <strong>2010</strong> was Bali. It reported 60,434cases of GHPR, 52,775 cases of VAR, and 82 cases of LYSSA. Meanwhile four provincesreported cases of LYSSA in 2009 and scaled down the cases to none in <strong>2010</strong> wereAceh, Banten, East Kalimantan, and South Sulawesi. The following map illustratesinfected areas of Rabies.GRAPH 3.33RABIES INFECTED AREAS IN INDONESIA, <strong>2010</strong>Source: DG of Disease Control and Environmental <strong>Health</strong>, Ministry of <strong>Health</strong> RI, 2011Details of rabies by provinces in <strong>Indonesia</strong> are on Annex 3.36.e. FilariasisThere are three parasitic worms caused filariasis i.e Wuchereria bancrofti,Brugia malayi, and Brugia timori. They infect lymph tissue through mosquito bite. Onhuman body, worms become mature and live on lymph tissue. Those parasites causebig odema on leg, arm, breast, and genital part.GRAPH 3.34NUMBER OF FILARIASIS CASES IN INDONESIA, 2003<strong>2010</strong>Source: DG of Disease Control and Environmental <strong>Health</strong>, Ministry of <strong>Health</strong> RI, 201165
Cumulatiive cases of filariases up to <strong>2010</strong> were 11,969 cases. There were 356endemic districts/municipalities until <strong>2010</strong>. It means that 72% of alldistricts/municipalities in <strong>Indonesia</strong> are infected by filariasis.GRAPH 3.35FILARIASIS ENDEMIC DISTICTS/MUNICIPALITIESIN INDONESIA, <strong>2010</strong>Source: DG of Disease Control and Environmental <strong>Health</strong>, Ministry of <strong>Health</strong> RI, 2011Endemicity status of district/municipality is determined through survey ofblood finger. Further information concerning to filariasis cases by provinces are onAnnex 3.37.f. PestPest or bubonic plaque is caused by infection of Pasteurella pestis throughrodents bite. There were 5 districts on 4 provinces determined as pest focus area i.e :1. Pasuruan, East Java2. Sleman, DI Yogyakarta3. Boyolali, Central Java4. Bandung and Cirebon, West JavaActive and pasive rodent surveillance are still conducted on those focus areasin order to prevent outbreak. Latest outbreak occured on Sulorowo, Kayukebekvillage, Tutur Nongkojajar sub district, Pasuruan, East Java in 2007. There was onespecimen of human tested on Pasuruan and confirmed as negative. Meanwhile, therewere 407 specimens of rodents tested on Sleman. Within those specimens on Sleman,34 specimens confirmed as positive. Further data and information about pest can beseen on Annex 3.38.66
g. LeptospirosisLeptospirosis is transmitted through rodent urine containing leptospirosisbacteria. Expossure to water or soil contaminated by the urine may occure infection.Symptoms of the disease ranges from influenza to serious illnes leading to death.Cases are frequently found on flood affected areas.Cases reported in <strong>2010</strong> were higher than that of cases in 2009. There were409 cases were found in <strong>2010</strong> while 335 cases were found in 2009. Most of cases in2009 and <strong>2010</strong> were reported from Central Java and DI Yogyakarta. The followinggraph illustrates cases and CFR of leptospirosis from 2005 to <strong>2010</strong>.GRAPH 3.36NUMBER OF CASES, DEATHS, AND CFR OF LEPTOSPIROSISIN INDONESIA, 2005<strong>2010</strong>Source: DG of Disease Control and Environmental <strong>Health</strong>, Ministry of <strong>Health</strong> RI, 2011From the graph, it shows that leptospirosis cases reached the peak in 2007 of664 cases and 55 deaths. Flood affected at many areas on the year, especially DKIJakarta. CFR declined dramatically from 12.17% in 2005 to 5.16% in 2008. Itincreased afterwards to 10.51% in <strong>2010</strong>. Detail information of leptospirosis byprovinces can be seen on Annex 3.39.h. AntraxAntrax is caused by infection of Bacillus anthracis. The bacil is zoonotic,therefore it may infect ruminantia and carnivore. Those infected animals can transmitthe disease to human and leading to death. There were 31 cases and 1 death(CFR=3.2%) reported in <strong>2010</strong>. One death case was digestive type. Cases, deaths, andCFR of antrax from 2005 to <strong>2010</strong> are described on the graph as follows.67
GRAPH 3.37NUMBER OF CASES, DEATHS, AND CFR OF ANTRAXIN INDONESIA, 2005<strong>2010</strong>Source: DG of Disease Control and Environmental <strong>Health</strong>, Ministry of <strong>Health</strong> RI, 2011Within those 31 cases, 24 cases were reported from Klaten, Central Java, and 7cases were reported from Maros, South Sulawesi. From the above graph, CFRdecreased from 12 % in 2009 to 3.2% in <strong>2010</strong>. Further information by provinces ofantrax are on Annex 3.40.i. Avian InfluenzaAvian Influenza is acused by infection of H5N1 virus frequently infectingpoultry and rarely infecting pig. The disease can transmit to human and causingdeath. First cases in <strong>Indonesia</strong> was reported on June, 2005. Cases, deaths, and CFR ofAvian Influenza from 2005 to <strong>2010</strong> are on the following Graph 3.38.GRAPH 3.38NUMBER OF CASES, DEATHS, AND CFR OF AVIAN INFLUENZAIN INDONESIA, 2005<strong>2010</strong>Source: DG of Disease Control and Environmental <strong>Health</strong>, Ministry of <strong>Health</strong> RI, 2011Based on the graph, cases and deaths reached the peak in 2006 with 55 casesand 45 deaths. They declined afterwards to 9 cases and 7 deaths in <strong>2010</strong>. Meanwhile,CFR reached the peak in 2009 of 90.48%. It declined to 77.78% in <strong>2010</strong>.68
There were three provinces with highest cumulative cases since 2005 to <strong>2010</strong>i.e DKI Jakarta, West Java, and Banten.GRAPH 3.39NUMBER OF CASES AND DEATHS OF AVIAN INFLUENZAIN 13 PROVINCES, 2005<strong>2010</strong>Source: DG of Disease Control and Environmental <strong>Health</strong>, Ministry of <strong>Health</strong> RI, 2011The following map classifies provinces in <strong>Indonesia</strong> into two categories i.ewith cases and no cases, from 2005 to <strong>2010</strong>.GRAPH 3.40INFECTED AREAS OF AVIAN INFLUENZAIN INDONESIA, 2005<strong>2010</strong>Source: DG of Disease Control and Environmental <strong>Health</strong>, Ministry of <strong>Health</strong> RI, 2011From the map, it shows that Avian Influenza has spread to 13 provinces in<strong>Indonesia</strong>. Further information concerning to Avian Influenza can be seen on Annex3.41.***69
Generally, health efforts consist of two main factors, community and individuhealth efforts. Community health effort is all activities conducted by governmentand/or community and private in order to maintain and improve health as well asprevent and control health problems in community. The community health effortscover health promotion, health sustainability, communicable disease control,noncommunicable disease control, basic sanitation supply and environmental health,community nutrition development, mental health, medical devices andpharmaceutical equipment control, usage controls of addictive substance in food andbeverage, narcotics, psychotropic and dangerous substances control, disasterresponse and humanity support.Meanwhile, individu health effort is all activities conducted by governmentand/or community and private in order to maintain and improve health condition aswell as prevent and cure the disease and heal the individual health. It covers healtheducation, diseases control, outpatient care, inpatient care, and paralysis cure andcontrol, headed to the individual.The following is description of health efforts for the last years, especiallyduring <strong>2010</strong>.A. PRIMARY HEALTH CAREPrimary health care is a crucial way in providing health service to public. Byrapid and appropriate primary health service, most public health problems could bemanaged. The primary health care is provided by health personnel as follows:1. Child and Maternal <strong>Health</strong> ServiceMaternal and neonatal health policies specifically related to newborn,delivery, postpartum and antenatal cares provided in all types of healthcarefacilities, from posyandu to government hospitals and private health care facilities.Child health includes infants, underfives and teenagers.Maternal Mortality Rate (MMR), Neonatal Mortality Rate (NMR), InfantMortality Rate (IMR) and Underfive Mortality rate (U5MR) are indicators ofcommunity health status. Today, MMR and IMR in <strong>Indonesia</strong> are still highcomparing to other ASEAN member states. <strong>Indonesia</strong> <strong>Health</strong> and Demographic71
Survey (SDKI) 2007 recorded MMR 228 per 100,000 live births, IMR 34 per 1,000live births, NMR 19 per 1,000 live births and U5MR 44 per 1,000 live births.In achieving Millenium Dvelopment Goals (MDGs) and health developmentgoals, one priority is to improve maternal health service by reducing MaternalMortality Rate into 102 per 100,000 live births in 2015 from 425 per 100,000 livebirths in 1992 (Household <strong>Health</strong> Survey/SKRT). Reducing maternal mortalityrequires efforts related to pregnancy, delivery and the postpartum period.Efforts to accelerate the decline of MMR have been initiated since end of1980s through Safe Motherhood Initiative, which received significant attention andsupport from various parties both national and international. At the end of 1990s,more efforts have conceptually been intriduced to sharpen the strategies andinterventions in reducing maternal mortality rate through the Making PregnancySafer (MPS) which was announced by the government in 2000.a. Antenatal Care (1st and 4th visit)Antenatal care is a health service by skilled health personnel to a womanduring her pregnancy, based on standard antenatal care stated in midwiferystandard services (SPK). Skilled health personnel providing antenatal care areobstetricians, doctor, midwife and nurse.Standard antenatal care involves body weighing, height measurement, blodpressure, nutrition status (upper arm circumference), measuring height of uterifundus, determining fetal presentation and fetal heart rate (DJJ), screening oftetanus immunization status and giving Toxoid Tetanus immunization (TT) whenneeded, supplementation of at least 90 iron tablets during pregnancy, laboratorytest (routine and specific), case management, counseling, delivery planning andcomplication prevention (P4K) and family planning after delivery.The antenatal care is complete when the service is provided by skilledhealth personnel and meets the standard. The frequence distribution of antenatalcare has been set into at least 4 times during pregnancy, with suggested time ofservice as follows: the minimum of 1 time at first trimester, 1 time at secondtrimester and twice at third trimester. This suggested standard of antenatal careperiod aims to give protection to pregnant woman in the form of risk factor earlydetection and pregnancy complication protection and management.The achievement of antenatal health service is evaluated by using coverageof 1 st and 4 th visit of pregnant woman (K1 and K4). The K1 is calculated by dividingtotal pregnant woman getting 1 st antenatal care from health personnel by target ofpregnant women in the working area during 1 year. The K4 is calculated bydividing total pregnant woman getting minimum 4 times standard antenatal carefrom health personnel in certain area at a certain time by target of pregnantwomen in the working area during 1 year.72
Graph 4.1 presents coverage of K1 and K4 of pregnant woman during thelast six years. The coverage of K1 during 2004 to <strong>2010</strong> continued to grow from88.09% in 2004 to 95.26% in <strong>2010</strong>, while the coverage of K4 in during 2004‐<strong>2010</strong>was likely to increase from 77% in 2004 to 85.56% in <strong>2010</strong>.GRAPH 4.1COVERAGE OF ANTENATAL CARE (1 ST AND 4 TH VISIT OF PREGNANT WOMEN)IN INDONESIA, 2004 – <strong>2010</strong>Source: DG of Nutrition and Maternal and Child <strong>Health</strong>, MoH RIIn the picture above, it can be seen the coverage gap between K1 and K4. In2004, the difference between K1 and K4 was 11%. It decreased to 10% in 2006and to 6.6% in 2008. In 2009, the difference of K1 and K4 coverage increased to9%. The differences indicate K1‐K4 drop out; in other word, the fewer difference ofK1 and K4 kecil means almost all pregnant women getting 1 st antenatal carecontinued until the 4 th care at the 3 rd trimester, so that the pregnancy could bemonitored by health personnel.GRAPH 4.2COVERAGE OF ANTENATAL CARE (1 ST VISIT)<strong>2010</strong>Source: DG of Nutrition and Maternal and Child <strong>Health</strong>, MoH RI73
Graph 4.2 presents achievement of K1 coverage in <strong>2010</strong>, which shows thatthe indicator has met K1 target of 95.26%. DKI Jakarta and Banten were twoprovinces with K1 coverage of 100%, while Papua was province with the lowestcoverage of 53.55%.Of total 33 provinces, 27 provinces (81.8%) had coverage more than 90%.Other 3 provinces had coverage between 80‐90%, while Papua, Riau Islands andWest Papua had coverage of 53.55%, 73.53% and 79.52%. Therefore, efforts areneeded to accelerate maternal health service, especially in those last threeprovinces.During <strong>2010</strong>, achievement of K4 service coverage nationally in <strong>Indonesia</strong>was 85.56%, which means <strong>Indonesia</strong> had met target of MoH strategic plans(renstra) for K4 coverage in <strong>2010</strong> of 84%. Other 20 provinces had also met K4target. Provinces on three highest K4 coverages were DKI Jakarta (94.01%), Bali(92.23%) and Bangka Belitung Islands (91.61%). Meanwhile, three provinces withlowest K4 coverage were Papua (20.90%), West Papua (48.03%) and East NusaTenggara (56.39%). Further description can be seen in Graph 4.3 below.GRAPH 4.3COVERAGE OF ANTENATAL CARE (4 TH VISIT)<strong>2010</strong>RENSTRATARGET<strong>2010</strong> : 84%74Source: DG of Nutrition and Maternal and Child <strong>Health</strong>, MoH RIK4 coverage by province according to Riskesdas <strong>2010</strong> can be seen onGraph 4.4 below. There were only 2 provinces with coverage more than 84% ofpregnant women aged 10‐59 years old did K4 (4 th visit) on the last pregnancy.Those 2 provinces were DI Yogyakarta and DKI Jakarta. Meanwhile, 4 provinceshad coverage 68% ‐ 84%, 11 provinces had 52%‐68% and 16 provinces had lessthan 52%. Provinces in the eastern <strong>Indonesia</strong> included in the last group.
GRAPH 4.4PERCENTAGE OF PREGNANT WOMEN AGED 1059 YEARS GOT K4 HEALTH SERVICEON THEIR LAST PREGNANCY, <strong>2010</strong>Source: National Board of <strong>Health</strong> Research and Development, MoH RI, Riskesdas <strong>2010</strong>Riskesdas <strong>2010</strong> shows that 92.7% women aged 10‐59 years did pregnancyexamination at least once during the last pregnancy, tahun yang melakukanpemeriksaan kehamilan minimal 1 kali pada kehamilan anak terakhir, withoutconsidering the time of examination. Meanwhile, 72.3% examined their pregnancy(1 st visit or K1) in the 1 st trimester, and 61.4% did K4 or 4 th visit of pregnancyexamination. It means almost 11% pregnant women did K1 pregnancyexamination during 1 st trimester but did not do examination until 4 th visit (K4). Onthe other hand, most pregnant women who did K1 pregnancy examination in the1 st trimester would do examination until at least 4 times in the 3 rd trimester.According to the same research, there was percentage gap of K4 pregnancyexamination in ruban and rural areas. In urban, coverage of K4 preganancyexamination was 76.2%, while in rural was 55.7%.Some factors are considered influencing K4 pregnancy examination. Thosefactors are education level, mother’s occupation and socio‐economic level. In thegroup of women did not attend school, only 31.6% pregnant women did the K4examination, while in the group of women who were primary school graduates,junior high school graduates, senior high school graduates and higher educationgraduates, the coverage of K4 examination were 50.2%, 63.7%, 74.8% and 84.5%.According to type of occupation, 45.6% women who work as farmer/fisher/labordid K4 examination. On the contrary, about 81% women who work as civilservants/armed forces/employee did K4 pregnancy examination. According tosocio‐economic level, it is described by expenditure per capita (quintile). Quintile 1is 20% the lowest expenditure per capita, and quintile 5 is 20% the highestexpenditure per capita. The higher quintile of expenditure per capita, the higherpregnant women did K4 pregnancy examination. On the quintile 1, there was only47.5% K4 examination, while on the quintile 3, there was 63.6%, and on thequintile 5, there was 79.7%.75
. Delivery Attendance by Midwifery Skilled <strong>Health</strong> Personnel (Pn)Delivery is a maternal period having big contribution to Maternal MortalityRate (MMR) in <strong>Indonesia</strong>. Mortality during delivery and within one week afterdelivery is estimated 60% of all maternal mortality (Maternal Mortality: who, when,where and why; Lancet 2006). In MDG’s target, one effort to improve maternalhealth is by reducing maternal mortality rate to 102 per 100,000 live births in2015 from 425 per 100,000 live births in 1992 (SKRT) and by increasing coverageof delivery attendance by skilled health personnel to 90% in 2015 from 40.7% in1992 (BPS). Delivery attendance by skilled health personnel is a safe deliveryservice by health personnel with midwifery competency.Gambar 4.5 shows coverage of delivery attendace by skilled healthpersonnel since 2004 to <strong>2010</strong> tending to increase. In <strong>2010</strong>, the coverage in<strong>Indonesia</strong> was 84.78%.GRAPH 4.5COVERAGE OF DELIVERY ATTENDANCE BY HEALTH PERSONNELIN INDONESIA, 2004 – <strong>2010</strong>76Source: DG of Nutrition and Maternal and Child <strong>Health</strong>, MoH RIAchievement of 84.78% delivery attendance by skilled health personnel in<strong>2010</strong> describes that <strong>Indonesia</strong> had successfully met target of MoH strategicplanning <strong>2010</strong> of 84%. From Graph 4.6, three provinces with highest coveragewere Bali with 98.8%, East Java with 95.04% and Central Java with 91.9%.Meanwhile three provinces with the lowest coverage of Pn were Papua with25.2%, Riau Islands with 64.61% and West Papua with 65.97%.During <strong>2010</strong>, 15 provinces in <strong>Indonesia</strong> met target of delivery attendanceby skilled health personnel (84%). There are some efforts to improve deliverycoverage through maternal health priority program, such as partnership ofmidwife and traditional birth attendant (Kemitraan Bidan Dukun), improvement ofdelivery in health facilities through delivery program insurance, model rumahtunggu (a place near health facilities where pregnant woman can stay until thetime to delivery) in districts and Puskesmas (health center) in remote areas toprevent delivery complications, revitalization of coordinator midwife (Bidan
Koordinator) through facilitated supervision to improve quality of assistant andquality surveillance of maternal health through Monitoring Local Area of Child andMaternal <strong>Health</strong> (Pemantauan Wilayah Setempat Kesehatan Ibu dan Anak ‐ PWSKIA).GRAPH 4.6COVERAGE OF DELIVERY ATTENDANCE BY HEALTH PERSONNELBY PROVINCE, <strong>2010</strong>RENSTRA TARGET<strong>2010</strong> : 84%Source: DG of Nutrition and Maternal and Child <strong>Health</strong>, MoH RIRiskesdas <strong>2010</strong> shows 82.2% delivery assisted by skilled health personnel.The skilled health personnels include specialist, physician and midwife. There ispercentage gap of delivery assisted by health personnel in urban and rural areas.In urban, delivery assisted by helath personnel reached 91.4%, while in rural itwas only 72.5%. Expenditure per capita could be affecting the indicatorachievement. The higher expenditure per capita is the higher percentage ofdelivery assisted by health personnel. On the quintile 1 of expenditure per capita,delivery assisted by health personnel was 69.3%, while on the quintile 3 ofexpenditure per capita, it was 86.8%, and on the quintile 5, it was 94.1%.Delivery in health facility can reduce risk of maternal death because inhealth facility delivery is assisted by health personnel and there are adequate toolsto manage the possible complication that can harm mother and baby. Riskesdas<strong>2010</strong> describes percentage of delivery in health facility was 55.4%, while other43.2% delivery was in house or other places. The delivery in house, about 40.2%was assisted by non skilled health personnel, especially tradiosional birthattendant.Graph 4.7 indicates the low usage of health facility for delivery in ruralareas, which was only 35.2%. On the contrary, coverage of delivery in house/otherplaces was very high with 62.7%. It could be happened because of the limited77
access of delivery mother to health facility, such as geographical, economical andknowledge. Therefore, strategical efforts are very important to solve the limitedaccess that all deliveries can be assisted by health personnel in health facilities.GRAPH 4.7PERCENTAGE OF DELIVERY OF UNDERFIVE BY BIRTH HELPERBY TYPE OF AREA, RISKESDAS <strong>2010</strong>Source: National Board of <strong>Health</strong> Research and Development, MoH RI, Riskesdas <strong>2010</strong>Some deliveries carried out by abdominal surgery are because of medicaland psychological reasons. Riskesdas <strong>2010</strong> notes that 15.3% delivery was carriedout through surgery. Three highest provinces with delivery by abdominal surgerywere DKI Jakarta (27.2%), Riau Islands (24.7%) and West Sumatera (23.1%).Age, education, occupation and expenditure per capita of delivery womenare factors affecting choice of delivery by abdominal surgery. Pregnant womenaged > 35 years had relatively higher coverage of delivery with abdominal surgery(17.1%) comparing to preganant women aged
GRAPH 4.8CHARACTERISTIC OF DELIVERY BY ABDOMINAL SURGERYOF THE LAST UNDERFIVE, RISKESDAS <strong>2010</strong>Source: National Board of <strong>Health</strong> Research and Development, MoH RI, Riskesdas <strong>2010</strong>c. Postpartum <strong>Health</strong> Care (KF3)Postpartum health care is standard health service whithin 6 hours to 42days after delivery by health personnel. For early detection of postpartumcomplication, it is important to monitor the examination of postpartum motherthrough postpartum visit at least 3 times with distribution as follows: 1) 1 st visit(KF1) within 6 hours – 3 days after delivery; 2) 2 nd visit (KF2) in 2 nd week afterdelivery; and 3) 3 rd visit (KF3) in 6 th week after delivery. Postpartum visit isdefined as a contact of postpartum mother to health personnel either inside oroutside of health facility building (includes midwife in village/village maternalclinic (Polindes)/village health clinic (Poskesdes) dan home visits.The postpartum care includes: 1) taking blood pressure, pulse, respirationand body temperature; 2) examination of lochia and other vaginam expense; 3)examining breast condition and suggesting 6‐month exclusive breastfeeding; 4)twice (in 2 days) vitamin A 200,000 IU supplement; and 5) Family Planningservice.Coverage of postpartum care in <strong>2010</strong> was 73.48%, while target of coverageof postpartum visit by minimum standard service on health in 2015 is 90%.Bali was the province with the highest coverage of KF3 (96.68%). East Java(95.82%) and DI Yogyakarta (89.05%) were two provinces on the 2 nd and 3 rdhigher position. From 33 reporting provinces, Bali and East Java had met target ofminimum standard service (SPM) on health in 2015 for postpartum care. Threeprovinces with the lowest coverage were Papua (14.21%), Central Sulawesi(19.52%) and West Papua (35.78%).Graph 4.9 below presents percentage of postpartum care by province in<strong>Indonesia</strong>.79
GRAPH 4.9COVERAGE OF POSTPARTUM CARE (KF3)BY PROVINCE, <strong>2010</strong>Source: DG of Nutrition and Maternal and Child <strong>Health</strong>, MoH RIOne of postpartum care is Vitamin A. The following Graph 4.10 showspercentage of postpartum mother got Vitamin A on the last underfive delivery byprovince in <strong>2010</strong>.GRAPH 4.10PERCENTAGE OF POSTPARTUM MOTHER GOT VITAMIN AON THE LAST UNDERFIVE DELIVERY BY PROVINCE, <strong>2010</strong>Source: National Board of <strong>Health</strong> Research and Development, MoH RI, Riskesdas <strong>2010</strong>80
Nationally, postparum mother getting vitamin A was 52.2%, relatively lowcomparing to coverage of postpartum care. Coverage of postpartum mother gettingvitamin A in <strong>Indonesia</strong> was less than 70%, it even was less than 50% in 19provinces.d. Obstetric and Neonatal Complication TreatmentHigh risk or complication is an abnormal condition which directly causesmother and infant fatalities and mortalities. Obstetric complication includespremature rupture of membranes, bleeding per vaginam, high blood pressure(sistole > 140 mmHg, diastole > 90 mmHg) with or without pre tibial oedema,premature delivery, serious infection, dystocia (abnormal or difficult delivery) andinfection during postpartum.Graph 4.11 presents coverage of obstretic complication treatment byprovince in <strong>2010</strong>. Average coverage in <strong>2010</strong> was 58.8%. Target of MinimumService Standard on health for obstretic complication treatment in 2015 is 80%.From 33 provinsi, there were only 3 provinces having coverage more than 80%,those were West Sumatera (84.4%), West Nusa Tenggara (83.2%) and DIYogyakarta (82.7%).GRAPH 4.11COVERAGE OF OBSTRETIC COMPLICATION TREATMENTBY PROVINCE, <strong>2010</strong>TARGET OF SPM2015: 80%Source: DG of Nutrition and Maternal and Child <strong>Health</strong>, MoH RINeonatal high risk/complication includes asphyxia, tetanus neonatorum,sepsis, birth trauma, low birth weight < 2,500 gram, respiratory syndrome andneonatal abnormalities. Handled neonatal complication is neonatal complicationgetting treatment from skilled health personnels, those are doctor and midwife in81
Polindes (village maternal clinic), Puskesmas (health center), maternal clinic andhospital.In <strong>2010</strong>, coverage of neonatal complication treatment was reported25.23%, with wide range coverage among provinces from 1.10% to 82.29%.Meanwhile, target of Minimum Service Standard on health in <strong>2010</strong> is 80%. Itmeans the coverage in <strong>2010</strong> had not met the target. Description of neonatalcomplication treatment by province is presented in Graph 4.12 below.GRAPH 4.12COVERAGE OF NEONATAL COMPLICATION TREATMENTBY PROVINCE, <strong>2010</strong>TARGET SPM <strong>2010</strong>80%Source: DG of Nutrition and Maternal and Child <strong>Health</strong>, MoH RIProvince with the highest coverage was DI Yogyakarta with 82.29% and thelowest was South Sulawesi with 1.10%. Of total 33 provinces, 28 had coverage lessthan 50%. This low coverage of neonatal complication treatment requires extraattention for it is a strategic step to decrease infant mortality rate.e. Neonatal Visit82Neonates or 0‐28 day newborn infant is an age group having highest risk ofhealth problem. <strong>Health</strong> efforts to minimize the risk are providing delivery assistedby skilled health personnel in health facility and health care during neonatal visitsubject to the standard.Riskesdas tahun 2007 notes that most neonate death (78.5%) happenedwithin the 1 th week of life (0‐6 day). Considering the high risk of death within the1 st week of life, every newborn should get more frequent standardizedexamination in their 1 st week of life to detect whether there is a disease orabnormality in order to intervence as soon as possible to prevent neonatal death.
Relating to it, in 2008 there is a policy change on neonatal visit from twice (onewithin 1 st week and one within 8‐28 days) to 3 times (twice within 1 st week of life).Therefore, schedule of neonatal visits are within age of 6‐48 hours, 3‐7 days and 8‐28 days.The neonatal care in accordance to standard on integrated management ofyoung underfive (Manajemen Terpadu Balita Muda MTBM) includes examinationof vital signs, counseling of newborn care and exclusive breastfeed, supplement ofVitamin K1, immunization (if not given at birth), case management and referral,and promotion of neonatal care at home using Maternal and Child <strong>Health</strong> Book(KIA).Neonatal health service is described by coverage of neonatal visit. Coverageof 1 st neonatal visit (KN1) due to routine report in <strong>2010</strong> was 80%. It had not metthe expected target of 82%. Graph 4.13 shows coverage of 1 st neonatal visit (KN1)by province in <strong>2010</strong>.GRAPH 4.13COVERAGE OF NEONATAL VISIT (KN1)BY PROVINCE, <strong>2010</strong>TARGET RENSTRA<strong>2010</strong> : 82%Source: DG of Nutrition and Maternal and Child <strong>Health</strong>, MoH RIThere were 25 provinces (76%) had met the target of 1 st neonatal visit<strong>2010</strong>, which is 82%. Three provinces with highest coverage of KN1 were Bali with99.23%, Central Java with 98% and East Java with 97%. Three provinces withlowest coverages were Papua 32.53%, West Papua 42.60% and North Maluku45.30%.Trend of complete neonatal visit coverage (KN complete) during 2003‐<strong>2010</strong>can be seen in Graph 4.14 below. Since 2006 to <strong>2010</strong>, coverage of KN completetended to fluctuate. Average coverage in <strong>2010</strong> was 71.5%.83
GRAPH 4.14COVERAGE OF COMPLETE NEONATAL VISITIN INDONESIA, 2004 – <strong>2010</strong>Complete NeonatalVisit :KN1, KN2CompleteNeonatal Visit :KN1, KN2, KN3Source: DG of Nutrition and Maternal and Child <strong>Health</strong>, MoH RISince 2008, there have been changes on policy of visit time, from previouslyminimum 2 visits into 3 visits (socialized in 2008).Provinces had met <strong>2010</strong> target of 80% can be seen in Graph 4.15 below.GRAPH 4.15COVERAGE OF COMPLETE NEONATAL VISITBY PROVINCE IN <strong>2010</strong>RENSTRA TARGET<strong>2010</strong> : 80%84Source: DG of Nutrition and Maternal and Child <strong>Health</strong>, MoH RIThere were only 13 provinces met KN complete target of 80%. Threeprovinces with the highest coverage were Bali with 98.11%, Bangka BelitungIslands with 95.30% and East Java with 95%, while three provinces with thelowest coverage were South Sulawesi with 25.10%, West Papua with 31% ansPapua with 38.20%.
f. Infant <strong>Health</strong> CareInfant <strong>Health</strong> Care is standardized health service to infant provided byhealth personnel (physician, midwife and nurse) for minimum 4 times in a year –once within aged 29 days‐3 months, once within aged 3‐6 months, once withinaged 6‐9 months and once within aged 9‐11 months.The health care to infants includes basic immunization (BCG, DPT/ HB1‐3,Polio 1‐4, and Measles), early stimulation, detection and intervension of infants’growth (SDIDTK) and infant health care promotion. This indicator measurescapability of improvement to infant access to basic health care, early detection toabnormality or diseases, health sustainability, disease prevention and infantquality life improvement.In <strong>2010</strong>, coverage of infant health care was 84%, while target of strategicplan (Renstra) <strong>2010</strong> is 84%. It means coverage of infant health care in <strong>2010</strong> hadmet the target. There were 26 provinces (79%) had also met the target, and it canbe seen in Graph 4.16.GRAPH 4.16COVERAGE OF INFANT HEALTH CAREBY PROVINCE, <strong>2010</strong>RENSTRA TARGET<strong>2010</strong> : 84%Source: DG of Nutrition and Maternal and Child <strong>Health</strong>, MoH RIThree provinces with the highest coverage were Bali 97%, West Sumatera96.8% and Central Java 96.7%, while three provinces with the lowest coveragewere Papua 32.4%, West Papua 42% and North Maluku 55.9%. The achievementof infant health care is strongly influenced by Posyandu activity in every month,cadre roles, family participation to carry infant to Posyandu and personnel inPuskesmas to manage Posyandu.85
g. Underfive <strong>Health</strong> CareUnderfive health care is standardized health service to child aged 12 – 59months including growth monitoring at least 8 times in a year, developmentmonitoring at least twice in a year and vitamin A twice in a year (February andAugust).Growth monitoring is performed by weighing the body and measuring theheight in Posyandu, Puskesmas, hospital, midwife private practice and other healthfacilities. Development monitoring is performed by SDIDTK (stimulation, detectionand early intervention of growth and development) by health personnel. Vitamin Ais given by health personnel in health facility.In <strong>2010</strong>, coverage of underfive (1‐4 year old) by province can be seen in thefollowing Graph 4.17:GRAPH 4.17COVERAGE OF UNDERFIVE HEALTH CAREBY PROVINCE IN <strong>2010</strong>RENSTRA TARGET<strong>2010</strong> : 78%Source: DG of Nutrition and Maternal and Child <strong>Health</strong>, MoH RIThough averagely coverage of underfive health care had met the target, therewere 14 provinces (42%) having had not met the Renstra target of 78% in <strong>2010</strong> yet.Three highest coverages were by DI Yogyakarta with 97.69%, North Sumatera with91.81% and DKI Jakarta with 89.77%. On the contrary, three provinces with lowestcoverage were Papua, East Nusa Tenggara and West Kalimantan.Another indicator that is sensitive enough to capture health efforts tounderfive is D/S coverage, which is coverage of weighed to total underfive. Theweighed underfives are assumed having got standardized health services. Thefollowing is coverage of weighing underfive (D/S) by province.86
GRAPH 4.18COVERAGE OF WEIGHING UNDERFIVE (D/S)BY PROVINCE, <strong>2010</strong>RENSTRA TARGET<strong>2010</strong> : 65%Source: DG of Nutrition and Maternal and Child <strong>Health</strong>, MoH RITarget of Renstra on weighing underfive in <strong>2010</strong> is 65%. The averagecoverage of weighing underfive in <strong>2010</strong> was 67.87%, which means that target in<strong>2010</strong> had been fulfilled. There were 13 provinces (39%) had met target of Renstra<strong>2010</strong>. The province with the highest coverage was Aceh (78.3%) and the lowestwas Papua (30.8%).h. Primary School Student <strong>Health</strong> CareMany sources figure that health problems on school aged children aregetting more complex. At primary school aged children, the health issues usuallyrelate to healthy and clean life behavior (PHBS), such as brushing teeth properlyand washing hands with soap. Some health problems usually are dental caries,worm infastation, abnormal refraction/acuity of vision and nutritional problems.Therefore, health detection to primary students is needed, and the indicatoris number of primary school doing health detection to the 1 st grade. It is supposedto improve health quality of sdcool aged children.Graph 4.19 shows coverage of primary school doing health detection to 1 stgrade students. The average coverage was 61.08%. Comparing to target of Renstrain <strong>2010</strong> (80%), it is still far from the target.87
GRAPH 4.19COVERAGE OF PRIMARY SCHOOL DOING HEALTH DETECTION TO 1ST GRADE STUDENTSBY PROVINCE IN <strong>2010</strong>RENSTRA TARGET<strong>2010</strong> : 80%Source: DG of Nutrition and Child and Maternal <strong>Health</strong>, MoH RIThere were only 9 provinces (29%) met the target of 80%. Provinces on thethree highest positions were East Java (100%), DI Yogyakarta (100%) and Bali(97.36%), while provinces on the three lowest positions were Lampung (10.16%),Papua (12.20%) and Central Sulawesi (12.83%).2. Family Planning ServiceAccording to studies, woman reproductive age is usually between 15 – 49years. Therefore, to manage number of births and spacing births, usingcontraceptive becomes the best priority.Achievement status of family planning service is indicated by coverage offamily planning participants who are using/ever used contraceptives, newparticipant of family planning, family planning service facility and type ofcontraceptives used by acceptors.The average of family planning active acceptor in <strong>2010</strong> was 75.4%. Threeprovinces with the highest coverage were Bengkulu (89.9%), Gorontalo (85.6%)and Bali (85.3%), and provinces with the lowest coverage were Papua (48.4%),North Maluku (58.2%) and Riau Islands (64%).Target of minimum service standard (SPM) on health for active familyplanning acceptor in <strong>2010</strong> is 70%. Therefore, nationally it had been met the target,while by province, there were 7 provinces had not met the target.Proportion of married women aged 15‐49 years who are using/ever usedcontraceptives can be seen in Graph 4.20 below.88
GRAPH 4.20PERCENTAGE OF MARRIED WOMEN AGED 1549 YEAR WHO ARE USINGCONTRACEPTIVEBY PROVINCE IN <strong>2010</strong>TARGET OF SPM<strong>2010</strong> : 70%Source: National Family Planning Coordinating BoardProportion of active family planning acceptor by type of contraceptive in<strong>2010</strong> can be seen in Graph 4.21.GRAPH 4.21PERCENTAGE OF ACTIVE FAMILY PLANNING ACCEPTOR BY TYPE OF CONTRACEPTIVE<strong>2010</strong>Source: National Family Planning Coordinating BoardIn <strong>2010</strong>, of active family planning acceptor, 76.5% mostly used short‐termcontraceptive, especially injection (47.19%) and pill (26.81%). On the contrary,23.5% used long‐term contraceptive, especially vasectomy (MOP) with 0.68% asthe lowest proportion of contraceptive.89
By sex, method of contraceptive used by male are vasectomy ana condom(assuming that condoms are mostly used by male), while method of contraceptiveused by female are injection, pills, IUD, implant and tubectomy.Most active family planning acceptor is female with 96,82% and theremains is male with 3.18%. There is a wide gap between female and male on theparticipation of using contraceptives. Therefore, efforts to improve maleparticipation on using contraceptive are needed.According to method of contraceptive by province, IUD is mostly used inBali, DI Yogyakarta and DKI Jakarta. Those three provinces had coverage far abovethe national average of 11.03%. Bali had 47.34%, DI Yogyakarta had 24.57% andDKI Jakarta had 21.33%. Meanwhile, province with active family planning mostlyused tubectomy was North Sumatera with 7.71%. Percentage of family planningnew acceptor and active acceptor by methode of contraceptive and province can beseen on Annex 4.6 and Annex 4.8.Percentage of FP new acceptor service facility during 2007‐<strong>2010</strong> ispresented on Graph 4.22 below.GRAPH 4.22PERCENTAGE OF NEW FAMILY PLANNING ACCEPTOR BY SERVICE FACILITYIN INDONESIA, 2006 – <strong>2010</strong>90Source: National Family Planning Coordinating BoardBKKBN Data figures that service facilities of new family planning acceptorin <strong>2010</strong> did not have many differences with years before. Most new acceptors usedgovernment family planing clinic as their service facility (62.16%). In addition,30.28% new acceptors used midwife private practice.There were 3 provinces using government family planning clinic as servicefacility more than 90%. Those provinces were East Nusa Tenggara with 97.92%,West Sulawesi with 92.46% and West Nusa Tenggara with 90.66%. On thecontrary, in DKI Jakarta, Bali and DI Yogyakarta, government family planning clinicwas only used by 40%, but private family planning facilities (private familyplanning clinic, midwife private practice and physician private practice). Detail
new family planning proportion by service facility and province is presented inAnnex 4.7.3. Immunization ServiceInfant and children have higher risk of fatal infectious diseases, such as:diphteria, tetanus, hepatitis B, typhus, meningitis, pneumonia, etc. Therefore, thebest and vital prevention for these high‐risk groups is through immunization.The first time bacteria (antigen) enters the body, as a reaction the body willmake substances called antibodies. In general, the first reaction of body to makeantibody is not too strong because body has not had ”experience.” At the nextreaction, 2nd, 3rd, etc, the body already has memory to recognize the antigen thatthe formation of antobody occurs faster and in greater number. It is the reasonwhy to several diseases considered harmful, immunization or vaccination isimportant to do. This is a prevention to protect body infected by the diseases, or ifgetting infected, it does not cause fatal effect.a. Basic ImmunizationInfant basic immunization program (5 complete basic immunization)consists of 1 dosage of BCG, 3 dosages of DPT, 4 dosages of Polio, 4 dosages ofHepatitis B and 1 dosage of measles.Among kinds of disease that can be prevented by vaccine, measles is themain cause of underfive death. Therefore, measles prevention is an importantfactor to reduce underfive mortality rate. One of some points in InternationalMeeting on Child is sustaining measles vaccination coverage of 90%. This target isalong with target of strategic planning of Ministry of <strong>Health</strong> RI, which is 90% in2014. In ASEAN and SEARO, measles vaccination is given to 9‐11 months infantand the last immunization series to infant.In <strong>2010</strong>, <strong>Indonesia</strong> had covered measles immunization 93.61%. It means<strong>Indonesia</strong> had met WHO target. Graph 4.23 shows distribution of measlesimmunization coverage by province in <strong>2010</strong>.GRAPH 4.23PERCENTAGE OF MEASLES IMMUNIZATION ACHIEVEMENTBY PROVINCE, <strong>2010</strong>Source: DG of Disease Control and Environmental <strong>Health</strong>, MoH RI91
Of 33 provinces in <strong>Indonesia</strong>, 20 provinces had met measles immunizationtarget ≥ 90%, 10 provinces covered 80%‐90% and other 4 provinces covered lessthan 80%. There was even province with coverage 68.34%. The highest coveragewas by Bangka Belitung Islands, Jambi, West Nusa Tenggara and DI Yogyakartawith each 100%. Meanwhile, three provinces with lowest coverage were WestPapua (68.34%), Papua (71.71%) and West Sumatera (78.31%). Data of basicimmunization on infants by province in <strong>2010</strong> can be seen in Annex 4.25.Riskesdas <strong>2010</strong> notes that infants aged 12‐23 months getting measlesimmunization was 74.4%. Three provinces with highest coverage were DIYogyakarta (96.4%), Riau Islands (92.1%) and North Sulawesi (90%).Education and expenditure per capita relate to percentage of infants aged12‐23 months getting complete basic immunization, including measles. The highereducation level of head of family is the higher coverage of infants gettingimmunization. It is the same situation to expenditure per capita. The higherexpenditure per capita is the higher infants getting basic immunization. There wasdifference of coverage between urban and rural. Percentage of all type basicimmunization in urban was higher than in rural. Table 4.1 will describe thisrelation.TABLE 4.1PERCENTAGE OF CHILDREN AGED 1223 MONTHS GETTING BASIC IMMUNIZATIONBY RESPONDENT CHARACTERISTIC, <strong>2010</strong>CharacteristicType of ImmunizationBCG Polio4 DPT-HB3 MeaslesType of AreaUrban 85.3 73.4 67.9 78.6Rural 70.2 60.0 55.9 70.2Education of Head of FamilyNot Schooling 63.9 50.9 43.7 56.3Not complete Primary School 66.5 54.2 51.5 65.0Primary School Graduate 73.9 62.0 56.8 69.7Junior High Graduate 78.9 70.2 65.2 77.5Senior High Graduate 84.9 73.7 69.3 81.3Higher Education Graduate 91.5 80.5 74.1 85.5Expenditure per Capita1 st Quintile 67.9 54.7 51.7 65.02 nd Quintile 76.0 64.5 59.1 71.43 rd Quintile 81.2 72.4 66.9 77.84 th Quintile 82.3 73.3 68.2 80.85 th Quintile 90.9 78.8 72.5 86.3Source: National Board of <strong>Health</strong> Research and Development, MoH RI, Riskesdas <strong>2010</strong>Achievement of Universal Child Immunization (UCI) is basically a proxy tocoverage of complete basic immunization to infants (0‐11 months). UCI village is adescription of village (desa/kelurahan) with ≥ 80% infants had got complete basicimmunization in a year. In strategic plan (Renstra) of Ministry of <strong>Health</strong> <strong>2010</strong>‐92
2014, UCI target in <strong>2010</strong> is 80%, while minimum service standard (SPM) sets UCItarget of 100% for every district/municipality in <strong>2010</strong>.Graph 4.24 presents percentage of UCI village that had not shownsignificant improvement during the last six years. The highest achievement was in2005 with 76.23%. Average coverage of UCI village in <strong>2010</strong> was 75.31%. Threeprovinces with the highest coverage in <strong>2010</strong> were DI Yogyakarta (100%), Bali(99.72%) and DKI Jakarta (99.25%), while three provinces with the lowestcoverage were West Papua (40.05%), North Maluku (50.63%) and Aceh (52.67%).UCI village achievement by province 2008‐<strong>2010</strong> is in Annex 4.24.GRAPH 4.24COVERAGE OF UCI VILLAGEIN INDONESIA, 2004<strong>2010</strong>Source: DG of Disease Control and Environmental <strong>Health</strong>, MoH RIOf 33 provinces, 13 had met Renstra target in <strong>2010</strong> that the coverage of UCIvillage is 80%. There were 6 provinces with coverage
Drop out rate of DPT‐Hb1‐measles immunization 2006‐<strong>2010</strong> can be seen inGraph 4.25 below, and detail drop out rate of DPT‐Hb1‐measles immunization in<strong>2010</strong> by provinsi is in Annex 4.28.GRAPH 4.25DROP OUT OF DPTHb1–MEASLES IMMUNIZATION ON INFANTSIN INDONESIA, 2006<strong>2010</strong>94Source: DG of Disease Control and Environmental <strong>Health</strong>, MoH RIb. Immunization to Pregnant WomenTetanus is caused by toxin which is produced by Clostridium Tetanibacteria. It can infect newborn (Tetanus Neonatorum) during delivery or umbilicalcord treatment. Tetanus is one cause of infant mortality in <strong>Indonesia</strong>.Many pregnant women live in remote areas with not sterile condition fordelivery. This condition develops risk of Tetanus to mother and infants.Maternal and Neonatal Tetanus Elimination (MNTE) is a Tetanuselimination program to neonates and eligible women, including pregnant women.Strategies to eliminate maternal and Neonatorum Tetanus are 1) safe and hygienicdelivery assistance; 2) equally distributed and high coverage of regular TTimmunization; and 3) surveillance.Some problems of TT vaccination to eligible women are: not optimumscreening process, recording process started from cohort of reproductive agewomen (both pregnant and not pregnant productive age women) has not the sameyet, and coverage of TT2 immunization to pregnant women is lower than coverageof 4 th visit (K4).In <strong>2010</strong>, three provinces with highest coverage of pregnant women gotTT2+ immunization were Bali (103.44%), West Java (90.08%) and Banten(89.19%), while province with the lowest coverage was East Java (27.64%).Graph 4.26 shows that coverage of TT2 immunization 2003‐2007 tended todecrease. Since the last 4 years, coverage of TT2 immunization increased from26% in 2007 to 70% in <strong>2010</strong>. It becomes the highest coverage since the last fiveyears.
GRAPH 4.26COVERAGE OF TT2+ IMMUNIZATION TO PREGNANT WOMEN IN INDONESIA2003<strong>2010</strong>Source: DG of Disease Control and Environmental <strong>Health</strong>, MoH RIRiskesdas <strong>2010</strong> notes that nationally 47.2% pregnant women got TTimmunization for at least twice during pregnancy. It ranges from 22.8% to 71.4%.From total 33 provinces, 3 provinces had coverage more than 70%, NorthSulawesi, Central Kalimantan and Maluku, 12 provinces had 50%‐70% and theremains had
Annex 4.43 and Annex 4.44 show drugs need by 144 types of drug andavailability level. From those 144 types of drug and vaccine, there were only 8types of drug had availability of 50% and more. Other 134 had less than 50%.Highest percentage of drug availability was on Polivalen injection Anti‐snackvenom Serum 50ml (ABU II) with 77%, while other drugs and vaccines had theavailability
Bed utilization in hospital since 2003‐2009 can be seen in Graph 4.27below.GRAPH 4.27ACIEVEMENT OF BOR AND BTO IN GOVERNMENT HOSPITALSIN INDONESIA, 20032009Source: DG of Medical Care, MoH RIRemarks:BOR = Bed Occupation RateBTO = Bed Turn OverLOS or Length of Stay is average of patient stay in hospital. This indicatordescribes not only efficiency level but also service quality. When it is applied oncertain diagnosis, it can be something that need to be observed. In general, theideal LOS is 6‐9 days. Graph 4.28 shows national average LOS during 2003‐2009ranging from 4‐5.3 days (had not met the ideal target). By province, WestKalimantan had the highest LOS with 5.6 days, and Bangka Belitung Islands had thelowest LOS with 3.1 days.GRAPH 4.28ACHIEVEMENT OF LOS AND TOI IN HOSPITALS IN INDONESIA20032009Source: DG of Medical Care, MoH RIRemarksLOS = Length of StayTOI = Turn over Interval97
Other indicator of hospital service is TOI. Turn over Interval is average daywhen hospital bed is unoccupied, counted from the last usage to reused (averagelength of unoccupied bed from one patient to the next one). Ideally, the bed isunoccupied only for 1‐3 days. During 2003‐2009, TOI in hospital ranged from 2.9‐6.3 days. Only in 2007 and 2008 it had the ideal of 1‐3 days. In 2009, TOI of beds in<strong>Indonesia</strong> had interval of 6.3 days unocupied. By province, only Bali (2 days) andJambi (2.6 days) had the ideal TOI.GDR or Gross Death Rate is adalah a general death rate for every 1000discharged patients from a hospital. It does not consider how many days a patientstays in hospital from the first day to death. The ideal GDR is < 45 per 1,000discharged patients. In <strong>2010</strong>, GDR in <strong>Indonesia</strong> was 38.8 deaths per 1000discharged patients. From 31 reporting provinces, 6 provinces had GDR > 45 per1000 discharged patients, those were West Sulawesi (62), West Sumatera (58.1),South Sulawesi (48.9), Maluku (48.2), DI Yogyakarta (46) and Riau (45.1).GRAPH 4.29ACHIEVEMENT OF GDR AND NDR PER 1000 DISCHARGED PATIENTS IN HOSPITALIN INDONESIA, 2005<strong>2010</strong>Source: DG of Medical Care, MoH RIRemarks:NDR = Net Death Rate (per 1000 discharged patients)GDR = Gross Death Rate (per 1000 discharged patients)NDR or Net Death Rate is mortality rate of patients after treated ≥ 48 hoursper 1,000 discharged patients. This indicator describes quality service in hospitals.It is assumed that if a patient dies after treated 48 hours, it might be hospitalservice factor related to patient’s death. But if a patient dies less than 48 hourstreatment, it could be mainly caused by the delays of patient coming to hospital.The ideal NDR is < 25 per 1,000 discharged patients. Since 2005‐<strong>2010</strong>, NDR rangedfrom 18‐23.6 per 1000 discharged patients. Therefore, NDR in <strong>Indonesia</strong> had metthe ideal target < 25 per 1000 discharged patients.98
2. Community <strong>Health</strong> InsuranceThe purpose of Jamkesmas (community health insurance) is to improveaccess and quality of health service to poor and almost poor community in order toachieve optimum community health status efficiently and effectively. This healthinsurance is expected to reduce maternal mortality rate, infant and underfivemortality rates as well as births rate and provide health problem treatment to poorpeople generally. This program has been running for five years and providingadvantages to improvement of health service access to poor and almost poorcommunity in health center and its network as well as in hospital.Jamkesmas <strong>2010</strong> is a continuation of the implementation in 2009 to refineand improve aspects of participation, health service, funding and organizationalmanagement. It is manged in Jamkesmas Guideline (Pedoman PelaksanaanJamkesmas) through <strong>Health</strong> Ministerial Decree No: 686/Menkes/SK/VI/<strong>2010</strong> on 2Juei <strong>2010</strong>.Jamkesmas <strong>2010</strong> membership covered 76,400,000 poor and almost poorpeople, which 73,726,290 memberships included in Regent/Mayor Decree (SK)and the remain 2,673,710 memberships, such as homeless, vagrant, beggar, waifchildren, social institution, prisoners, disaster victims on post‐disaster emergencyresponse, member of Program Keluarga Harapan (PKH), etc included in nonRegent/Mayor Decree (SK).Since 2005 to 2007, target of Jamkesmas (total number of poor and almostpoor people) had been increasing, except in 2007‐<strong>2010</strong> the target is 76.4 millionpeople. Provinces with the biggest target are Central Java, West Java and East Java.Graph 4.30 shows realization of health insurance program 2005‐<strong>2010</strong>.GRAPH 4.30REALIZATION OF JPKM PROGRAM2005 – <strong>2010</strong>Souce: Center for Managed Care, MoH RI99
In <strong>2010</strong>, there were 36.23 million visits of Jamkesmas member tooutpatient health servis, including 31.49 million visits of 1 st level outpatient careand 4.74 million visits of advanced outpatient care. Number of outpatient visit in<strong>2010</strong> was relatively higher than previous years. In <strong>2010</strong>, inpatient care ofJamkesmas member reached 2.1 million visits, including 1.19 milions of 1 st levelinpatient care and 0.91 millions of advanced inpatient care.By age group, the most Jamkesmas member is teens (age of 11‐15 years,numbered 10.22%), then it propotionally decreased in older age group, andincreased in age group ≥76 years (2.97%), as shown in Graph 4.31. It shows thatJamkesmas covers protection to high‐risk and susceptible age group on health.Targets of MDGs on health, such as pregnant women, infants, underfive and elderlyof poor and almost poor people, have been protected and ensured by governmentto get health insurance through Jamkesmas Program.GRAPH 4.31NUMBER OF JAMKESMAS MEMBER BY AGE GROUP AND SEXIN <strong>2010</strong>Souce: Center for Managed Care, MoH RIBy sex, there is no significant difference of Jamkesmas members. Thegreatest difference of proportion occurred on age group of 71‐74 years with 9%difference and on age group of ≥75 years with 8%.C. DISEASES CONTROL AND PREVENTION1. Polio Control100The 41 st WHA (World <strong>Health</strong> Assembly), 1988 attended by health ministersof WHO member states, declared global polio eradication initiative to eradicatepolio in 2000. This initiative is then supported by World Summit for Children in1989, where <strong>Indonesia</strong> was also the signatory. The eradication is not only toprevent Polio but also means wider, which is to cut transmission of wild polio virusin the world.
Polio Eradication is a condition where indigenous wild polio virus not foundfor 3 years in a row on certain region, proved by AFP surveillance based onsertification standard. Backgrounds of Polio Eradication are:1. Human is the only reservoir and no longterm carrier on human.2. Polio virus can not survive in environment.3. Availability of vaccine which is > 90% effective and easily given.4. Operationally applicability.During the past 10 years, there is no AFP case of wild polio virus found in<strong>Indonesia</strong>. AFP surveillance has been conducted in <strong>Indonesia</strong> since the middle of1995. By 2002, the achievement kept fluctuating, but it started to indicatesignificant improvement since surveillance officer is available in province.Polio control and prevention have been implemented through polioimmunization. It is then followed by epidemiologic surveillance actively to AcuteFlaccid Paralysis (AFP) cases on age group 80%, which means thatminimum 80% fecal specimen must be taken in accordance with the requirementsof ≤ 14 days after paralysis, and when specimen arrive at laboratory, its101
temperature must be between 0‐8ºC. Therefore, since 2003 to <strong>2010</strong>, adequatespecimen has met WHO target, except in 2006 with 79.10%.Provinces having met WHO target of non polio AFP rate ≥ 2 per 100,000children aged < 15 years and adequate specimen are presented in Graph 4.33.GRAPH 4.33aNON POLIO AFP RATE / 100,000 CHILDREN AGED < 15 YEARSBY PROVINCE, <strong>2010</strong>GRAPH 4.33bPERCENTAGE OF ADEQUATE SPECIMENT DISPATCHBY PROVINCE, <strong>2010</strong>Source: DG of Disease Control and Environmental<strong>Health</strong>, MoH RISource: DG of Disease Control and Environmental <strong>Health</strong>,MoH RI2. Pulmonary Tuberculosis102Four main purposes of Pulmonary TB control in Millenium DevelopmentGoals (MDGs) are: 1) to reduce incidence rate of Pulmonary TB by 2015; 2) tohalve prevalence and death rate by 2015, comparing to 1990; 3) to detect and cureat least 70% cases of Pulmonary TB AFB+ with DOTS (Directly ObservedTreatment Shortcourse Chemotherapy); and 4) at least 85% of succes rate.DOTS is a short‐course Pulmonary TB therapy with direct observation. Thistherapy should accelerate the healing process. It emphasizes on the important ofobserving directly the patient to take medicines in the right combinantion for thethe correct duration until successfully healed. DOTS strategy contributes highsuccess rate, rising to 95%. This strategy is recommended globally by WHO tocontrol Pulmonary TB.a. Proportion of Pulmonary Tuberculosis AFB+ to Examined Suspect CaseGovernment efforts to control pulmonary TB in every year significantlyshows progress, and it is indicated by the increasing of cases detected and curedevery year.Subject to the target, percentage of Pulmonary TB AFB+ is estimated 10% ofsuspect cases in community with tolerating rate between 5‐15%. When thepercentage is lower (< 5%), it might be caused by loose suspect detection, such asmany cases do not meet suspect criteria, or many mistakes occur in laboratoryexamination (fake negative result). On the contrary, when the percentage is toohigh (> 15%), it could be because of too strict detection process or errors duringlaboratory examination (fake negative result). Therefore, since 2005‐<strong>2010</strong>pecentage of AFB+ to suspect cases was still within the tolerable limit. It means thecriteria to detect suspect case has been good enough and the health personnelscould diagnose AFB+ cases based on standard.
Graph 4.3 shows percentage of pulmonary TB AFB+ to pulmonary TBsuspect cases from 2005‐<strong>2010</strong>. For the last six years, the highest percentage ofpulmonary TB AFB+ to pulmonary TB suspect cases was in 2005 with 13.01% andthe lowest was in 2008 with 10.5%.GRAPH 4.34PERCENTAGE OF AFB+ TO SUSPECT CASES2005<strong>2010</strong>Source: DG of Disease Control and Environmental <strong>Health</strong>, MoH RIProportion of pulmonary TB AFB+ to examined suspect cases by province in<strong>2010</strong> is presented in Graph 4.35.GRAPH 4.35PERCENTAGE OF PULMONARY TB AFB+ TO SPUTUMEXAMINED SUSPECT CASESBY PROVINCE, <strong>2010</strong>Source: DG of Disease Control and Environmental <strong>Health</strong>, MoH RIThere were 30 provinces with percentage 5‐15%, while 3 provinces hadpercentage >15%, those were North Maluku, Riau Islands and DKI Jakarta.b. Case Detection Rate (CDR) and Success Rate (SR)Case detection rate indicates detection of pulmonary TB AFB+ to suspectedcases. Gambar 4.36 shows tendency of case detection rate. During 2000‐<strong>2010</strong>, CDR103
has increased significantly from 20% in 2000 to 78.3% in <strong>2010</strong>, which is the highestachievement for the last 11 years. Meanwhile, standard of TB case detection (CDR)is 70%. Therefore, since 2006 to <strong>2010</strong> (except 2007) <strong>Indonesia</strong> had met the targetand maintained the position. Target of strategic plans (Renstra) on case detectionindicator in <strong>2010</strong> is 73%. It means national achievement in <strong>2010</strong>, which was78.3%, had met the target.GRAPH 4.36PERCENTAGE OF CASE DETECTION RATE AND SUCCESS RATE OF PULMONARY TBIN INDONESIA, 2000<strong>2010</strong>Source: DG of Disease Control and Environmental <strong>Health</strong>, MoH RIThe success of TB therapy is indicated by the obedience and regularity ontreatment, physical and laboratory check up. Success rate during 2000‐2009 hasmet WHO SR target of minimum 85%, and even in 2009 it reached 91.2%.Success Rate of TB therapy in <strong>2010</strong> (patient in 2009) by province ispresented in graph below.GRAPH 4.37PERCENTAGE OF SUCCESS RATE OF PULMONARY TBBY PROVINCE IN <strong>2010</strong> (TREATMENT IN 2009)TARGET OF SUCCESSRATE : 85%104Source: DG of Disease Control and Environmental <strong>Health</strong>, MoH RI
There were 27 of 33 provinces (82%) with treated patients of 2009 gotsuccess rate 85% in <strong>2010</strong>. Three provinces with the highest SR were Maluku(96.9%), North Sulawesi (96.1%) and North Sumatera (96.1%). The remaining 6provinces having not met the SR target of 85% were West Papua, Papua, RiauIslands, Riau, DI Yogyakarta and North Maluku.3. Acute Respiratory Infection (ARI) ControlAcute Respiratory Infection (ARI) is the most death cause on infant andunderfive. This is the mortality survey of ARI subdirectorate in 2005 in 10provinces mentioning that with 22.30% (of all infant deaths) pneumonia was themost cause of death on infants in <strong>Indonesia</strong>. Pneumonia was also the main cause ofdeath on underfives with 23.60%. Mortality study in Riskesdas 2007 indicatesproportion of infant mortality (post neonatal) caused by pneumonia was 23.8%and of underfives mortality was 15.5%.ARI control program (P2 ISPA) determines ARI into pneumonia and notpneumonia. Pneumonia is cathegorized by serious level into severe pneumoniaand non severe pneumonia. Cough‐cold diseases such as rynitis, pharyngitis,tonsillitis and other upper respiratory infections are cathegorized as notpneumonia. Etiology of those upper respiratory infections mostly are virus and donot need antibiotic therapy. Pharyngitis by Streptococcus is rarely found in underfives,but when it is found, it must be treated with penicillin. All acute ear‐relatedinflammations must get antibiotic.ARI control program (P2 ISPA) determines all cases found should bemanaged due to the standard. Therefore, ARI case detection also represents ARIcase management.Nationally, pneumonia detection rate on underfives has not met the targetas presented in Graph 4.38 below.GRAPH 4.38COVERAGE OF PNEUMONIA CASE DETECTION ON UNDERFIVEIN INDONESIA, 2005 – <strong>2010</strong>Source: DG of Disease Control and Environmental <strong>Health</strong>, MoH RI105
106Average coverage of pneumonia case detection on underfive in <strong>2010</strong> was23%, which means still far from target of <strong>2010</strong> with 60%. Three provinces with thehighest coverage were West Nusa Tenggara (64.49%), South Kalimantan (49.60%)and West Java (48.65%).Since 2005 to <strong>2010</strong>, coverage of pneumonia case detection had been low.Some problems appear during efforts of rising under‐five pneumonia detection in<strong>Health</strong> Center, as follow:a. Most program management and ARI officer in polyclinic have not beentrained because of limited budget and high mutation of officers.b. Data manajemen: Under reported because of the confusion between diagnosis andclassification of ARI (Pneumonia, Serious Pneumonia, cough nonPneumonia/common ARI), that there are many pneumonia cases classifiedas common ARI. Delay of staged reportingc. Control of underfive pneumonia is still health center‐base, and pneumoniacases have not covered cases in hospitals (government and private), clinic,private practice and other health facilities.d. In districts and provinces, calculation errors of coverage target are still oftenfound.4. HIV/AIDS and STI (Sexually Transmitted Infection) Control<strong>Health</strong> services of HIV/AIDS control are for treating cases found and alsofocused on the prevention efforts through early case detection and counseling.Case detection is managed by HIV/AIDS sceening to blood donor andmonitoring high‐risk of STI, such as sex workers, IDUs, prisoners, and even thelow‐risk group as housewives, etc. The HIV/AIDS surveillances during past sevenyears are presented on Tabel 4.2 below.TABLE 4.2CASE DETECTION OF HIV/AIDS IN INDONESIA2003 – <strong>2010</strong>Year HIV Positive AIDS Positive Death (AIDS Positive)Per Cummulative Per Cummulative Per Cummulativeyearyearyear2003 168 2,720 316 1,487 261 4792004 649 3,369 1,195 2,682 361 7402005 875 4,244 2,638 5,321 592 1,3322006 986 5,230 2,873 8,194 539 1,8712007 836 6,066 2,947 11,141 498 2,3692008 4,969 16,110 993 3,3622009 6,015 3,863 19,973 484 3,846<strong>2010</strong> 4,158 24,131 693 4,539Source: DG of Disease Control and Environmental <strong>Health</strong>, MoH RI
The development of diseases from positive HIV to AIDS is usually known as”window period” (periode jendela), which is 12 weeks after virus get inside thebody until the formation of antibody. Misunderstanding often occurs when statingof “not infected by HIV virus” (the examination not/has not detect antibody) whileactually this window period is very potential in transmitting virus, and this virus isspreading very fast. For this group, re‐examination is suggested to be repeated onthe next 12 week.5. Dengue Hemorrhagic Fever (DHF) ControlDengue Hemorrhagic Fever (DHF) is one disease which spreads fast and cancause death in short time. It is a communicable disease and often occurring asoutbreak in <strong>Indonesia</strong>.Methods to prevent DHF consist of: 1) improvement of disease and vectorsurveillance; 2) early diagnosis and treatment; and 3) improvement of DHF vectorelimination. These methods emphasize activation of public potency to involve inmosquito nest elimination (PSN) and regular larva monitoring. The success of PSNprogram is indicated with Free Larva Rate (ABJ) as a measurement of vectorelimination.The most appropriate method to prevent DHF is mosquito nest elimination(PSN) through “3M plus” movement (draining water reservoir, closing waterreservoir, burying unused things that can keep water) plus pouring larvasida,placing fish in water reservoir and other activities that can prevent from/destroyAedes Aegypti breed.Free Larva Rate (ABJ) is a measurement of vector elimination through PSN‐3M which indicates people participation in preventing DHF. Thus, communityaware‐based DHF elimination is one new alternative approach to eliminate DHF.Vector surveillance is applied through larva monitor by health personnel orskilled larva monitoring worker (Jumantik/Kamantik). Gradual development ofvector surveillance system should be implemented, especially due to casedistribution and climate changes. Since 2004, only some provinces reported ABJdata because the gradual larva monitoring (PJB) program has not been a priority inmost areas.Since 2004 a local sociocultural approachment is implemented, which is amethod of communication/message affecting behavior changes in theimplementation of PSN (Communication for Behavioral Impact/COMBI method). In2007, PSN with COMBI method was implemented in 4 (four) cities: South Jakarta,East Jakarta, Padang and DI Yogyakarta. In 2008, it was implemented in 5 (five)district/cities: South Jakarta, Bandung City, Tangerang District, Semarang City andSurabaya City. In 2009, it was implemented in 5 cities: Bekasi, Depok, Bogor,107
Batam and Mataram. In <strong>2010</strong>, it was implemented in 5 cities: Samarinda,Pontianak, Metro Lampung, Denpasar and Manado.Free Larva Rate (ABJ) in 2005‐<strong>2010</strong> which is monitored in 5 cities ispresented in Graph 4.39 below.GRAPH 4.39FREE LARVA RATE IN INDONESIA2005 – <strong>2010</strong>TARGET <strong>2010</strong> ≥ 60%108Source: DG of Disease Control and Environmental <strong>Health</strong>, MoH RIGraph 4.39 figures free larva rate in 2009 decreased, but increased in <strong>2010</strong>to 81.4%. It means the coverage in <strong>2010</strong> has met the target of <strong>2010</strong> (≥ 60%). Thisis a result of reports/survey only in some cities and not representing awhole<strong>Indonesia</strong>. Therefore, optimalization/revitalization of Gradual Larva Detecting inall health centers in <strong>Indonesia</strong> should be implemented.6. Malaria ControlThe rising of malaria cases and outbreak in <strong>Indonesia</strong> has close relationshipwith these factors: 1) environemental change which extends malaria vector nest;2) high population mobility; 3) climate change which makes rainy season is longerthan dry season; 4) prolonged economic crisis increasing number ofundernutrition community that they are more risky of malaria infection; 5)ineffective therapy because of resistance of Plasmodium falciparum to klorokuinand extended resistance area; and 6) less concern and awareness of people tointegrated malaria elimination program.Malaria eradication is promoted by social movement known as “GebrakMalaria” or fight back malaria movement that was initiated in 2000. It is anembryo of malaria control partnership to other sectors with slogan of “AyoBerantas Malaria” (let’s fight malaria).Malaria control in <strong>Indonesia</strong> is included in <strong>Health</strong> Ministerial Decree No.293/MENKES/SK/IV/2009 on 28 April 2009 about Malaria Elimination in<strong>Indonesia</strong> which pusposes to develop healthy live people and gradually free peoplefrom malaria transmission by 2030. Target of malaria elimination is as follow:
a. Seribu Islands (DKI Jakarta Province), Bali Island and Batam Island in <strong>2010</strong>;b. Java Island, Aceh Province and Riau Islands Province in 2015;c. Sumatera Islands (exclude Aceh and Riau Islands Provinces), West NusaTenggara Province, Kalimantan Island and Sulawesi Island in 2020; andd. Papua, West Papua, Maluku, East Nusa Tenggara and North Maluku in 2030.e. Percentage of Treated MalariaPercentage of treated malaria is a percentage of malaria case gettingstandard treatment in one year compared to suspect and/or positive malaria carewhich comes to health facility.Percentage of treated malaria cases since 2003 to <strong>2010</strong> was 100%. It meansall suspect and/or positive malaria cases which went to health facilities gotstandard treatment.f. Achievement of Blood Supply Examination (Laboratory Confirmation)According to coverage of laboratory confirmation, not all blood supply ofmalaria clinical cases were examined. During 2000-<strong>2010</strong> percentage of blood supplyexamination comparing to ckinical malaria cases tended to increase significantly. In2005, it was 47%, increasing to 63% in <strong>2010</strong>. Coverage of malariamicrocospic/laboratory confirmation during 2005‐<strong>2010</strong> is presented in Graph4.40.GRAPH 4.40COVERAGE OF MALARIA MICROCOSPIC/LABORATORY CONFIRMATION2005 <strong>2010</strong>Source: DG of Disease Control and Environmental <strong>Health</strong>, MoH RI7. Leprosy ControlTo evaluate personnel performance in leprosy case detection, it usespropotion rate of physical defect case at second level (due to neurogical damageand visible handicapped). The high rate of second‐level physical defect proportionindicates the delay in detecting cases, in other words, the low performance ofpersonnel in detecting cases and lack of people’s knowledge.109
110Second‐level physical defect case during 2004‐2007 was relatively stable(8.6%‐8.7%), but in 2008‐<strong>2010</strong> it gradually increased to 10.79% (in <strong>2010</strong>), asshown in Table 4.3. Proporsion of second‐level physical defect by <strong>2010</strong> had notmet the target of < 5%. It means the transmission still occurred in community, andcases were lately detected since when they were found they had already hadsecond‐level physical defect.YearTABLE 4.3POPULATION EXAMINATION, NEW CASE DETECTION RATE (NCDR)AND 2 nd LEVEL PHYSICAL DEFECT IN INDONESIA, 2004 <strong>2010</strong>Positive Suspect NCDR 2nd LevelPhysical DefectPB MB (per 100,000population)(%)2004 3,615 12,957 7.8 8.62005 4,056 15,639 8.9 8.72006 3,550 14,750 8.3 8.62007 3,643 14,083 7.8 8.62008 3,113 14,328 7.41 9.62009 2,958 14,277 7.1 10.27<strong>2010</strong> 3,278 13,734 7.22 10.71Source: DG of Disease Control and Environmental <strong>Health</strong>, MoH RIRemarks : MB = Multi Basiller, PB = Pausi Basiller, NCDR = New Case Detection Rate8. Filariasis ControlFilariasis (usually called as elephantiasis) spreads almost thoughoutprovinces in <strong>Indonesia</strong>. Filariasis elimination program is established based onWHO Global 2000 “The Global Goal of Elimination of Lymphatic Filariasis as aPublic <strong>Health</strong> Problem the year 2020” as realization of WHA (World <strong>Health</strong>Assembly) resolution in 1997.This elimination program is implemented through 2 pillars:1. Mass Drug Administration (MDA) to all people in filariasis endemic districtsusing DEC 6 mg/kg BB combined with Albendazole 400 mg once a year for 5years in order to cut the transmission.2. Case management of filariasis clinical cases to prevent and reduce physicaldefect.Since 2005, Implementation Unit (IU) used in Filariasis EliminationProgram is district/municipality. It means the smallest area in this program isdistrict/municipality, both for endemicity determination and mass drugadministration. When a district/municipality has been a filariasis endemic, targetof mass drug administration covers all residents of the district/municipality. Theyhave to take medicine, but it is temporarily delayed for children under‐two (2)years, pregnant woman, people with serious illness, filariasis chronic patient inacute attack and marasmus/kwashiorkor under‐five.
Management of filariasis clinical cases should be implemented in all cases. Ithas purposes to prevent or reduce physical defect and motivate the patient to doself‐care. Every case has their own medical record in health center and gets healthpersonnel visit at least 6 times a year. Percentage of filariasis clinical casemanagement 2005‐<strong>2010</strong> can be seen in Graph 4.41.GRFAPH 4.41PERCENTAGE OF FILARIASIS CLINICAL CASE MANAGEMENT2005-<strong>2010</strong>Source: DG of Disease Control and Environmental <strong>Health</strong>, MoH RIActivities of filariasis clinical case management tended to increase fromyear to year. In <strong>2010</strong> the management increased to 5,170 cases (43.2%). For thenext years, it is targeted to increase into 90%.Not all dastricts/municipalities could implement MDA with all populationas the target. It is caused by, for example, high operational cost and not all localgovernment had the commitment.GRAPH 4.42NUMBER OF DISTRICTS WITH FILARIASIS DRUG ADMINISTRATION (MDA)IN INDONESIA, 2005<strong>2010</strong>Source: DG of Disease Control and Environmental <strong>Health</strong>, MoH RISince 2005, number of districts/municipalities implementing MDA filariasistended to increase every year, but in <strong>2010</strong> it decreased to only 88111
districts/municipalities (25%) of filariasis endemic districts/municipalities. Thedecreasing was caused by not available operational cost of MDA filariasis in localarea and delay of medicine arrival in districts/municipalities.Distribution of districts/municipalities of filariasis endemic, implementingMDA and successfully implemented MDA can be seen in Graph 4.43 below.GRAPH 4.43DISTRICTS/MUNICIPALITIES OF ENDEMIC FILARIASIS IMPLEMENTING MDAIN INDONESIA, <strong>2010</strong>Source: DG of Disease Control and Environmental <strong>Health</strong>, MoH RICoverage of MDA filariasis in <strong>Indonesia</strong> 2005‐<strong>2010</strong> is pr in Graph 4.44.GRAPH 4.44COVERAGE OF MDA FILARIASISIN INDONESIA, 2005<strong>2010</strong>Source: DG of Disease Control and Environmental <strong>Health</strong>, MoH RIIn <strong>2010</strong>, MDA target was 56 millions people, while the realization onlycovered 22,052,622 (39.4%). It decreased from previous years, as shown in Graph4.41, because the delay of medicine procurement and distribution process.Therefore, continuous advocacy to stakeholders in districts/municipalities isneeded in order to get commitment and sustainable budget allocation to meet thegoal of filariasis elimination in <strong>Indonesia</strong> in 2020.112
9. Vector SurveillanceOne thing that must be always concerned in vector control is monitoringvector resistance to insecticide which could be used as a reference of healthoffices and technical units (UPT) for vector control policy in the field.Vector control managed by private sector and domestic use of insecticideare two separate problems that can not be ignored because the uses are notmonitored and would be able to accelerate the vector resistance. Today, the vectorcontrol is identical to insecticide use, though other methods are important also tobe considered. This condition needs monitoring and control to insecticide use tokeep the result effective.<strong>Health</strong> Ministerial Decree No.: 374/Menkes/Per/III/<strong>2010</strong> concerningvector control covers integrated vector control guideline (PVT), vectorsurveillance and tools, and vector control and tools. Integrated vector control is anapproach combining some vector control methods based on considerasion ofsecurity, rationality and effectiveness as well as sustainability.Sub Directorate of Vector Control had formed Expert Commission (KOMLI).KOMLI of vector control is a group of experts on epidemiology, environment,chemical, entomology, health human resources and vector control tools. It is anindependent organization that has a function to give contribution, suggestion andconsiderations on vector control.One indicator of strategic planning in <strong>2010</strong> is percentage ofdistrict/municipality implementing vector mapping. Result by <strong>2010</strong> covered 120districts/municipalities mapping the vector (26.09%). It is still below target of30%.A. Malaria Vector Surveillance and MonitoringSusceptibility TestingGRAPH 4.45MONITORING OF MALARIA VECTOR SUSCEPTIBILITY2007<strong>2010</strong>Source: DG of Disease Control and Environmental <strong>Health</strong>, MoH RI113
Monitoring of malaria vector susceptibility from 2007‐<strong>2010</strong> is shown inGraph 4.45, describing areas tolerant to insecticide which is used in malariacontrol. The tolerant areas were Aceh (An. subpictus tolerant to lambdacyhalothrin0.05%), Gorontalo (An. aconitus tolerant to bendiocarb 0.1%) andEast Nusa Tenggara (An. barbirostris tolerant to bendiocarb 0.1%). Thosetolerant areas shall implement insecticide rotation in malaria contol program.Malaria VectorBy 2008, number of malaria vector recorded by Sub Directorate of VectorControl and from some sources were 25 species, as shown in Graph 4.46. Itrecently is found An. vagus positive of malaria parasit in East Nusa TenggaraProvince, Purworejo District and Sukabumi District. Some researches mentionthat An. vagus prefers animal blood than human blood. Therefore, otherresearches are needed to confirm the possibility of bionomic changes.GRAPH 4.46DISTRIBUTION OF MALARIA VECTOR IN INDONESIASource: DG of Disease Control and Environmental <strong>Health</strong>, MoH RIRemarks :1. An.aconitus 7. An. koliensis 13. An.minimus 19. An. vagus2. An.balabacensis 8. An.letifer 14. An.nigerrimus 20. An. umbrosus3. An.bancrofti 9. An.leucosphyrus 15. An.punctulatus 21. An.tesellatus4. An.barbirostris 10. An.karwari 16. An. sinensis 22. An.parangensis5. An.farauti 11. An. Ludlowi 17. An.subpictus 23. An. kochi6. An. flavirostris 12. An.maculates 18 An.sundaicus 24. An.ludlowi25.An.annullarisB. Filariasis VectorFilariasis vectors in <strong>Indonesia</strong> are identified as 4 types of mosquitos: Culex,Anopheles, Mansonia and Aedes. The last mentioned (Aedes) is filariasis vector inPapua. Brugia timori is filasriasis that only occurs in <strong>Indonesia</strong>, especially EastNusa Tenggara province, while Brugia malayi and Wuchereria bancrofti spreadsalmost to all provinces in <strong>Indonesia</strong>.114
GRAPH 4.47FILARIASIS VECTOR IN INDONESIASource: DG of Disease Control and Environmental <strong>Health</strong>, MoH RIC. DHF Vector Surveillance and MonitoringMonitoring mapping of DHF vector insecticide resistance from 2004‐2009can be seen in Graph 4.48. It shows that some areas had been resistant to Malation0.8% and Cypermethrin 0.05%. Central Kalimantan, South Sulawesi, Bali and WestNusa Tenggara had been tolerant to Malation 0.8% and Cypermethrin 0.05%.Therefore, insecticide rotation is important during DHF control program.GRAPH 4.48MONITORING OF DHF VECTOR INSECTICIDE RESISTNCE20042009.Source: DG of Disease Control and Environmental <strong>Health</strong>, MoH RID. COMMUNITY NUTRITION IMPROVEMENTImprovement of community nutrition is basically intended to solvenutrition problem in community. Observations find some nutrition problemscommonly in community, such as iron nutrition anemia, vitamin A deficiency andiodine deficiency disorders.115
1. Iron (Fe) Tablet Supplementation to Pregnant WomanNutritional anemia is a deficiency of haemoglobin (Hb) in blood caused by adeficiency of nutrients needed for the formation of this Hb. In <strong>Indonesia</strong> mostanemia cases are caused by iron (Fe) deficiency that it is called as iron anemia.Pregnant woman is one group susceptible to nutrition problem, especiallyanemia caused by lack of iron (Fe). SKRT (household health survey) 2001 figuresanemia prevalence of pregnant woman was 40.1%, and in 2007 it decreased to24.5% (Riskesdas, 2007). However, it indicates iron anemia still becomes onepublic health problem. Today, iron anemia control is focused on iron (Fe)supplementation to pregnant women. They get 90 iron tablets during pregnancy.Coverage of pregnant woman getting iron (Fe) tablet for the last 5 years ispresented on the graph below.GRAPH 4.49PERCENTAGE OF PREGNANT WOMAN GETTING IRON (Fe) TABLET2006 <strong>2010</strong>Source: DG of Nutrition and Maternal and Child <strong>Health</strong>, MoH RICoverage of pregnant woman getting iron tablet (Fe) during 2006‐2008tended to decrease in every year, but it increased in 2009 and <strong>2010</strong>. In <strong>2010</strong>, therewas 71.2% pregnant woman getting 90 Fe tablets.Provinces on the top position with highest coverage were Bangka BelitungIslands (94.1%), Riau (91.9%) and Bali (90%), while three provinces with thelowest coverages were Papua (22.6%), West Papua (27.9%) and North Maluku(32.3%).Distribution of iron tablet (Fe3) supplementation to pregnant woman byprovince can be seen in Graph 4.50.116
GRAPH 4.50PERCENTAGE OF PREGNANT WOMAN GETTING IRON TABLET (FE3)BY PROVINCE, <strong>2010</strong>Source: DG of Nutrition and Maternal and Child <strong>Health</strong>, MoH RIThis coverage of iron tablet supplementation has close relation to antenatal care(ANC). In <strong>2010</strong>, coverage of 4 th visit (K4) of pregnant women was 85.56%, whilecoverage of pregnant women getting Fe3 was 71.2%. Actually, one criteria of 4 thvisit of pregnant women is the pregnant women get 90 Fe tablets, indicated bycoverage of Fe3 supplementation. Therefore, coverage of Fe3 must have beenhigher or at least the same as coverage of 4 th visit (K4). On the contrary, coverageof pregnant women getting Fe3 is lower than coverage of 4 th visit. The factorsuspected as the cause is not optimum coordination of reporting and recordingsystem among related programs.Another thing needed to consider is the willingness of pregnant woman toswallow Fe tablet. Though the reporting figures coverage of pregnant womengetting Fe3 is quite good, but if it is not swallowed by then the expected benefit ofFe tablet is not fulfilled. Generally, the expected health status could be obstructed.Number of women swallowing 90 or more Fe tablets during pregnancy oftheir last underfive was only 18%. There was 36.3% woman swallowing 0‐30 Fetablets and 19.3% woman did not swallow any Fe tablet during pregnancy of theirlast underfive.Riskesdas <strong>2010</strong> describes percentage of women swallowing Fe tabletduring pregnancy of their last underfive as shown in Graph 4.51 below.117
GRAPH 4.51PERCENTAGE OF WOMEN SWALLOWING Fe TABLETDURING PREGNANCY OF THEIR LAST UNDERFIVEBY NUMBER OF DAY, <strong>2010</strong>Source: National Board of <strong>Health</strong> Research and Development, MoH RI, Riskesdas <strong>2010</strong>2. Vitamin A Capsul Supplementation118Vitamin A supplementation to underfive has a purpose to reduce prevalenceof and prevent vitamin A deficiency on underfive. High doses of vitamin A haveproven effectively to overcome vitamin A deficiency (KVA) in community, whenthe coverage is high. Other facts figure vitamin A role in decreasing infantmortality rate significantly. Therefore, in addition to prevent blindness, theimportant of vitamin A is associated to life survival, health and child growth.Vitamin A is important for eyes health and prevent blindness as well as developbody immunity. When children with enough vitamin A intake get diarrhea, measlesor other infections, they will not get the diseases worsening and endangering theirlives.Target of high doses vitamin A are infants (6‐11 months) supplementedwith Vitamin A 100,000 SI, underfives (1‐4 years) supplemented with Vitamin A200,000 SI and postpartum mother, supplemnted with Vitamin A 200,000 SI thattheir newborn will get enough A through. To infants (6‐11 months), high dosevitamin A is given once a year on February or August; and to underfives, it is givenonce in six months at the same time on February and August; while to postpartummother, the supplementation should be integrated with postpartum health care,but it can be also provinded outside the antenatal care, as long as she has not gotvitamin A supplementation.Coverage of vitamin A supplementation to infants and underfive for the last4 years indicated achievements above 80%. Coverage in <strong>2010</strong> was the lowest forthe last 4 years, both on vitamin A supplementation to infants and to underfives.On the contrary, achievement of vitamin A supplementation to postpartum motherwas still under 80%, although there was a tendency of rising coverage for the lastthree years. Therefore, some efforts are still needed to scale up the coverage.
Those could be improvement of integrated post‐natal care, sweeping areas withlow coverage and campaigning vitamin A supplementation program.Percentage of vitamin A supplementation to underfive and postpartummother for the last 4 years can be seen in Graph 4.52.GRAPH 4.52PERCENTAGE OF UNDERFIVE AND POSTPARTUM MOTHERGETTING VITAMIN A CAPSULE2007 <strong>2010</strong>Source: DG of Nutrition and Maternal and Child <strong>Health</strong>, MoH RIThe problem of vitamin A on underfive has not clinically been a communityhealth problem (xeropthalmia prevalence < 0.5%). Micro nutrition study in 10provinces in 2006 figured xeropthalmia prevalence on underfive was 0.13%, whilevitamin A survey in 1992 showed xeropthalmia prevalence 0.33%.Subclinic vitamin A deficiency (KVA) is a level that has not indicated realsymptoms, and it still occurs in community, especially underfive group. Thissubclinic vitamin A deficiency can be detected by checking vitamin A level in bloodin laboratory. In addition, distribution of vitamin A supplementation to underfiveby province is still below 80% in some provinces. Therefore, vitamin Asupplementation to underfive and postpatum mother should be continued, since itis not only for eyes health and to prevent blindness but the more important also toimprove child survival, health and growth.Provincial health office reported that coverage of vitamin Asupplementation to underfive in <strong>2010</strong> was 81.47%. Three provinces with thehighest coverage were Central Java (98.58%), Bali (95.13%) and DI Yogyakarta(92.72%), while three provinces with lowest coverage were Papua (34.87%),Maluku (40.20%) and West Papua (41.90%).The following graph presents percentage of underfive getting vitamin Acapsule by province.119
GRAPH 4.53PERCENTAGE OF UNDERFIVE GETTING VITAMIN A CAPSULEBY PROVINCE IN <strong>2010</strong>Source: DG of Nutrition and Maternal and Child <strong>Health</strong>, MoH RIPercentage of postpartum mother getting vitamin A by province ispresented in Graph 4.54.GRAPH 4.54PERCENTAGE OF POSTPARTUM MOTHER GETTING VITAMIN ABY PROVINCE, <strong>2010</strong>Source: DG of Nutrition and Maternal and Child <strong>Health</strong>, MoH RI120
From 30 reporting provinces, coverage of vitamin A supplementation topostpartum mother in <strong>2010</strong> was 72.46%. Three provinces with the highestcoverage were Bangka Belitung Islands (91.74%), Central Java (91.72%) and Bali(91.44%), while three provinces with the lowest coverage were North Sumatera(5.58%), Papua (13.71%) and West Papua (39.79%). On the contrary, Lampung,East Java and West Nusa Tenggara were not available. Coverages of vitamin Asupplementation to 0‐5 month infants, undefives and postpartum mother byprovince are presented in Annex 4.20.3. Exclusive BreastfeedThe best and most appropriate way to feed an infant is by giving breastfeedexclusively since newly born to age of 6 months and continued breastfeeding untilage of 24 months. Since age of 6 months, a baby gets nutritious complementaryfood based on the needs of baby growth and development.Coverage of exclusive breastfeeding is affected by i.e. limited breastfeedcounselor, not available regulation concerning breastfeed and not optimumeducation, socialozation, advocacy and campaign concerning breastfeed (ASI) andcomplementary feeding (MP‐ASI), not optimum group of complementarybreastfeed and breastfeed assistance as well as lack of facilities for communication,information and education (KIE) of breastfed. Graph 4.55 presents coverage of 0‐5month infants breastfed exclusively.GRAPH 4.55COVERAGE OF EXCLUSIVE BREASTFEED TO 05 MONTH INFANTSBY PROVINCE, 2009Source: BPS-Statistics <strong>Indonesia</strong>, Susenas 2009Susenas 2009 noted 61.3% infants aged 0‐5 months breastfed exclusivelyhad coverage ranging from 48.8% to 78.3%. Provinces with highest coverages121
122were West Nusa Tenggara, Bengkulu and East Nusa Tenggara, while provinceswith lowest coverages were East Java, Central Java and Aceh. Graph 4.55 showsthat provinces in eastern <strong>Indonesia</strong> has coverage of infants aged 0‐5 monthsbreastfed exclusively higher than provinces in Java and Bali islands.Percentage of breastfeeding infants aged 0‐5 months pattern by age groupcan be seen in table below.TABLE 4.4PATTERN OF BREASTFEEDING INFANTS AGED 05 MONTHSBY AGE GROUP, <strong>2010</strong>Pattern of BreastfeedingAge GroupExclusively Predominant Partially0 month 39.8 5.1 55.11 month 32.5 4.4 63.12 month 30.7 4.1 65.23 month 25.2 4.4 70.44 month 26.3 3.0 70.75 month 15.3 1.5 83.2Source: National Board of <strong>Health</strong> Research and Development, MoH RI, Riskesdas <strong>2010</strong>Remarks:Exclusively= feeding infants only with breastmilkPredominant= breastfeeding but having been feeding baby with water or water base, e.g. tea,as prelacteal food/drink before breastmilk comes inPartially= breastfeeding and feeding with processed food, e.g. formula milk, porridge,or other food before baby age 6 months, given as prelacteal or continued feedThe older infant is the fewer exclusive breastfeeding. There was 39.8%newborn (0 month) got breastfeed exclusively, while there was only 15.3% infantaged 5 months still got breastfeed exclusively. In predominant pattern, the lowerpercentage is the older infant age. On the other hand, in partial pattern, the olderinfant age is the higher percentage of partial breastfeeding. In the group of 0month infant, 55.1% has been fed with other food than breastmilk.Table 4.5 shows pattern characteristics of breastfeeding infant age 0‐5months. By sex, percentage of baby boy breastfed exclusively was 29%, higherthan percentage of baby girl breastfed exclusively 25.4%. Percentage of infant aged0‐5 month breastfed exclusively in rural (29.3%) was higher than in urban(25.2%).By education of family head, percentage of infant aged 0‐5 monthsbreastfed exclusively with not‐schooling head family was 34.5%, higher thanpercentage of infant aged 0‐5 month breastfed exclusively with not primary schoolgraduated family head was 31.4%. Meanwhile, percentage of infant aged 0‐5month breastfed exclusively with higher education graduated family head was22.4%. By household expenditure per capita, infant aged 0‐5 month from quintile 1had the highest proportion of exclusive breastfed with 34.7%, on the contrary,
infant aged 0‐5 month from the highest quintile (quintile 5) had the lowestproportion of exclusive breastfed with 17.5%.SexTABLE 4.5PATTERN OF BREASTFEEDING TO INFANTS AGED 05 MONTHBY CHARACTERISTICS, <strong>2010</strong>CharacteristicsLiving PlaceEducation of Family Headexclusively predominant partialMale 29.0 10.5 60.6Female 254 11.7 62.9Urban 25.2 10.5 64.3Rural 29.3 11.5 59.2Not Schooling 34.5 5.5 60.0Not Primary Graduate 31.4 10.0 58.6Primary Graduate 26.5 12.0 61.5Junior High Graduate 29.5 8.6 61.9Senior High Graduate 24.6 13.7 61.6Higher EducationGraduate 22.4 9.7 67.9Household Expenditure per CapitaPattern of BreastfeedingQuintile 1 34.7 9.9 55.4Quintile 2 30.5 11.3 58.1Quintile 3 26.6 10.4 63.0Quintile 4 19.9 14.6 65.5Quintile 5 17.5 8.7 73.8Source: National Board of <strong>Health</strong> Research and Development, MoH RI, Riskesdas <strong>2010</strong>On the other hand, intensive promotion and marketing related to formulamilk seems difficult to control. Many hospitals have not been supporting exclusivebreastfeed, indicated by not availability of integrated treatment of mother andinfant, low coverage of early initiation on breastfeeding and distribution of formulamilk in hospitals.Efforts to improve exclusive breastfeeding are increasing personnel knowledgeon benefit of exclusive breastfeeding, providing breastfeeding facility in working area,improving mother skill and knowledge, developing family and community supports andhow to control distribution of formula milk. In addition, another impotant thing is byapplying 10 ways to achieve breastfeeding success (LMKM) in hospital and otherhealth facilities that providing delivery care.The 10 ways are: 1) making breastfeeding; 2) training staff in healthfacilities; 3) education, information and communication (KIE) to pregnant womanon benefits and management of breastfeeding; 4) helping mother to early initiatebreastfeeding within first 60 minutes after delivery process; 5) assisting motherhow to breastfeed and keep it though mother and baby are placed separately; 6)only feeding breastmilk to newborn, except when there is medical indication; 7)applying integrated mother‐baby care for the whole day (24 hours); 8)123
encouraging mother to breastfeed based on baby demand; 9) not providing greasenipple to baby; and 10) encouraging the establishment of breastfeeding supportingteam and referring mother to join the team as soon as discharging from healthfacility.4. Coverage of Underfive Weighing in Posyandu (D/S)Coverage of underfive weighing in Posyandu (D/S) is an indicator related tocoverage of nutrition care to underfive, coverage of primary health service,especially immunization and prevalence of malnutrition. The higher coverage ofD/S is the higher coverage of vitamin A, and the higher coverage of immunizationis the lower prevalence of malnutrition.According to report from provincial health offices, in <strong>2010</strong> coverage ofunderfive weighing in Posyandu was 67.87%. Target of Strategic Planning(Renstra) in <strong>2010</strong> was 65%. It means percentage of underfive weighing inPosyandu nationally had met the target. From 33 provinces, 16 provinces (48.5%)had met the target. Coverage of underfive weighing in Posyandu by province in<strong>2010</strong> is presented in Graph 4.56.GRAPH 4.56PERCENTAGE OF UNDERFIVE VISIT AND WEIGHED IN POSYANDU (D/S)BY PROVINCE, <strong>2010</strong>TARGET RENSTRA <strong>2010</strong>D/S : 65%Source: DG of Nutrition and Maternal and Child <strong>Health</strong>, MoH RIThree provinces with highest coverage of underfive weighing in Posyanduwere North Sulawesi (84.89%), Central Java (82.54%) and East Java (77.70%),while three provinces with lowest coverage were Papua (31%), West Papua(33.23%) and East Kalimantan (35.96%).124
Riskesdas <strong>2010</strong> indicates national coverage of weighing underfive (age 6‐59months) on the last 6 months was 76.3%. Graph 4.57 shows that most provinces(21 provinces) had met target of D/S in <strong>2010</strong> with 63.6%.GRAPH 4.57PERCENTAGE OF WEIGHING UNDERFIVE (AGE 659 MONTHS) FOR THE LAST 6 MONTHS (D/S)BY PROVINCE, <strong>2010</strong>Source: National Board of <strong>Health</strong> Research and Development, MoH RI, Riskesdas <strong>2010</strong>By age, the older age of infant is the lower percentage of weighing for thelast 6 months. In group of age 6‐11 months, the percentage of weighing reached90.3%, but in group of age 48‐59 months, the percentage of weighing was 66.2%.By type of area, percentage of weighing underfive aged 6‐59 months living inurban (for the last 6 months) was 81% higher than those in rural with 71.2%.By education, the higher education level of family head is the highercoverage of weighing infant aged 6‐11 months (for the last 6 months). In age groupof 6‐11 months with not schooling family head, the coverage of weighing was66.7%, while those with higher education graduates had coverage of 82.2%. Byhousehold expenditure per capita, the higher level of expenditure is the higherpercentage of weighing infant aged 6‐11 months for the last 6 months.By place of weighing, nationally most underfive aged 6‐59 months for thelast 6 months was weighed in Posyandu, which was 80.6%. In Gorontalo, NorthMaluku, West Nusa Tenggara and DI Yogyakarta, more than 90% underfive aged 6‐59 months was weighed in Posyandu. Three provinces with highest percentage ofunderfive aged 6‐59 months weighed in Hospital for the last 6 months were DKIJakarta (14.6%), Central Kalimantan (10.3%) and East Kalimantan (10%).E. HEALTH SERVICE IN POSTDISASTER SITUATIONDisaster in <strong>Indonesia</strong> is classified into 2 categories. They are environmentaland natural disasters. Environmental disaster occurs as results of environmentdamage. It includes flood, landslide, drought, land and forest burning, industrialaccident, and oil spilling on sea. On the other hand, natural disaster occurs as earthcrust activities or natural phenomenon, such as earthquake, tsunami, volcaniceruption and storm that are unpredictable. Number of victims and displaced125
people by type of disaster and victim condition in <strong>2010</strong> can be seen in Graph 4.58below.GRAPH 4.58NUMBER OF VICTIMS BY VICTIM CONDITION IN <strong>2010</strong>Source: Center for Crisis Response, MoH RIAccording to Center for Crisis Response, Ministry of <strong>Health</strong>, during <strong>2010</strong>,flood was the most disaster occurred in 27 provinces in <strong>Indonesia</strong>. It had killed 33people, injured seriously 59 people that need inpatient care, injured slightly26,565 people that need outpatient care and caused 12 people missing and 90,604people internally displaced.Disaster that caused the most victims was volcano eruption, occurring in 4provinces. Number of victims during <strong>2010</strong> was 382 died, 2,787 seriuosly injured(need inpatient care), 63,286 slightly injured, 4 missing and 8,159 internallydisplaced. However, disaster causing the most victims was earthquake andtsunami, which killed 509 people. Disaster by type and number of victims in <strong>2010</strong>can be seen in Annex 4.42.That is description of health efforts in <strong>Indonesia</strong> until <strong>2010</strong>.***126
<strong>Health</strong> resource is one supporting factor for the provision of quality healthservices, which are expected to improve community health status. In this chapter,health resources are reviewed by presenting situation description of health facilities,health personnel, and health financing.A. HEALTH FACILITIES<strong>Health</strong> facilities which are presented in this chapter include: health centers,hospitals (public hospitals and specialty hospitals), facilities of <strong>Health</strong> EffortCommunity Based (Ind=UKBM), facilities of pharmaceutical production/distributionand medical devices, as well as educational institutions of health personnel.1. <strong>Health</strong> Center<strong>Health</strong> Center or Puskesmas is one of the technical implementation units of theDistrict/Municipality <strong>Health</strong> Office. <strong>Health</strong> Center as a first‐level health care units andleading in the health care system, should make efforts mandatory health and someselected health efforts accordance to the conditions, needs, demands, capabilities andinnovation as well as local government policy. <strong>Health</strong> center has functions as: 1)development center with health oriented, 2) community empowerment center, 3)community primary health care center, and 4) individual primary health care center.Number of health centers in <strong>Indonesia</strong> recorded until the end of <strong>2010</strong> were asmany as 9,005 units, with details of the number of inpatient health centers 2,920units and outpatient health care as much as 6,085 units. One of the indicators used todetermine affordability to health center is the ratio of health center per 100,000population. In the period 2006 to <strong>2010</strong>, this ratio indicated an increase. Ratio ofhealth center per 100,000 population in 2006 was 3.61, in the year <strong>2010</strong> increased to3.79, as shown in Graph 5.1 below.133
GRAPH 5.1RATIO OF HEALTH CENTER PER 100.000 POPULATION, 2006<strong>2010</strong>Source : Center for Data and Information, MoH RIRatio of health center per 100,000 population by province shows that thehighest ratio in <strong>2010</strong> was in West Papua, amounting to 13.94, while the lowest ratioin Banten, amounting to 2.04. Description of health center ratio by province in <strong>2010</strong>can be seen in Graph 5.2. While the details of the number and ratio of health centerper 100,000 population by province in <strong>2010</strong> can be found in Annex 5.1.GRAPH 5.2RATIO OF HEALTH CENTER PER 100.000 POPULATION, <strong>2010</strong>Source : Center for Data and Information, MoH RI134
In an effort to improve the quality of public health services in health centers,some outpatient health centers have improved the status to be inpatient health centers.The number of inpatient health centers in 2009 as many as 2,704 units increased to2,920 units in <strong>2010</strong>. The development of inpatient and outpatient health centers in theyear 2006‐<strong>2010</strong> can be seen in Graph 5.3. Details regarding the amount of inpatient andoutpatient health centers by province can be seen in Annex 5.2.GRAPH 5.3NUMBER OF HEALTH CENTERS WITH BEDS (INPATIENT) AND WITHOUT BED (OUTPATIENT)2006 – <strong>2010</strong>Source : Center for Data and Information, MoH RITo improve health care outreach of health centers in their working areas,health centers are supported by health care facilities in the form of sub health centers(Ind=Puskesmas Pembantu=Pustu). Number of Pustu in <strong>2010</strong> was reported as many as23,049 units with a ratio of 2.6 Pustu to health center. Details for number of Pustu byprovince in <strong>2010</strong> can be found in Annex 5.2.2. HospitalThe scope of health development in addition to promotive and preventiveefforts, there are also curative and rehabilitative health development. The hospital is ahealth care to the community engaged in curative and rehabilitative activities. Thehospital also serves as referral health care facilities.In <strong>2010</strong> the number of hospitals in <strong>Indonesia</strong> were as much as 1,632 units,which consist of general hospitals (Ind=RSU) amounted to 1,299 units and specialtyhospitals (Ind=RSK) amounted to 333 units. The hospitals are managed by the Ministryof <strong>Health</strong>, provincial government, district/municipality governments, military/police,other ministries/state‐owned enterprises and private sector.From 2006 to <strong>2010</strong> there were an increasing number of hospitals, both generalhospitals and specialty hospitals. Over the last 5 years, the number of hospitalincreased by 26.32% from 1,292 units in 2006 to 1,632 units in <strong>2010</strong>.135
Table 5.1 below shows the development of the number of hospitals (generaland specialty hospitals) in <strong>Indonesia</strong> from 2006 until <strong>2010</strong>. While the total number ofhospitals in <strong>2010</strong> according to organizer/ownership and province can be seen in Annex5.3.TABLE 5.1NUMBER OF HOSPITALS (GENERAL & SPECIALTY)IN INDONESIA, 2006 – <strong>2010</strong>No Organizer/Ownership 2006 2007 2008 2009 <strong>2010</strong>1 Ministry of <strong>Health</strong> andGovernment ofProvince/District/Municipality464 477 509 552 5852 Army/Police 112 112 112 125 1313 State Ownership/Other Ministries 78 78 78 78 784 Private 638 652 673 768 838Total 1,292 1,319 1,372 1,523 1,632Source: DG of <strong>Health</strong> Effort, MoH RIDuring the last period of 5 years (2006‐<strong>2010</strong>) the number of general hospitalsmanaged by both government and private sector institutions had increased, in 2006there were 1,012 units increased to 1,299 units in <strong>2010</strong>. Number of public hospitalsin <strong>Indonesia</strong> according to manager can be seen in Annex 5.4. Development of generalhospital (Ind=RSU) in <strong>Indonesia</strong> during the last 5 years can be seen in Graph 5.4.GRAPH 5.4NUMBER OF GENERAL HOSPITALSIN INDONESIA, 2006 – <strong>2010</strong>Source: DG of <strong>Health</strong> Effort, MoH RI136
General hospitals which managed by the Ministry of <strong>Health</strong> and localgovernments shows that most general hospitals belonging to class C‐hospitals. Fromthe total 506 general hospitals, there were 250 units (49.41%) of class C, 126 units(24.90%) of Class D, 120 units (23.72%) of class B, and 10 units (1.98%) of Class A.Graph 5.5 as follows presents the percentage of general hospital (Ind=RSU) by class ofhospital.GRAPH 5.5NUMBER OF GENERAL HOSPITALSOWNED BY MINISTRY OF HEALTH AND LOCAL GOVERNMENTS BY CLASS<strong>2010</strong>Source: DG of <strong>Health</strong> Effort, MoH RIThere were 10 general hospitals for the Ministry of <strong>Health</strong> and localgovernments, including Class A, which were present in 9 cities of Medan, Palembang,Jakarta, Bandung, Semarang, Yogyakarta, Surabaya, Denpasar and Makassar. Moredetailed information regarding the number of general hospitals managed by theMinistry of <strong>Health</strong> and local governments by hospital class and province can be seenin Annex 5.5.Number of specialty hospitals (Ind=RSK) both public and private hospitals inthe period 2006‐<strong>2010</strong> showed an increase. In 2006 there were 280 units of specialtyhospitals, increased to 333 units in <strong>2010</strong>. The number of RSK during the last 5 yearscan be seen in Graph 5.6.137
GRAPH 5.6NUMBER OF SPECIALTY HOSPITALSIN INDONESIA, 2006 – <strong>2010</strong>Source: DG of <strong>Health</strong> Effort, MoH RIMost of those specialty hospitals were Maternal and Children Hospitals were107 units, Maternity Hospitals as many as 65 units and Mental Hospitals as many as51 units. Details can be seen in Graph 5.7. Number of specialty hospitals and inpatientbeds years 2006‐<strong>2010</strong> can be seen in Annex 5.6.GRAPH 5.7NUMBER OF SPECIALTY HOSPITALS IN INDONESIA, <strong>2010</strong>Source: DG of <strong>Health</strong> Effort, MoH RINumber and ratio of hospital beds to population can be used to describe thecapacity of hospitals to provide health services to community, including as a referralhealth care facilities. Number of beds in general hospitals and specialty hospitals inthe last 5 years have showed an increase. Description of those improvement can beseen in Graph 5.8 below.138
GRAPH 5.8NUMBER OF HOSPITAL BEDSIN GENERAL HOSPITALS AND SPECIALTY HOSPITALSIN INDONESIA, 2006 – <strong>2010</strong>Source: DG of <strong>Health</strong> Effort, MoH RIThe ratio of hospital beds to population from the year 2006‐<strong>2010</strong> was alsoincreased, the ratio in 2006 of 63.25 rising to 69.97 per 100,000 population in <strong>2010</strong>.Graph 5.9 presents the number of beds and ratio of beds per 100,000 population inhospital in the year 2006‐<strong>2010</strong>.GRAPH 5.9NUMBER OF HOSPITAL BEDS ANDRATIO OF HOSPITAL BEDS PER 100,000 POPULATION, 2006 – 2009Source: DG of <strong>Health</strong> Effort, MoH RI139
Proportion of beds in general hospitals and specialty hospitals according toclass treatment shows that most of all were Class III hospitals, amounting to 39.5%,followed by 20.2% for Class II and 10.6% for Class I. In addition to the three types ofclasses such treatments, there was the VIP class of 7.5% and no grade of 22.1%.Details about the number and percentage of beds in general hospitals and specialtyhospital according to the type of treatment class and province can be seen in Annex5.7.3. Production and Distribution Facilities of Pharmaceutical and Medical DeviceSupplyDrug is one of irreplaceable components in health care. Access to drugs, especiallyessential drugs is one of human rights. Thus the provision of essential drugs is anobligation for the government and health care institutions, both public and privateinstitusions. As special commodities, all drugs in circulation should be ensured itssafety, efficacy and quality in order to provide health benefits. Therefore, one of theefforts made to ensure the quality of drugs into the hands of consumers is to providea means of storage of drugs and medical devices that can maintain the physical safetyand can maintain the quality of medicines in addition to trained personnel manager.Pharmaceutical installation is a management unit of pharmaceutical suppliesand medical devices that exist at the province and district/municipality, as means ofprocurement, registration, storage, distribution, control, administration, reporting andevaluation activities necessary for pharmacy services. Until the year <strong>2010</strong> number ofpharmaceutical installations were 490 units, the details by province can be seen inGraph 5.10.GRAPH 5.10NUMBER OF PHARMACY INSTALLATIONS BY PROVINCE, <strong>2010</strong>Source: DG of Pharmaceutical and Medical Device, MoH RI140
One of the policy implementation of the Program for Drugs and MedicalSupplies is drug and medical supplies control that is directed to ensure the safety,efficacy and quality of pharmaceuticals and medical devices. It aims to protect thepublic from harm caused by misuse of pharmaceuticals and medical devices or the useof the wrong/incorrect and not meet safety and utilization of quality made since theproduction process, distribution to its use in public.Number of production and distribution facilities spread across 33 provincesillustrate the variation of facilities in the fields of pharmaceuticals and medical deviceshaving disparity that was still relatively high number between <strong>Indonesia</strong>'s westernregion, Central and East. Most of production and distribution facilities were located in<strong>Indonesia</strong>'s western areas which were Sumatra and Java Islands. 94.25% of productionfacilities and 75.12% of distribution facilities spread on the island of Sumatra and Java.This fact can be used as a reference in the policy to develop the means of productionand distribution of pharmaceutical and medical devices, especially in eastern part of<strong>Indonesia</strong>, causing the smooth distribution of facilities throughout <strong>Indonesia</strong>. Inaddition, it aims to open up access to public affordability of health facilities in the fieldsof pharmaceuticals and medical devices. Pharmaceutical production and medicaldevices facilities include Pharmaceutical Industry, Traditional Medicine Industry(Ind=IOT), Traditional Medicines Small Industry (Ind=IKOT), Medical DevicesProduction, <strong>Health</strong> and Household Supplies (Ind=PKRT) and Cosmetic Industry. Duringthe last period of 5 years, from 2006 to <strong>2010</strong>, there were an increasing number ofpharmaceutical production facilities and medical devices. This can be seen in Graph5.11. Number of production facilities in <strong>Indonesia</strong> in <strong>2010</strong>, specified according toprovince can be seen in Annex 5.8.GRAPH 5.11NUMBER OF PRODUCTION FACILITIES OF PHARMACEUTICAL AND MEDICAL DEVICES2006<strong>2010</strong>Source: DG of Pharmaceutical and Medical Device, MoH RI141
While distribution facilities of pharmaceutical and medical devices includeWhole Saler (Ind=Pedagang Besar Farmasi/PBF), Pharmacy/Dispensaries(Ind=Apotek), Drug Stores, <strong>Health</strong> Supplies (Ind=Penyalur Alat Kesehatan/PAK) andSub/Branch of <strong>Health</strong> Supplies (Ind=Sub/Cabang Penyalur Alat Kesehatan/PAK).Number of pharmaceutical and medical devices distribution facilities over the last fiveyears (2006‐<strong>2010</strong>) can be found in Graph 5.12. Number of distribution facilities in<strong>Indonesia</strong> in <strong>2010</strong>, specified according to the province can be seen in Annex 5.9.GRAPH 5.12NUMBER OF DISTRIBUTION FACILITIES OF PHARMACEUTICAL AND MEDICAL DEVICES2006<strong>2010</strong>Source: DG of Pharmaceutical and Medical Device, MoH RI4. Community Based <strong>Health</strong> EffortEfforts to improve public health status were done by applying some varietiesof approaches, including by involving community potential. This is in line with theconcept of empowerment of community development. The move was reflected in thedevelopment of facilities of <strong>Health</strong> Effort Community Based (Ind=UKBM). UKBMconsists of integrated services posts (Ind=Pos Pelayanan Terpadu/Posyandu), villagehealth post (Ind=Pos Kesehatan Desa/Poskesdes in Desa Siaga), family medicinalplants (Ind=Tanaman Obat Keluarga/Toga), and Village Drugs Post (Ind=Post ObatDesa/POD).One type of UKBM which has been developed and entrenched in the communityis posyandu. In carrying out its functions, posyandu is expected to carry out fivepriorities from programs of maternal and children health, family planning, nutrition,immunization, and prevention of diarrhea. In order to assess the performance anddevelopment, posyandu is classified into four levels, namely Posyandu Pratama(basic/first level posyandu), Posyandu Madya (second/medium level posyandu),Posyandu Purnama (third level posyandu) and Posyandu Mandiri (high142
level/independent posyandu). In 2009 there were 266,827 posyandu, so the ratio ofposyandu to villages was 3.55 posyandu per village. More information on posyandu ratioby province in 2009 can be seen in the Graph 5.13 below.GRAPH 5.13RATIO OF POSYANDU TO VILLAGE BY PROVINCE IN INDONESIA2009Source: DG of Community <strong>Health</strong>, MoH RIPoskesdes is a unit of health effort community based (Ind=UKBM) in the villagein order to bring the provision of basic health services for rural communities, in otherwords as one manifestation of the efforts to facilitate community access to healthservices. The main activities of poskesdes are early observation and vigilance(surveillance of risk behaviors, environmental and other health problems), handlinghealth emergencies and disaster preparedness and health services. The servicesprovide also includes delivery assistance and maternal and children care services.The existence of poskesdes is one indicator of a rural village called desa siaga. Datastates that in 2009 there were 51,996 units of poskesdes/desa siaga. Ratio ofposkesdes/desa siaga to village in the year 2009 was 0.69. For information, number ofdesa siaga in DKI Jakarta are number of RWsiaga and number of villages in WestSumatra are number of desa siaga plus nagari siaga. Graph 5.14 presents the ratio ofnumber of poskesdes to village by province in 2009 (excluding DKI Jakarta and WestSumatera). While details data on the number of UKBMs by province in 2009 can beseen in Annex 5.10.143
GRAPH 5.14RATIO OF POSKESDES TO VILLAGE BY PROVINCE IN INDONESIA, 2009Source: DG of Community <strong>Health</strong>, MoH RI5. Education Institutions of <strong>Health</strong> Personnela. Number, Type and Distribution of Education InstitutionsSustainable health development requires adequate health personnel both interms of type, quantity and quality. To produce a quality health course required aquality educational process as well. Ministry of <strong>Health</strong> is the institution of thegovernment sector that plays a role in the provision of quality health care. Educationof health personnel in the administration of secondary education and diploma that isunder controlled by the Ministry of <strong>Health</strong> <strong>Health</strong>, are grouped by <strong>Health</strong> Polytechnic(owned by Ministry of <strong>Health</strong>) and Non <strong>Health</strong> Polytechnic (private property,Army/Police and Local Government properties).Education program diploma III of health personnel education institutions(Ind=Pendidikan Tenaga Kesehatan=Diknakes) is currently growing rapidly, both intypes and amount in each province. Until December <strong>2010</strong>, number of Diknakesinstitutions were as much as 1,229 institutions, which consist of 243departments/programs of study (spread in 33 health polytechnis) and 986 nonhealthpolytechnic institutions. Number of courses of study (study programs) inhealth polytechnic and non health polytechnic institutions can be seen in Graph 5.15below.144
GRAPH 5.15NUMBER OF STUDY PROGRAMS IN HEALTH POLYTECHNIC INSTITUTIONSAND NON HEALTH POLYTECHNIC INSTITUTIONS IN INDONESIA, 2005<strong>2010</strong>Source: National Board of <strong>Health</strong> Human Resources Development & Empowerment, MoH RIIn Graph 5.15 it can be seen an increase in number of majors/study programsin Poltekkes each year, this according to the needs of types of health personnel andequitable production of health personnel. In <strong>2010</strong> there were some additions of 22study programs, from 221 in 2009 to 243 study programs. Likewise, number of nonhealthpolytechnic institutions increased by 67 institutions, from 919 institutions in2009 to 986 institutions in <strong>2010</strong>.Graph 5.16 shows number of study programs at the health polytechnicinstitutions Diknakes. Most of study programs were Nursing (71), Midwifery (57) andNutrition (30). Details information by province can be seen in Annex 5.11.GRAPH 5.16NUMBER OF STUDY PROGRAMS IN HEALTH POLYTECHNIC INSTITUTIONSIN INDONESIA, <strong>2010</strong>Source: National Board of <strong>Health</strong> Human Resources Development & Empowerment, MoH RI145
Graph 5.17 shows number of majors/study programs at the non‐healthpolytechnic institutions Diknakes; then majors/study programs of nursing consists ofnursing, midwifery and dental health; majors/study programs of physical therapyconsist of physiotherapy, occupational therapy, speech therapy and acupuncture.GRAPH 5.17NUMBER OF ACADEMIC FIELDS/STUDY PROGRAMSIN NON HEALTH POLYTECHNIC INSTITUTIONS IN INDONESIA, <strong>2010</strong>Source: National Board of <strong>Health</strong> Human Resources Development & Empowerment, MoH RIb. Accreditation of InstitutionWith so many institutions of health personnel education that exist today, theMinistry of <strong>Health</strong> seeks to continuously improve the quality of education.Accreditation is one of the construction efforts done by the government toward theexisting institutions of health education, also to see the quality of each institution.Accreditation is carried out for new institutions that have been running forclasses up to 5 st semester and for existing institutions that have expired accreditation.Starting in 2004 Center for <strong>Health</strong> Personnel Education (Ind=Pusat Pendidikan TenagaKesehatan=Pusdiknakes) has performed accreditation of majors/study programs ofexisting health polytechnic studies. Until the year <strong>2010</strong>, 192 study programs of healthpolytechnic (79.01%) have been accredited and 51 study programs (20.99%) have notyet accredited. Of those number that have been accredited, there were 87 studyprograms (45.31%) with strata A, 100 study programs (52.08%) with strata B and 5study programs (2.60%) with strata C. Graph 5.18 as follows shows the percentage ofthe accreditation program of study at the health polytechnic institutions.More information about number and percentage of health polytechnicinstitutions that have been accredited by province can be seen in Annex 5.13.146
GRAPH 5.18PERCENTAGE OF ACCREDITATION GRADESFOR STUDY PROGRAMS OF HEALTH POLYTECHNIC IN INDONESIA, <strong>2010</strong>Source: National Board of <strong>Health</strong> Human Resources Development & Empowerment, MoH RIAccreditation is also carried out on Diknakes institutions of non healthpolytechnics. Number of institutions that have been accredited as many as 608institutions (61.66%) and that have not been accredited as many as 378 institutions(38.34%). Of those amount that have been accredited, there were 86 institutions(14.14%) with Grade A, 471 institutions (77.47%) with Grade B and 52 institutions(8.55%) in Grade C. Graph 5.19 as follows shows the percentage of accreditationgrades from Diknakes institutions of non health polytechnic in <strong>2010</strong>. While detailedinformation by province are in Annex 5.14.GRAPH 5.19PERCENTAGE OF ACCREDITATION GRADESFOR STUDY PROGRAMS OF NON HEALTH POLYTECHNIC IN INDONESIA, <strong>2010</strong>Source: National Board of <strong>Health</strong> Human Resources Development & Empowerment, MoH RI147
Number of Diknakes institutions of non health polytechnics according to theownership status shows mostly owned by private institutions, amounting to 86.29%,while others 10.45% owned by local governments and 3.26% owned by army/police.More detailed information on number and percentage of Diknakes institutions of nonhealth polytechnics based on ownership can be seen in Annex 5.15.c. StudentsNumber of students from both health personnel education institutions andnon health polytechnic institutions in common pathway of the academic year<strong>2010</strong>/2011 (326,801 students) than the academic year 2009/<strong>2010</strong> (296,132students) increased by 30,669 students or 10.36%. This is in accordance with theincreasing number of institutions of health personnels.In order to increase health services to the community, it needs more qualifiedhealth personnels. In this regard since 2004, besides holding a D‐III, healthpolytechnic institutions also provide D‐IV program and International Class. In 2009the existing IV‐D programs throughout <strong>Indonesia</strong> had 2,020 students.Program of Diploma IV has more types of educational institutions which aremore specialized in knowledge background on which to type of institution nursing,midwifery and dental health. Type of nursing institutions consist of medical surgicalnursing, emergency nursing, clinical nursing skills, cardiovascular nursing, anesthesianursing, mental nursing, intensive nursing and reanimation anesthesia nursing. Typeof midwifery institutions consist of community midwives and educators of midwives.This type of dental health institutions consist of dental health, community dentalhealth, prothodansia dental health, dental oral surgery and educators of dental nurse.More detailed information on number of students by type of education institution canbe seen in Annex 5.16, Annex 5.17 and Annex 5.18.d. GraduatesNumber of health polytechnic graduates and non health polytechnic graduatesin <strong>2010</strong> were 74,778 graduates, consisting of polytechnic graduates were 14,612graduates (19.54%) and non health polytechnic graduates of nursing as many as60,166 graduates (80.46%). The highest number of graduates from healthpolytechnic/non health polytechnic were 32,938 graduates which from majors/studyprograms of nursing then midwifery graduates as much as 14,611 students.148
TABLE 5.2NUMBER OF GRADUATES OF DIPLOMA IIIPROGRAM OF HEALTH POLYTECHNICS AND NON HEALTH POLYTECHNICS2006<strong>2010</strong><strong>Health</strong> PersonnelsYear2006 2007 2008 2009 <strong>2010</strong>Total5 YearsAverage ofGraduatesper YearNursery 23,811 25,200 26,446 28,835 37,055 141,347 26,928Midwifery 8,264 13,337 9,131 18,545 17,828 67,105 13,421Dental <strong>Health</strong> 742 857 1166 1,085 1,468 5,318 1,064Pharmacy 2,236 2,285 5,562 4,864 8,134 23,081 4,616Environmental <strong>Health</strong> 1,557 1,396 1,870 1,685 2,177 8,685 1,737Nutrition 1,415 1,693 2,039 1,812 2,063 9,022 1,804Physical Therapy 858 965 998 781 1,653 5,255 1,051Medical Technician 3,473 3,644 5,131 4,764 7,160 24,172 4,834Total 42,356 49,377 52,343 62,371 77,538 283,985 56,797Source: National Board of <strong>Health</strong> Human Resources Development & Empowerment, MoH RITable 5.2 above shows that the average graduates over the last 5 years ofDiknakes graduates of Diploma III (Poltekkes and Non Poltekkes) were 56,797graduates, with most graduates were nursing staff (an average of 26,928 graduates),which spread almost in all provinces. Three provinces that produce graduates most ofhealth workers (polytechnic and non‐polytechnic institutions) in <strong>2010</strong> were Provinceof Central Java (12,447 graduates), North Sumatra (9,631 graduates) and East Java(8,416 graduates).Recapitulation of the number of graduates from Diknakes polytechnic/nonhealth polytechnic by type of health personnel can be seen in Annex 5.1.The details by province can be seen in Annex 5.20 and Annex 5.21.B. HEALTH PERSONNELS<strong>Health</strong> human resources in local government consist of health humanresources in charge of health units (service and non‐services facilities) in theprovince and district/municipality, with the employment status of civil servants, civilservant candidates (Ind=CPNS), non permanent employee (Ind=Pegawai TidakTetap=PTT), Army/Police and private sector. Those health human resources areworking at the provincial health office and the technical implementation unit (UPT),district/municipality and technical implementation unit (Ind=UPT), hospitals/polyclinics and other health facilities owned by the central government, localgovernment, private and Army/Police.Data of <strong>Health</strong> Human Resources (<strong>Health</strong> HR) collected from 33 provincescould not fully describe the health human resources completely, due to:1. District/municipality did not have complete data of <strong>Health</strong> Human Resources,particularly hospital data both for other Ministry, Army/Police and private.2. There was currently no reliable system that regulates data collecting managementof human resources.149
<strong>Health</strong> human resources data had already described the health personnels atdistrict/municipality and province, but only in government health facilities (healthoffices and their UPT and Ministry of <strong>Health</strong> and its UPT).1. Number and Ratio of <strong>Health</strong> PersonnelsOne of the elements that play a role in accelerating health development is theduty of health personnel in health care facilities in community. According to the datacollection of National Board of <strong>Health</strong> Human Resources Development andEmpowerment (Ind=Badan PPSDMK), personnels were recorded as many as 501,052people consist of 391,745 health personnels and 109,307 non‐health personnels.<strong>Health</strong> personnels consist of 42,467 medical staffs, 266,348 nursing staffs (169,797nurses and dental nurses, 96,551 midwives), 18,022 pharmaceutical staffs, 34,869public health staffs, 12,823 nutrition staffs, 2,587 physical therapists and 17,216medical technicians.Number of physicians were as many as 25,333 personnels, with a ratio of10.66 physicians per 100,000 population. Province with the highest ratio was DKIJakarta amounting to 34.37 physicians per 100,000 population, whereas the lowestratio was Banten at 5.05 physicians per 100,000 population. Ratio of physicians tototal population in each province in <strong>2010</strong> can be seen at the Graph 5.20 below.GRAPH 5.20RATIO OF PHYSICIANS TO 100,000 POPULATION IN INDONESIA, <strong>2010</strong>Source: National Board of <strong>Health</strong> Human Resources Development & Empowerment, MoH RINumber of dentists in <strong>2010</strong> there were 8,731 dentists with a ratio of 3.67dentists per 100,000 population. Province of DKI Jakarta had highest ratio of 12.35dentists per 100,000 population, while the lowest was South Sumatra with ratio of1.25 dentists per 100,000 population. Number of midwives by the year <strong>2010</strong> therewere 96,551 midwives, so that its ratio to the population was 40.63 midwives per150
100,000 population. Province of Aceh with the highest ratio 144.98 midwives per100,000 population while the lowest was DKI Jakarta as much as 19.74 midwives per100,000 population.Number of nurses by the year <strong>2010</strong> were 160,074 personnels, so nurses ratioto the population was 67.36 nurses per 100,000 population. Province with the highestratio was DKI Jakarta amounting to 259.77 nurses per 100,000 population while thelowest in Bantam as much as 23.16 nurses per 100,000 population. Number of healthand non health personnels in <strong>2010</strong> by province can be seen in Annex 5.22.a. <strong>Health</strong> Personnel in <strong>Health</strong> Center<strong>Health</strong> Center which is spearheading the public health service, its performanceis greatly influenced by the availability of human resources existing, especially theavailability of health personnel. In <strong>2010</strong>, there were 255,563 people working in healthcenters with details 225,040 health personnels and 30,523 non health personnel. Of thetotal number of health personnels, there were 14,934 physicians who served in healthcenter, with a ratio of 1.66 physicians per health center. The highest ratio of physiciansto health center was in Riau Islands (3.37), followed by Bali (2.99). Some provinceshave specialist doctors on duty in health center. Ratio of physicians in communityhealth centers to the number of health centers in <strong>2010</strong> can be seen in the Graph 5.21below.GRAPH 5.21RATIO OF PHYSICIANS IN HEALTH CENTER TO NUMBER OF HEALTH CENTERSIN INDONESIA, <strong>2010</strong>Source: National Board of <strong>Health</strong> Human Resources Development & Empowerment, MoH RINumber of dentists in the year <strong>2010</strong> were 6,140 dentists. When those numberwere compared with the total number of health centers, it means that not all healthcenters have dentist.151
In <strong>2010</strong> there were 120 specialist doctors on duty in health center, most ofthese specialists were in DKI Jakarta with 33 specialist doctors (27.5%). Number ofnurses in all health centers as many as 78,215 nurses, so that on average each unithad 8‐9 nurses. Amount of each type of health personnel in health centers can be seenin Graph 5.22 below. Details of the number of health personnel in health centers canbe seen in Annex 5.23, while the ratio of physicians, dentists, nurses and midwives tothe number of health centers can be seen in Annex 5.24.GRAPH 5.22NUMBER OF HEALTH PERSONNELS IN HEALTH CENTERSIN INDONESIA, <strong>2010</strong>Source: National Board of <strong>Health</strong> Human Resources Development & Empowerment, MoH RIb. <strong>Health</strong> Personnels in HospitalsData of health personnels in hospitals recorded by National Board of <strong>Health</strong>Human Resources Development and Empowerment in <strong>2010</strong> came from 473 hospitalsof 506 existing government hospitals. In <strong>2010</strong>, there were 142,521 people working ingovernment hospitals with details of 111,998 health personnels and 30,523 nonhealth personnels. Of the total number of health personnels, specialist doctors whoserved in government hospitals as many as 7,593 specialists, with an average of 16specialists per hospital; physicians who served in government hospitals as many as6,685 physicians, with an average of 14 physicians per hospital and dentists whoserved in government hospitals as many as 1,741 dentists, with an average of 4dentists per hospital. Midwives who served in government hospitals as many as10,510 midwives, with an average of 22 midwives per hospital and nurses whoserved in government hospitals as many as 66,701 nurses, with an average of 128nurses per hospital. Details of number of health personnels in government hospitalscan be seen in Annex 5.25.2. <strong>Health</strong> Personnels with Non Permanent Employee Status (Ind: PTT)<strong>Health</strong> personnel with PTT status (Ind=PTT=Pegawai Tidak Tetap) consist ofspecialist doctors, physicians, dentists and midwives. Up to year <strong>2010</strong> there were31,840 health personnels with PTT status still on active duty in local government152
with the criteria Reguler, Remote, and Very Remote Area with composition of 50specialist doctors, 2,614 physicians, 800 dentists, and 28,376 midwives.Specialist doctors with PTT status mostly spred in areas with Remote criteria,there were 26 specialists, while for the region with Reguler criteria there were 14specialists, then in Very Remote Area there were 10 specialists. Physicians anddentists with PTT status mostly spred in very remote areas, that were 1,629physicians and 564 dentists, while the PTT midwives mostly in Reguler area criteriawith 16,789 midwives.Province with the largest presence of PTT specialist was North Sumatra with 8specialists. The largest number of PTT physicians was in East Nusa Tenggara with348 physicians, followed by 202 physicians in Aceh and 158 physicians in NorthSumatra, while the largest number of PTT dentists on duty was in East Nusa Tenggarawith 98 dentists, followed by 58 dentists in Aceh and 52 dentists in East Java. Thelargest number of PTT midwives on duty in North Sumatra with 4,640 midwives,followed by 4,547 midwives in Central Java and 2,986 midwives in East Java.Graph 5.23 shows the condition of PTT personnels in <strong>Indonesia</strong> in <strong>2010</strong>. Moredata on distribution of PTT health personnels in all provinces can be seen in Annex5.25, 5.26 and 5.27.GRAPH 5.23NON PERMANENT EMPLOYEES OF PHYSICIANS, DENTISTS AND MIDWIVESIN INDONESIA, <strong>2010</strong>Source: Bureau of Personnel, MoH RIIn the year <strong>2010</strong>, health personnels have been appointed to local governmentswith the criteria of PTT Regular, Remote and Very Remote area as many as 17,037personnels, consisting of 35 PTT specialists, 3,461 PTT physicians, 975 PTT dentistsand 12,601 PTT midwives. The largest number of recruitment of PTT healthpersonnels was in East Nusa Tenggara consist of 411 PTT physicians and 132 PTTdentists, with recruitment for Very Remote area there were 388 physicians and 131dentists. Next province with the second number of recruitment was Maluku with 340153
physicians and 112 dentists. Graph 5.24 shows the recruitment of PTT physicians andPTT dentists in <strong>2010</strong>.GRAPH 5.24RECRUITMENT OF NON PERMANENT EMPLOYEE (PTT) PHYSICIANS AND DENTISTSIN INDONESIA, <strong>2010</strong>Source: Bureau of Personnel, MoH RIThe largest recruitment of PTT midwives was in North Sumatra, there were1,608 midwives, among them 965 midwives were placed in remote area and 643midwives were placed in reguler area. Next province with second largest of midwiveswas Central Java with 1,558 midwives, among them 1,548 midwives were placed inreguler area and 10 midwives were placed in remote area. Graph 5.25 shows therecruitment of PTT midwives in <strong>2010</strong>.GRAPH 5.25RECRUITMENT OF NON PERMANENT EMPLOYEE (PTT) MIDWIVES IN INDONESIA, <strong>2010</strong>Source: Bureau of Personnel, MoH RI154
More data regarding to the recruitment of non permanent employee (PTT)health personnels throughout all provinces can be seen in Annex 5.28, 5.29 and 5.30.3. Facilities of <strong>Health</strong> Training UnitsFacilities of health training unit are very important components to support thetraining activities. Availability of facilities also determines the performance of healthtraining unit performance. The capacity of dormitories, classrooms, halls and spacefor discussion of health training units of UPT Center, was still varies (not standardyet), especially for health training units of BBPK (Ind=BBPK=Balai Besar PelatihanKesehatan).The largets capacity of dormitories in BBPK Ciloto were 220 beds, the largestcapacity of the class BBPK Jakarta were 260 seats, the largest capacity in BBPK Cilotohall were 400 seats, the largest capacity in discussion rooms in BBPK Ciloto were 50seats. There is no clear distinction of capacity between BBPK and Bapelkes owned byCentral Technical Implementation Unit (Center UPT), and in fact Bapelkes LemahAbang and Bapelkes Salaman had larger capacity than BBPK Makassar.Number of health training units of UPT‐local government were 24 units. Somevariations had seen in the UPT health training units, as many as 21 units (87.5%)have larger or same capacity dormitory with 100 beds and 3 units (12.5%) hadsmaller capacity less than 100 beds.<strong>Health</strong> training units of UPT‐local government with the smallest capacity wasBapelkes Palu. A total of 21 units (87.5%) have been accredited by Pusdiklat of <strong>Health</strong>Human Resources, and 3 units (12.5%) have not been accredited (Bapelkes JanthoAceh Province, BapelkesSouth Kalimantan, and BapelkesMaluku).Facilities of health training units in 2009 were mainly used for Ministry of<strong>Health</strong> activities 69.76% (2,298 events), private sectors 20.86% (687 events), and therest is used by non‐governmental institutions (outside Ministry of <strong>Health</strong>) 9.38%(309 events). From the utilization of these facilities, 68.11% was used for nontrainingactivities and 31.89% used for training activities. While Seat Occupancy Rate(SOR) for training activities was on average 34.40%, 5.86% was non‐trainingactivities, and Bed Occupancy Rate (BOR) 28.60%.Utilization of health training unit/training and education institutions in 2009were 1,052 training activities. Involvement level of training unit on event was 39.8%,used as a place only (level involved I), 26.5% served as a place, coaches, organizers/OC and SC (level IV involved) and by 19.5% as well as a designer of training (level Vinvolved). Distribution of involvement level in education and training institutionsyear 2009 can be seen in Annex 5.35.The whole number of lecturers (Ind=Widyaiswara) in health education andtraining institutions were 172 lecturers. Distribution of health lecturers were variesgreatly according to the institution from 1 up to 14 lecturers. For health educationand training institutions/UPT‐central especially BBPK, number of lecturers were155
anging from 6 to 14 lecturers. While in health education and training institutions ofUPT‐local government, number of lecturers were range from 1 to 11 lecturers with anaverage of 5 lecturers.The largest number of lecturers by age group was at the age group of 51‐60years (86 lecturers), followed by 41‐50 years age group (42 lecturers). Based oneducation, the highest number of lecturers was at post graduate education (112lecturers), while S3 and D‐III were each 2 lecturers. Distribution of lecturers byeducation and training institutions and age groups in 2009 can be seen in Annex 5.36.Number of health human resources trained in health education and traininginstitutions in 2009 were as many as 46,136 personnels. The number of participantswho were trained during the year 2009 based on five categories of training,respectively starting from technical training of health 50.64% (23,361 personnels),management training 17.5% (7,867 personnels), 13.29% service training (6,133personnels), functional training 6.98% (3,222 personnels), and the training hierarchy1.84% (851 personnels). Frequency distribution of training and number ofparticipants by type of training and the province can be seen in Annex 5.37.C. HEALTH BUDGETTINGOne of the necessary resources components in carrying out health developmentis health financing. <strong>Health</strong> financing from government and funding sourced from thecommunity. Here is described the health budget allocated to the Ministry of <strong>Health</strong> andbudget provided for the financing of national community health insurance(Ind=Jamkesmas).1. Budget of Ministry of <strong>Health</strong>Ministry of <strong>Health</strong> in <strong>2010</strong> had allocated a budget of Rp 25,274,803,995,000with a realization of Rp 22,496,458,336,327 (89.01%). Distribution of MoH budgetaccording to the work of echelon‐I unit shows that the largest allocation was ownedby the Directorate General of Medical Services in the amount of Rp13,205,337,162,000 (52.2%), while the lowest allocation was owned by GeneralInspectorate for Rp 76,977,600,000 (0, 3%).The highest realization of budget was reached by Directorate General ofPharmaceutical and Medical Devices with absorption percentage of 95.75%. Thelowest realization of budget was reached by Directorate General of Community<strong>Health</strong> Care with absorption percentage of 82.76%. Within the last 5 years there wasan increasing allocation and realization of the budget from Ministry of <strong>Health</strong>. In theyear 2006 the Ministry of <strong>Health</strong> had a budget allocation of Rp 15.32 trillion withrealization Rp 12.26 trillion (80.05%), this amount increased in <strong>2010</strong> to a budgetallocation of Rp 25.27 trillion with realization Rp 22.50 trillion (89, 01%). Thisincreasing is explained in the Graph 5.22 below. More details information on156
allocation and realization of the budget of the Ministry of <strong>Health</strong> in <strong>2010</strong> can be seenin Annex 5.38.GRAPH 5.26ALLOCATION AND REALIZATION OF MINISTRY OF HEALTH BUDGETTING2006 – <strong>2010</strong>Source : Bureau of Financial and Stateowned Property, MoH RI2. Financing Public <strong>Health</strong> InsuranceAccording to data from Center for Managed Care, Ministry of <strong>Health</strong>, until themonth of June 2011, people who had health insurance were 148,709,645 (63% of totalpopulation). Percentage of population who had health coverage by guaranteeprogram/insurance is presented in Graph 5.27 below. Data on the percentage of peoplewho had health insurance according to the province until the year <strong>2010</strong> can be seen inAnnex 5.39.GRAPH 5.27PERCENTAGE OF POPULATION WHICH WERE COVERED BYCOMMUNITY HEALTH INSURANCE/HEALTH INSURANCE IN INDONESIAUNTIL JUNE 2011Source : Center for Managed Care, MoH RI157
Participants of National Community <strong>Health</strong> Insurance (Ind=Jamkesmas) getcomprehensive health services and gradual from primary health care in healthcenters and referral networks to referral health care in hospitals. In <strong>2010</strong> there were8,967 units of health centers throughout <strong>Indonesia</strong> that serve participants ofJamkesmas. Referral health services were available 1,020 hospitals/clinics consists of564 government‐owned hospitals, 346 private hospitals, 41 hospitals and 69hospitals owned by Army/Police. All participants of Jamkesmas were served by 9,987health providers. Graph 5.27 below shows the percentage of referral health careproviders in <strong>2010</strong>.GRAPH 5.28PROVIDER OF REFERRAL HEALTH CAREFOR NATIONAL COMMUNITY HEALTH INSURANCE<strong>2010</strong>Source : Center for Managed Care, MoH RIIn an effort to improve the affordability of the poor and near‐poor people tohealth services, government through Ministry of <strong>Health</strong> and several localgovernments bear the cost of health services in health centers and 3 rd class‐hospitalsfor participants of National Community <strong>Health</strong> Insurance (Ind=Jamkesmas). Numberof target of the poor (very poor, poor and near‐poor) were carried on by Jamkesmasprogram in 2009 as many as 76.4 million people.***158
ASEAN (Association of Southeast Asian Nations) is a geopolitics and economicsorganization in Southeast Asia, which aims to increase economic growth, socialprogress and cultural development of member states, and promote peace on theregional level. Until today, 10 countries are recorded as members of ASEAN. Thoseten countries are Brunei Darussalam, Philippines, <strong>Indonesia</strong>, Cambodia, Lao People'sDemocratic Republic, Malaysia, Myanmar, Singapore, Thailand and Vietnam.According to WHO classification, <strong>Indonesia</strong> and other 10 countries, namelyBangladesh, Bhutan, DPR Korea (Democratic People's Republic of Korea), India,Maldives, Myanmar, Nepal , Sri Lanka, Thailand and Timor Leste are included in SEARO(South East Asia Region Organization).Comparisons between <strong>Indonesia</strong> and other countries, both in ASEAN andSEARO, are important to identify position of <strong>Indonesia</strong> especially in the neighboringcountries. This chapter studies comparison between <strong>Indonesia</strong> with ASEAN andSEARO countries, in aspects of demographic, health degree and health efforts.A. DEMOGRAPHICDemographic information is important for the development that it could beproperly distributed based on needs of population as the subject of development. Alarge number of people could be either a burden or an investment. Some indicatorsused to identify the condition of population are number of population, populationdensity, population growth rate, dependency ratio and birth rate.1. Population and DensityWorld Populations Data Sheet <strong>2010</strong> identifies that in mid <strong>2010</strong> <strong>Indonesia</strong> wasan ASEAN country with the largest number of population 235.5 million (<strong>2010</strong>Population Census figures by May <strong>2010</strong> <strong>Indonesia</strong> has 237.6 million population). Asthe largest country, <strong>Indonesia</strong> has always been occupying the first position as thecountry with the most population among ASEAN member states, Brunei Darussalamhas the least population with 0.4 million.In ASEAN region, <strong>Indonesia</strong> was the country with the largest number ofpopulation, while in SEARO region <strong>Indonesia</strong> was the second country after India (with1,188.8 million). Bangladesh was the country with the third biggest population. Apartfrom Bangladesh which has population of 164.4 million, the other 8 countries hadpopulation less than 100 million, and 2 countries even had less than 1 million (Bhutanhad 0.7 million and Maldives had 0.3 million). Number of population in ASEAN andSEARO is presented in Graph 6.1.161
GRAPH 6.1POPULATION IN ASEAN & SEARO<strong>2010</strong>Source: Population Reference Bureau, World Population Data Sheet <strong>2010</strong>According to population density, Singapore was the most populous country inASEAN with 7,526 people per square km. It is far above other member states.Meanwhile, the country with the lowest density was Lao PDR with 27 people persquare km.In SEARO, Bangladesh was the most populous country with 1,142 people persquare km. In spite of having the smallest population and small area, Maldives was acountry with the second highest population density in SEARO region, which was1,070 people per square km. On the contrary, Bhutan had the lowest populationdensity, which was 15 people per square km.Population density of <strong>Indonesia</strong> was 124 people per square km. It was the 5 thhighest number in ASEAN and the 8 th in SEARO. Among total 11 member states ofSEARO, <strong>Indonesia</strong> was the 4 th lowest populous country.Population density of ASEAN and SEARO member states in <strong>2010</strong> can be seenon Graph 6.2 below.GRAPH 6.2POPULATION DENSITY IN ASEAN & SEARO (per square km)<strong>2010</strong>162Source: World Population Data Sheet <strong>2010</strong>
2. Population Growth RateIndicator of population growth is very useful in predicting number ofpopulation of a country in the future. The estimated population number could refer tothe basic need of people on any field, including on health. The indicator is usuallycalled as population growth rate. Population growth rate is influenced by 3 factors,namely birth, death and migration. Complete growth rate in ASEAN and SEARO arepresented in Graph 6.3.GRAPH 6.3POPULATION GROWTH RATE PER YEARIN ASEAN & SEARO, 20002009Source: The State of The Worlds Children 2011During 2000‐2009, among ASEAN member states, Brunei Darussalam was thecountry with the highest population growth rate with 2.3%, while Myanmar was thecountry with the lowest population growth rate, 0.8%.In the same period, SEARO member states had population growth rate rangingfrom 0.5% to 3.7%. The highest was Timor Leste and the lowest was Korea DPR.Population growth rate of <strong>Indonesia</strong> was 1.4%. In ASEAN, it was the 3 rd lowestposition (together with Viet Nam), while in SEARO it was the 5 th lowest position.Demographic data of ASEAN and SEARO member states in <strong>2010</strong> are presented inAnnex 6.1.3. Population by Age GroupOne indicator that can roughly indicate the economic situation of a country,whether developed or developing countries, is a dependency ratio. The higherpercentage of dependency ratio indicates the higher burden to be borne by theproductive people to finance life of non productive people (0‐14 year and ≥ 65 year).Percentage of non productive people (0‐14 year and ≥ 65 year) in <strong>2010</strong> showsthat among ASEAN member states, Lao PDR was the country with the highest numberof non productive people, 43%. On the other hand, Singapore was the country withthe fewest number of non productive people, 27%.163
In SEARO region, Timor Leste had the most non productive people with 52%,while Thailand had the fewest non productive people, 29%. This information ispresented on Graph 6.4.GRAPH 6.4COMPOSITION OF PRODUCTIVE AND NON PRODUCTIVE AGEIN ASEAN & SEARO<strong>2010</strong>164Source: Population Reference Bureau, World Population Data Sheet <strong>2010</strong>The population distribution shows that Lao PDR had the most dependencyratio (75%) among ASEAN member states, and Singapore had the lowest dependencyratio 37%.In SEARO, Timor Leste was the country with the highest dependency ratio92%, while Thailand had the lowest with 41%.<strong>Indonesia</strong> had dependency ratio 52%. It means every 100 productive peoplebear the burden to finance 52 non productive people.Population composition by age group and Dependency Ratio in ASEAN andSEARO are in Annex 6.1.4. Human Development IndexHuman Development Index (HDI) is united three dimensions of humandevelopment. Those are healthy and long life (measured by Life Expectancy at Birth),educated (measured by literate ratio and average length of school) and proper lifestandard (measured by real expenditure/income per capita).The international standard classifies Human Development Index (HDI) as:very high (> 0.900); high (0.800–0.899); middle (0.500‐0.799); and low (
highest position. It was on the 27 th of total 169 countries. Myanmar was on thelowest position among ASEAN countries, which was on the 132 nd . In the same period,<strong>Indonesia</strong> was on the 108 th position with HDI 0.600. It increased from 0.593 in theprevious year (2009).GRAPH 6.5HUMAN DEVELOPMENT INDEXIN ASEAN & SEARO, <strong>2010</strong>Source: UNDP, Human Development Report <strong>2010</strong>During <strong>2010</strong>, of total 11 ASEARO member states (Bhutan and Korea DPR arenot available) no country was classified as high and very high. There were sixcountries classified as middle and three countries were low (Bangladesh, Myanmarand Nepal). Further information about HDI in ASEAN and SEARO 2009‐<strong>2010</strong> ispresented in Annex 6.2.5. Total Fertility RateTotal Fertility Rate (TFR) is a description about average number of childrenborn by a woman aged 15‐49 years. Comparative figures of TFR between countriescan indicate the success of countries in implementing social and economicdevelopment. The higher TFR is the average reflection of the young marriage age, loweducation levels, especially women, low socioeconomic level or high poverty rate. Inaddition, it also indicates the level of success of family planning program in thecountry.Total Fertility Rate can be used for program development planning to increasethe average marriage age and health service programs related to maternal and childcare.TFR is classified into 3 levels i.e. low, moderate and high (ADB, Key Indicators2002). A country with TFR ≤ 2.1 is classified as having low fertility, with TFR 2.2‐3.9is classified as having moderate fertility and with TFR ≥ 4 is classified as having highfertility.165
By those key indicators, in <strong>2010</strong>, there were 4 countries included in thecategory of low TFR, namely Singapore (1.2), Brunei Darussalam (1.7), Thailand (1.8),and Viet Nam (2.1). <strong>Indonesia</strong> was categorized as medium with TFR 2.4, which meansthat every woman averagely had 2‐3 children during the fertile period.Among 11 SEARO member states, only Thailand and Korea DPR werecountries with low TFR. Eight countries (<strong>Indonesia</strong>, Myanmar, Bangladesh, Sri Lanka,Maldives, India, Nepal and Bhutan) were moderate, while Timor Leste was the onlycountry with high category was equal to 5.7. ASEAN and SEARO can be seen in Graph6.6 below and Annex 6.2.GRAPH 6.6TOTAL FERTILITY RATE IN ASEAN & SEARO<strong>2010</strong>166Source: Population Reference Bureau, World Population Data Sheet <strong>2010</strong>6. Crude Birth RateCrude Birth Rate (CBR) shows how many births in a year per 1,000 populationin the mid of the same year.In <strong>2010</strong>, Crude Birth Rate in ASEAN member states range from 10 to 28 per1,000 population. The highest CBR occurred in Lao PDR with 28 per 1,000 population,and on the second position was Philippines with 26 per 1,000 population. Singaporehad the lowest CBR with 10 births per 1,000 population. Meanwhile, <strong>Indonesia</strong> hadCBR 20 births for every 1,000 population.In SEARO, the CBR ranged from 15 to 41 per 1,000 population. Two countrieswith the highest CBR were Timor Leste (41) and Nepal (28), while two countries withthe lowest were Thailand and Korea DPR (each 15).
By CBR 20 births per 1,000 population, in ASEAN <strong>Indonesia</strong> was on the 5 thhighest position, while in SEARO <strong>Indonesia</strong> was on the 7 th highest position.Graph 6.7 shows the comparison of CBR in ASEAN and SEARO. Furtherinformation on CBR in ASEAN and SEARO in <strong>2010</strong> can be found in Annex 6.2.GRAPH 6.7CRUDE BIRTH RATE IN ASEAN & SEARO<strong>2010</strong>Source: Population Reference Bureau, World Population Data Sheet <strong>2010</strong>7. Socio EconomicNational income is one indicator to measure a country’s economic growth.Gross National Income per capita consists of a number of values of good and serviceproduced within a country, including the income received from other countries.The highest Gross National Income per capita in <strong>2010</strong> among ASEAN memberstates was Brunei Darussalam (US$ 50,200 per capita), followed on the secondposition by Singapore (US$ 47,940 per capita). Myanmar and Cambodia werecountries with the lowest Gross National Income per capita, each US$ 1,290 and US$1,820.All 10 countries in SEARO (Korea DPR was not available) had Gross NationalIncome per capita less than $ 6,000. The country with the highest GNI per capita wasThailand with US$ 5,990, and the lowest was Nepal with US$ 1,120. Comparing to 17countries in ASEAN and SEARO, <strong>Indonesia</strong> ranked 6 th tertinggi pendapatan nasionalbruto per kapita.Meanwhile, <strong>Indonesia</strong> had GNI per capita US$ 3,830. Gross National Income inASEAN and SEARO in <strong>2010</strong> can be seen in Graph 6.8.167
GRAPH 6.8GROSS NATIONAL INCOME (GNI) IN ASEAN & SEARO<strong>2010</strong>Source: Population Reference Bureau, World Population Data Sheet <strong>2010</strong>B. HEALTH STATUSMORTALITY1. Infant Mortality RateInfant mortality rate is classified into 4: low (≤ 20 per 1000 live births); middle(20‐49 per 1000 live births); high (50‐99); and very high (≥ 100 per 1000 live births).Graph 6.9 shows that in 2009, 5 ASEAN member states (Singapore, BruneiDarussalam, Malaysia, Thailand and Viet Nam) were included in low category, 3member states (Philippines, <strong>Indonesia</strong> and Lao PDR) were included in middlecategory, and other 2 member states (Cambodia and Myanmar) were included in highcategory. Of total 10 ASEAN member states, there was no member state categorizedas very high (IMR ≥100 per 1000 live births).Subject to the classification, 3 SEARO member states, Maldives, Thailand andSri Lanka, were categorized as low with infant mortality rate (IMR) 11, 12 and 13 per1000 live births, 5 member states were categorized as middle, and 3 member stateswere categorized as high (Myanmar, Bhutan and India).Infant Mortality Rate (IMR) in ASEAN and SEARO in 2009 ranges from 2 and68 per 1000 live births. IMR in <strong>Indonesia</strong> was 30 per 1000 live births, and it was onthe 10 position of total 18 countries. IMR in ASEAN and SEARO in 2009 can be seen inAnnex 6.2.168
GRAPH 6.9INFANT MORTAALITY RATE IN ASEAN & SEARO2009Source: WHO, World <strong>Health</strong> Statistics 20112. Underfive Mortality RateReduction of infant mortality rate is one thing considered important inMillennium Development Goals. In high case situation, the most number of deathsusually occurs on underfive age when children are susceptible to diseases. Statisticsindicates that more than 70% underfive mortality is caused by diarrhea, pneumonia,measles, malaria and malnutrition.GRAPH 6.10UNDERFIVE MORTALITY RATE (PER 1000 LIVE BIRTHS)IN ASEAN & SEARO, 2009Source: WHO, World <strong>Health</strong> Statistics 2011169
Data in “World <strong>Health</strong> Statistics 2011” shows a wide gap of underfive mortalityrate among ASEAN member states in 2009. The country with lowest rate wasSingapore with 3 per 1000 live births, and the highest was Cambodia with 88 per1000 live births. ASEAN member states mostly have Underfive Mortality Rate lessthan 50 per 1000 live births, and only Cambodia, Myanmar and Lao PDR had morethan 50 per 1000 live births.Due to the same data source, underfive mortality rate in SEARO ranged from13 to 79 per 1000 live births. Buthan was the country with the highest underfivemortality rate, while Thailand was the country with the lowest. If ASEAN only had 3countries (from total 10 countries) with underfive mortality rate more than 50 per1000 live births, SEARO had 5 countries with underfive mortality rate more than 50.Graph 6.10 shows that ASEAN member states relatively had underfivemortality rate lower (except Cambodia) than SEARO member states. It has beendescribed previously that the majority of underfive mortality is caused by diarrhea,pneumonia and malnutrition. It means ASEAN member states might have sanitationand economy better than SEARO member states.In 2009, <strong>Indonesia</strong> had 39 underfive deaths per 1000 live births (according toSDKI 2007, Underfive Mortality Rate in <strong>Indonesia</strong> was 44). Among ASEAN memberstates, <strong>Indonesia</strong> was ranked the 4 th highest Underfive Mortality Rate, while amongSEARO member states, <strong>Indonesia</strong> was ranked the 5 th lowest. Underfive Mortality Ratein ASEAN and SEARO in 2009 can be seen in Annex 6.2.3. Maternal Mortality RateBased on WHO classification, Maternal Mortality Rate (MMR) is divided asfollows:
In 2008, among ASEAN member states, only Singapore had Maternal MortalityRate 500,which was 580 per 100,000 live births.In the same year, there was no SEARO member states had Maternal MortalityRate 500 live births. Three countries had MMR 15‐199 per100,000 live births, and 8 countries had MMR 200‐499 per 100,000 live births.Among ASEAN and SEARO member states, <strong>Indonesia</strong> was ranked 11 th (of total18 member states) with MMR 240 per 100,000 live births. Maternal Mortality Rate inASEAN and SEARO in 2008 can be seen in Annex 6.2.Meanwhile, according to SDKI 2007, national MMR of <strong>Indonesia</strong> was 228 per100,000 live births.4. Crude Death RateCrude Death Rate (CDR) is a number that indicates how much deaths occurring ina year for every 1,000 population. In general, older people have a higher risk of deathcomparing to younger people. Since there is no other indicator of death, it can be used togive an idea about the state of population welfare in a current year.GRAPH 6.12CRUDE DEATH RATE (PER 1000 POPULATION)IN ASEAN & SEARO, <strong>2010</strong>Source: Population Reference Bureau, World Population Data Sheet <strong>2010</strong>Among ASEAN member states, in <strong>2010</strong> Myanmar was the country with thehighest CDR, which was 11 per 1000 population. Situation of CDR in SEARO was notmuch different with in ASEAN. Myanmar was the country with the highest CDR, whileMaldives was the country with the lowest CDR, 3 per 1000 population.In <strong>2010</strong>, there were 6 deaths per 1000 population in <strong>Indonesia</strong>. In ASEAN,<strong>Indonesia</strong> was the country with the 5th highest CDR, on the contrary, in SEARO171
<strong>Indonesia</strong> was on the 2 nd lowest position. Crude Death Rate <strong>2010</strong> in ASEAN andSEARO can be found in Annex 6.2.5. Life Expectancy at Birth (e0)Life expectancy at birth (e0) is an indicator to evaluate the performance ofgovernment in improving the population welfare generally and health careparticularly.Graph 6.13 shows that in <strong>2010</strong>, among 10 ASEAN member states, Singaporewas the country with the highest life expectancy at birth, which was 81 years.Myanmar was the country with the lowest life expectancy at birth, 58 years.GRAPH 6.13LIFE EXPECTANCY AT BIRTH (e0) IN ASEAN & SEARO<strong>2010</strong>172Source: Population Reference Bureau, World Population Data Sheet <strong>2010</strong>In SEARO, Sri Lanka had the highest life expectancy at birth of 74 years. As in ASEAN,in SEARO Myanmar was the country with the lowest life expectancy at birth, 58 years.With life expectancy at birth 71 years, in ASEAN, <strong>Indonesia</strong> was on the 6 thhighest position, and in SEARO <strong>Indonesia</strong> was on the 3 rd highest position. Lifeexpectancy at birth in ASEAN and SEARO in <strong>2010</strong> is in Annex 6.2.MORBIDITY1. Prevalence of Tuberculosis (TB)“World <strong>Health</strong> Statistics 2011” shows large difference in the prevalence oftuberculosis per 100,000 population and mortality associated with tuberculosis per100,000 population in ASEAN and SEARO. The prevalence of tuberculosis 2009among ASEAN member states ranged from 43 to 693 per 100,000 population.Cambodia was the country with the highest prevalence of tuberculosis in ASEAN, 693
per 100,000 population, while Singapore had the lowest prevalence of tuberculosis,which was 43 cases per 100,000 population.The highest death related to tuberculosis in 2009 was in Cambodia with 71 per100,000 population. Meanwhile, the lowest death related to tuberculosis occurred inBrunei Darussalam and Singapore with each 1.7 and 2.3 deaths per 100,000population.GRAPH 6.14PREVALENCE OF AND DEATH RELATED TO TUBERCULOSIS PER 100,000 POPULATIONIN ASEAN & SEARO, 2009Source: WHO, World <strong>Health</strong> Statistics 2011The same situation happened also in SEARO. Prevalence of tuberculosis 2009among SEARO member states had a quite large gap, ranging from 47 to 744 per100,000 population. The country with the highest TB prevalence was Timor Leste(744 per 100,000 population) and the country with the lowest was Maldives (47 per100,000 population).Deaths by tuberculosis in SEARO ranged from 2.6 to 66 per 100,000population. The highest number of TB deaths also occurred in Timor Leste with 66deaths per 100,000 population, and the lowest number occurred in Maladives with2.6 per 100,000 population.Among total 18 countries of ASEAN and SEARO, <strong>Indonesia</strong> was on the 8 thhighest position with TB prevalence 285 per 100,000 population. It can be seen inAnnex 6.4.2. Avian InfluenzaThe emergence of new strains of influenza virus in humans (H5N1 strain) was firstdetected in Hong Kong. As a result, 18 people got inpatient care, and 6 of them died. It wasthe first fact that avian influenza viruses can be transmitted directly from birds to humans.Before 1997, scientists believe the transmission of influenza virus from birds to humansdid not occur directly.173
Avian Influenza firstly entered ASEAN region in 2003, and Viet Nam was thefirst country infected with 3 people diagnosed being infected and died. By the end of<strong>2010</strong>, 6 countries had been infected by Avian Influenza, those are Viet Nam, Thailand,<strong>Indonesia</strong>, Lao PDR, Myanmar and Cambodia.In SEARO, the infected countries were the same as infected countries inASEAN. Those are <strong>Indonesia</strong>, Myanmar and Thailand.GRAPH 6.15AVIAN INFLUENZA CASE AND FATALITYIN ASEAN & SEARO, 2003<strong>2010</strong>Source: http://www.who.int/csr/disease/avian_influenza/country/cases_table_2011_05_13/en/index.html, data13 May 2011, accessed on 20 June 2011Graph 6.15 shows the number of cases and deaths caused by Avian Influenzain ASEAN since 2003 to <strong>2010</strong>. The first case infected 3 people in Viet Nam, and all ofthem ended in death. In 2004, it increased to 46 cases with 32 deaths. In addition toViet Nam, H5n! had also infected Thailand. By the end of 2005, number of cases andinfected countries continued to grow, and about 90 people positively infected.However, the number of death could be reduced. If previously almost 100% casesended in death, in 2005, of 90 infected cases 38 ended in death (42.22%). Since thattime, number of Avian Influenza cases continued to decline. On the contrary, casefatality rate (CFR) was still high. In 2009, there were 3 countries in ASEAN infectedwith 27 cases and 24 death (CFR = 88.89%). In <strong>2010</strong>, CFR decreased to 58.82% (17cases with 10 deaths).Tabel 6.1 shows that over the last 3 years, Avian Influenza virus spread to 3countries in ASEAN, Cambodia, Viet Nam and <strong>Indonesia</strong>. The 3 countries that wereinfected previously (Laos, Myanmar dan Thailand) have not shown the case detectionyet.174
TABEL 6.1AVIAN INFLUENZA CASE AND FATALITYBY COUNTRY, 2003<strong>2010</strong>COUNTRIES2003 2004 2005 2006 2007 2008 2009 <strong>2010</strong> TotalC D C D C D C D C D C D C D C D C DCambodia 0 0 0 0 4 4 2 2 1 1 1 0 1 0 1 1 10 8Lao PDR 0 0 0 0 0 0 0 0 2 2 0 0 0 0 0 0 2 2Viet Nam 3 3 29 20 61 19 0 0 8 5 6 5 5 5 7 2 119 54<strong>Indonesia</strong> 0 0 0 0 20 13 55 45 42 37 24 20 21 19 9 7 171 122Myanmar 0 0 0 0 0 0 0 0 1 0 0 0 0 0 0 0 1 0Thailand 0 0 17 12 5 2 3 3 0 0 0 0 0 0 0 0 25 17Bangladesh 0 0 0 0 0 0 0 0 0 0 1 0 0 0 0 0 1 0ASEAN 3 3 46 32 90 38 60 50 54 45 31 25 27 24 17 10 328 203SEARO 0 0 17 12 25 15 58 48 43 37 25 20 21 19 9 7 198 139Source: http://www.who.int/csr/disease/avian_influenza/country/cases_table_2011_05_13/en/index.html,updated 13 May 2011, accessed 20 June 2011Remarks: C = Case D = DeathAvian Influenza began to attack humans in SEARO in 2004, which was Thailand.Since 2004, SEARO member states infected by Avian Influenza are also the countries ofASEAN. These countries are Thailand and <strong>Indonesia</strong>.3. POLIOSome diseases can potentially cause outbreaks. Some diseases can beprevented by immunization, or usually called as PD3I (vaccine preventable diseases).These are Tuberculosis, Hepatitis B, Diphtheria, Pertussis, Tetanus, TetanusNeonatorum, Measles and Polio.TABEL 6.2POLIO CASE PER COUNTRY20042008COUNTRIES 2004 2005 2006 2007 2008Cambodia 0 1 1 0 0Lao PDR 1 0 0 0 0<strong>Indonesia</strong> 0 349 2 0 0Myanmar 0 0 1 15 0Bangladesh 0 0 18 0 0India 134 66 676 873 559Nepal 0 4 5 5 6ASEAN 1 350 4 15 0SEARO 134 419 702 893 565Source: WHO vaccine‐preventable disease monitoring system, 2009 global summarySince 2001, polio cases had not been found in ASEAN countries. However, in2004 it returned and attacked residents in ASEAN region. There was 1 case found inLaos. In 2005 the number of polio cases reached its peak. About 350 cases werereported from 2 countries in ASEAN, Cambodia and <strong>Indonesia</strong>, and 349 occurred in<strong>Indonesia</strong>. Transmission of polio could be controlled in 2006. Only 4 patients werefound in this region, 2 patients originated from <strong>Indonesia</strong> and one patient each fromCambodia and Myanmar. In 2007, among ASEAN member states, polio cases was onlyfound in Myanmar and kept increasing from 1 to 15 cases, compared to previous year.175
<strong>Indonesia</strong>, which in 2005 got the outbreak of 349 polio cases, could control theincident that since 2007 polio case had not been found in <strong>Indonesia</strong>.Though in 2008 polio was not found in ASEAN, there were 565 polio cases inSEARO, specifically in India and Nepal. From previous year, India had decreasingcases 36%, while Nepal had increasing 20%.GRAPH 6.16POLIO CASES IN ASEAN & SEARO20042008Source: WHO vaccine‐preventable disease monitoring system, 2009 global summaryComparing to ASEAN member states, polio cases were high cumulatively inSEARO since 2002 and years before. During 2004‐2006, it slowly began to increase.This increasing number was due to a big contribution from India, as one of 4 Polioendemic countries. Although in 2008 India had successfully controlled number ofPolio cases, about 99% cases in SEARO occurred in India.4. Tetanus NeonatorumTetanus cases are mostly found in tropical countries and countries that stillhave low environmental health conditions. WHO data figures that deaths related totetanus in developing countries is 135 times higher than developed countries.Tetanus is one of infectious and fatal diseases.Tetanus in infants is also known as Tetanus Neonatorum because it generallyoccurs in newborns or under one month of age. The cause is Clostridium Tetani sporethat enter body through injuries on umbilical cord caused by unhygienic treatment.During <strong>2010</strong>, Tetanus Neonatorum occurred in 7 ASEAN countries, with thehighest number cases in <strong>Indonesia</strong>, over 100 cases. Singapore and Brunei Darussalamdid not report any Tetanus Neonatorum cases.Vaccine‐Preventable Disease Monitoring System 2011 records that during<strong>2010</strong> there were 373 tetanus neonatorum cases in India (SEARO member state) and itwas far above other ASEAN member states. <strong>Indonesia</strong> and Bangladesh were on the176
2 nd and 3 rd position with 137 and 117 cases. Other 3 countries, Bhutan, Korea DPRand Maldives did not report any tetanus neonatorum cases.Number of infectious diseases that can be prevented by immunization inASEAN and SEARO in <strong>2010</strong> can be seen completely in Annex 6.6.C. HEALTH EFFORTS1. Coverage of ImmunizationImmunization is one effort to prevent death in infants by giving vaccine. Someimmunizations are required to be given to infants, i.e. polio, BCG and measles. BCG isusually used as a reflection of the proportion of infants protected from severetuberculosis during the first year of their lives. It is also an indicator of access tohealth service.In addition to BCG, Polio is another vaccine that should be given to infants. It isan immunization to prevent Polio disease. If BCG and Measles need 1 dosage ofvaccine, Polio needs 3 dosages. Therefore, Polio3, or a condition when infants havebeen immunized against Polio for 3 times (3 dosages), is used to measure the successof health effort.From some vaccine preventable diseases in infant, measles is the main causeof death. Therefore, measles prevention is an important factor in reducing UnderfiveMortality Rate. One of 22 specific goals agreed in World Summit of Children Dari 22 ismaintaining measles immunization coverage of 90%. In all ASEAN and SEAROmember states, measles immunization is given to infants aged 9‐12 months. It is thelast immunization series of other mandatory immunization (BCG, DPT, Polio,Hepatitis and Measles). Thus, when infants get measles vaccination, they are assumedhaving got complete immunization series. The coverage of measles vaccinationdescribes the coverage of infants getting complete immunization series.Comparing to other immunization in Graph 6.17, coverage of BCG vaccinationto infants is usually higher. It is because the schedule of BCG vaccination is relativelyearlier that the other. Some countries even give BCG injection a moment after thebaby is born that the baby is still in monitoring of heath personnel. In 2009, thehighest BCG coverage among ASEAN member states was attained by BruneiDarussalam, Singapore and Thailand with 99%, while the lowest was attained by LaoPDR with 67%.In SEARO, 8 of 11 member states achieved BCG vaccination coverage of 90%.Those 8 countries were <strong>Indonesia</strong>, Myanmar, Thailand, Bangladesh, Bhutan, KoreaDPR, Maldives and Sri Lanka. While, the lowest coverage was in Timor Leste with71%.177
GRAPH 6.17COVERAGE OF VACCINATIONIN ASEAN & SEARO, 2009Source: WHO Immunization Summary 2011: A Statistical Reference Containing Data through 2009During During 2008, 7 of 10 ASEAN member states had successfully achievedtarget of Polio3 immunization of 90%. The highest coverage was by BruneiDarussalam and Thailand with 99% and the lowest was Lao PDR with 60%.According to the same source, 7 of 11 SEARO member states got coverage of Polio3immunization 90%. The highest coverage was Thailand with 99% and the lowest wasIndia with 67%.In the same year, 6 ASEAN countries had met target of measles immunization90%. Those were Brunei Darussalam, Cambodia, Malaysia, Singapore, Viet Nam andThailand. Brunei Darussalam was the country with the highest coverage 99%. On theother hand, Lao PDR got the lowest coverage of 59%. Meanwhile, coverage of<strong>Indonesia</strong> in 2009 was 82%.In SEARO region, 5 of 11 countries achieved measles immunization coverage 90%.Those were Thailand, Bhutan, Korea DPR, Maldives and Sri Lanka. The country withthe lowest coverage was Timor Leste with 70%.In almost all ASEAN and SEARO countries, Hepatitis is one of basicimmunization given to infants, except in India. In India, Hepatitis is not a basicimmunization. Therefore, in Annex 6.7, India is the only country with low percentageof infants getting hepatitis3, which was 21%. In other countries, the coverage ofHepatitis3 reached more than 60%, in some countries it even exceeded 90%.<strong>Indonesia</strong> had covered 93% infants getting BCG immunization, 89% infantsgetting polio3 immunization and 82% infants getting measles immunization.Coverage of 5 basic immunizations in ASEAN and SEARO member states is completelypresented in Annex 6.7.178
2. Lung TB ControlWHO has set target of TB case detection through 70% DOTS strategy and 85%Success Rate. In fact, TB case detection globally was 60% and success rate was 84%. Itmeans the achievement of those 2 indicators had not met the target, though thesuccess rate had almost reached it.According to World <strong>Health</strong> Statistics 2011, in 2009, 3 ASEAN countries hadmet WHO target of TB case detection, 70%. Those were Brunei Darussalam (89%),Singapore (89%) and Malaysia (76%). Other 7 countries had not met the target yetbecause the coverage were only ranging from 54% ‐ 69%.GRAPH 6.18TB CASE DETECTION IN ASEAN & SEARO, 2009GRAPH 6.19TB SUCCESS RATE IN ASEAN & SEARO, 2008Source: WHO, World <strong>Health</strong> Statistic 2011 Source: WHO, World <strong>Health</strong> Statistic 2011From total 11 SEARO member states, only 6 countries had met WHO target ofTB case detection. Bhutan had covered the highest with 100%, while Bangladesh hadthe lowest with 44%.Graph 6.19 shows that in 2008 there were 8 ASEAN countries met WHO targetof TB success rate (85%), while three countries, Malaysia, Singapura and Thailandhad not met the WHO target yet. <strong>Indonesia</strong> was one of the countries, which had metthe target, with Success Rate 91%. The highest Success rate was attained byCambodia with 95%, and the lowest was Malaysia with 78%.There were 9 SEARO member states met Success Rate target. The highest were<strong>Indonesia</strong>, Bangladesh and Buthan with each 91%, while the lowest was Maldiveswith 45%.Meanwhile, both Graph 6.18 and Graph 6.19 indicate the success of <strong>Indonesia</strong>in meeting WHO target of success rate indicator, but <strong>Indonesia</strong> had not successfullymet the target of case detection rate indicator. Among SEARO member states,<strong>Indonesia</strong> had even attained the highest rate, in addition to Bangladesh and Bhutan.179
3. Improved DrinkingWater Source and SanitationDuring 2008, from 9 ASEAN member states (Brunei Darussalam not available),there were 6 countries with improved drinking‐water source more than 80%, whileCambodia, Lao PDR and Myanmar only had less than 80%. The highest percentagewas by Malaysia and Singapore with 100% and the lowest was Lao PDR with 57%.In the same year, among SEARO member states, almost all countries have hadmore than 80% population using improved drinking‐water source, except TimorLeste with only 69%. Meanwhile, the highest percentage was Korea DPR with 100%population.Graph 6.20 shows that among all ASEAN and SEARO member states, there wasa large gap between the lowest and the highest percentage of population usingimproved sanitation, ranging from 29% to 100%. The country with the lowestcoverage was Cambodia with 29%, and the highest was Singapore with 100%.GRAPH 6.20PERCENTAGE OF POPULATION USING IMPROVED DRINKINGWATER SOURCEAND SANITATION IN ASEAN & SEARO, 2008180Source: UNDP, States of the Worlds Children 2011Comparing to population using improved drinking‐water source, percentage ofpopulation using improved sanitation was relatively low. There were 10 countrieswith less than 80% population using improved sanitation. Percentage of populationusing improved drinking‐water source and sanitation in ASEAN and SEARO in 2008can be seen in Annex 6.3.4. Maternal <strong>Health</strong> CareIn period 2000‐<strong>2010</strong>, from 6 reporting ASEAN member states (Brunei, LaoPDR, Malaysia and Singapore not available), <strong>Indonesia</strong> was the country with thehighest maternal care (4 th visit or K4) 82%, and Cambodia was recorded as the lowestwith 27%. In SEARO, two countries with the highest coverage of maternal care (K4)were Korea DPR with 95% and Sri Lanka with 93%, while the lowest was inBangladesh with 21 %.
Coverage of delivery assisted by skilled health assistant was various. Threecountries with the highest coverage were Singapore, Brunei Darussalam and Malaysiawith 100%, while the country with the lowest coverage was Lao PDR with 20%.<strong>Indonesia</strong> with 73% was on the 6 th position of 10 ASEAN member states. In SEAROregion, the highest was Thailand and Sri Lanka with 99%, and the lowest wasBangladesh with 18%.Among 8 ASEAN member states (Brunei Darussalam and Malaysia notavailable), the highest percentage of active family planning participant of womanaged 15‐49 years was attained by Thailand with 70%, and the lowest was byCambodia with 27%. <strong>Indonesia</strong> with coverage of 57% was on the 3 rd position. beradapada peringkat ke‐3 dari 10 negara ASEAN. Meanwhile, in SEARO, the highestpercentage was achieved by Thailand (70%), and the lowest was by Timor Leste with21%.***181
BPS Statistics <strong>Indonesia</strong>. 2006. Estimasi Parameter Demografi SUPAS 2005. BPS, Jakarta.___________. 2006. Statistik Kesejahteraan Rakyat 2005. BPS, Jakarta.___________. 2007. Statistik Kesejahteraan Rakyat 2006. BPS, Jakarta.___________. 2008. Statistik Kesejahteraan Rakyat 2007. BPS, Jakarta.___________. 2009. Statistik Kesejahteraan Rakyat 2008. BPS, Jakarta.___________. 2005. Beberapa Indikator Penting Sosial-Ekonomi <strong>Indonesia</strong> 2005. BPS,Jakarta.___________. 2007. Beberapa Indikator Penting mengenai <strong>Indonesia</strong>. BPS, Jakarta.___________. <strong>2010</strong>. Perkembangan Beberapa Indikator Utama Sosial-Ekonomi <strong>Indonesia</strong>.BPS, Jakarta.___________. <strong>2010</strong>. Analisis Dan Penghitungan Tingkat Kemiskinan <strong>2010</strong>. BPS, Jakarta.___________. 2004. Statistik <strong>Indonesia</strong> 2003. BPS, Jakarta.___________. 2005. Statistik <strong>Indonesia</strong> 2004. BPS, Jakarta.___________. 2006. Statistik <strong>Indonesia</strong> 2005/2006. BPS, Jakarta.___________. 2007. Statistik <strong>Indonesia</strong> 2007. BPS, Jakarta.___________. 2004. Statistik Kesehatan 2004. BPS, Jakarta.___________. 2008.. Pedoman Millenium Development Goals. BPS, Jakarta.___________. 2008.. Press Release BPS 2008: Jumlah Kemiskinan. www.bps.go.id, Jakarta.___________. <strong>2010</strong>.. Berita Resmi Statistik, BPS, No. 45/07/Th. XIII, 1 Juli <strong>2010</strong>.___________. <strong>2010</strong>.. Data Strategis BPS, BPS, Jakarta.___________. <strong>2010</strong>.. Hasil Sensus Penduduk <strong>2010</strong>, Data Agregat Per Provinsi, BPS, Jakarta.
BPS Statistics <strong>Indonesia</strong> and Macro International, 1998. Survei Demografi dan Kesehatan<strong>Indonesia</strong> (SDKI) 1997. Calverton, Maryland, USA.___________. 2003. Survei Demografi dan Kesehatan <strong>Indonesia</strong> (SDKI) 2002-2003.Calverton, Maryland, USA.___________. 2008. Survei Demografi dan Kesehatan <strong>Indonesia</strong> (SDKI) 2007. Macro.Calverton, Maryland, USA.BPS Statistics <strong>Indonesia</strong>, BAPPENAS, UNFPA. 2005. Proyeksi Penduduk <strong>Indonesia</strong>(<strong>Indonesia</strong> Population Projection 2000 - 2025). BPS, Jakarta.Ministry of Home Affairs. <strong>2010</strong>. Kode dan Data Wilayah Administrasi Pemerintahan <strong>2010</strong>.Depdagri, Jakarta. www.depdagri.goidMinistry of <strong>Health</strong>. 2009. Profil Kesehatan <strong>Indonesia</strong> 2008, Departemen Kesehatan RI,Jakarta.___________. <strong>2010</strong>. Laporan Hasil Riset Kesehatan Dasar, RISKESDAS <strong>Indonesia</strong> Tahun<strong>2010</strong>. Kemenkes, Jakarta.___________. 2008. Laporan Hasil Riset Kesehatan Dasar, RISKESDAS <strong>Indonesia</strong> Tahun2007. Depkes, Jakarta.___________. 2008. Pedoman Pelaksanaan Jaminan Kesehatan Masyarakat (Jamkesmas)2008. Depkes, Jakarta.___________. 2008. Profil Pengendalian Penyakit Dan Penyehatan Lingkungan 2007.Depkes, Jakarta.___________.2008. Pemantauan Wilayah Setempat (PWS) KIA, Departemen Kesehatan RI,Jakarta.___________. 2006. Profil Pengembangan Dan Pemberdayaan Sumberdaya ManusiaKesehatan 2005. Depkes, Jakarta.___________. 2006. Statistik Rumah Sakit Di <strong>Indonesia</strong> Seri 1: Kegiatan Pelayanan.Depkes, Jakarta.___________. 2006. Statistik Rumah Sakit Di <strong>Indonesia</strong> Seri 2: Ketenagaan. Depkes, Jakarta.___________. 2006.Statistik Rumah Sakit Di <strong>Indonesia</strong> Seri 3:Morbiditas/Mortalitas.Depkes, Jakarta.___________. 2006. Profil Pendidikan Tenaga Kesehatan Tahun 2006. Pusdiknakes, DepkesRI, Jakarta.
___________. 2005. Publikasi Hasil Analisis Data Survei Kesehatan Nasional 2004. BadanLitbangkes, Depkes RI, Jakarta.___________.2005. Pencegahan dan Pemberantasan DBD di <strong>Indonesia</strong>, Dirjen PPPLDepartemen Kesehatan RI, Jakarta.___________.2000. <strong>Indonesia</strong> Sehat <strong>2010</strong>, Departemen Kesehatan RI, Jakarta.___________.1996. Publikasi Hasil Survei Kesehatan Rumah Tangga 1995. BadanLitbangkes, Jakarta.Ministry of Underdeveloped Areas Development of RI, <strong>2010</strong>. Strategi Nasional PercepatanPembangunan Daerah Tertinggal 2004-2009. Jakarta.USAID, 2008. The World Population Data Sheet. Population Reference Bureau.The United Nations Development Programme. 2008. Human Development Report2007/2008. UNDP, New York.UNAIDS. <strong>2010</strong>. 2008 Report on The Global AIDS Epidemic. UNAIDS/WHO.UNICEF. 2008. The State of the World’s Children 2008. UNICEF/WHO, New York.___________. 2009. The State of the World’s Children 2009. UNICEF/WHO, New York.___________. 2008. Incidence Series Immunization 2007. UNICEF/WHO, New York.___________. 2008. Immunization Summary: The 2007 Edition. UNICEF/WHO, New York.WHO. 2008. World <strong>Health</strong> Statistics 2007. WHO Press, Geneva.___________. World <strong>Health</strong> Statistics 2008. WHO Press, Geneva.___________. 2008. WHO Vaccine – Preventable Diseases, Monitoring System. WHO, NewYork.___________. <strong>2010</strong>. Cumulative Number of Confirmed Human Cases of Avian InfluenzaA/(H5N1) Repoerted to WHO 13 May 2011(http://www.who.int/csr/disease/avian_influenza/country/cases_table_2011_05_13/en/index.html accessed on 20 June 2011)***
Annex 2.1DISTRIBUTION OF GOVERNMENT ADMINISTRATION BY PROVINCE, <strong>2010</strong>NoProvincesDistibution of Government AdministrationDistricts Municipalities Districts+Municipalities SubdistrictsVillages(1) (2) (3) (4) (5) (6)(7)1 Aceh 18 5 23 275 6,4202 North Sumatera 25 8 33 410 5,6563 West Sumatera 12 7 19 169 9684 Riau 10 2 12 154 1,5685 Jambi 9 2 11 128 1,3216 South Sumatera 11 4 15 217 2,8957 Bengkulu 9 1 10 116 1,4448 Lampung 12 2 14 206 2,3589 Bangka Belitung Islands 6 1 7 44 36110 Riau Islands 5 2 7 59 34211 DKI Jakarta 1 5 6 44 26712 West Java 17 9 26 625 5,83613 Central Java 29 6 35 573 8,57614 DI Yogyakarta 4 1 5 78 43815 East Java 29 9 38 662 8,49916 Banten 4 4 8 154 1,53517 Bali 8 1 9 57 69918 West Nusa Tenggara 8 2 10 116 91319 East Nusa Tenggara 20 1 21 288 2,82320 West Kalimantan 12 2 14 175 1,77821 Central Kalimantan 13 1 14 125 1,44522 South Kalimantan 11 2 13 151 1,97523 East Kalimantan 10 4 14 136 1,43924 North Sulawesi 11 4 15 156 1,54225 Central Sulawesi 10 1 11 148 1,73226 South Sulawesi 21 3 24 302 2,87427 Southeast Sulawesi 10 2 12 201 1,84328 Gorontalo 5 1 6 65 59529 West Sulawesi 5 0 5 69 56930 Maluku 9 2 11 76 89831 North Maluku 7 2 9 111 1,05432 West Papua 10 1 11 160 1,35433 Papua 28 1 29 348 3,621<strong>Indonesia</strong>399 98 497 6,598 75,638Source : Ministry of Home Affairs Republic of <strong>Indonesia</strong>, <strong>2010</strong>
Annex 2.2TOTAL POPULATION BY SEX AND SEX RATIOBY PROVINCE, <strong>2010</strong>No Provinces Males Females Males and Females Sex Ratio(1) (2) (3) (4) (5) (6)1 Aceh 2,248,952 2,245,458 4,494,410 1002 North Sumatera 6,483,354 6,498,850 12,982,204 1003 West Sumatera 2,404,377 2,442,532 4,846,909 984 Riau 2,853,168 2,685,199 5,538,367 1065 Jambi 1,581,110 1,511,155 3,092,265 1056 South Sumatera 3,792,647 3,657,747 7,450,394 1047 Bengkulu 877,159 838,359 1,715,518 1058 Lampung 3,916,622 3,691,783 7,608,405 1069 Bangka Belitung Islands 635,094 588,202 1,223,296 10810 Riau Islands 862,144 817,019 1,679,163 10611 DKI Jakarta 4,870,938 4,736,849 9,607,787 10312 West Java 21,907,040 21,146,692 43,053,732 10413 Central Java 16,091,112 16,291,545 32,382,657 9914 DI Yogyakarta 1,708,910 1,748,581 3,457,491 9815 East Java 18,503,516 18,973,241 37,476,757 9816 Banten 5,439,148 5,193,018 10,632,166 10517 Bali 1,961,348 1,929,409 3,890,757 10218 West Nusa Tenggara 2,183,646 2,316,566 4,500,212 9419 East Nusa Tenggara 2,326,487 2,357,340 4,683,827 9920 West Kalimantan 2,246,903 2,149,080 4,395,983 10521 Central Kalimantan 1,153,743 1,058,346 2,212,089 10922 South Kalimantan 1,836,210 1,790,406 3,626,616 10323 East Kalimantan 1,871,690 1,681,453 3,553,143 11124 North Sulawesi 1,159,903 1,110,693 2,270,596 10425 Central Sulawesi 1,350,844 1,284,165 2,635,009 10526 South Sulawesi 3,924,431 4,110,345 8,034,776 9527 Southeast Sulawesi 1,121,826 1,110,760 2,232,586 10128 Gorontalo 521,914 518,250 1,040,164 10129 West Sulawesi 581,526 577,125 1,158,651 10130 Maluku 775,477 758,029 1,533,506 10231 North Maluku 531,393 506,694 1,038,087 10532 West Papua 402,398 358,024 760,422 11233 Papua 1,505,883 1,327,498 2,833,381 113<strong>Indonesia</strong>119,630,913 118,010,413 237,641,326 101Source: BPS-Statistics <strong>Indonesia</strong>, Population Census <strong>2010</strong>
Annex 2.3TOTAL POPULATION BY SEX AND AGE GROUPS, <strong>2010</strong>NoAge Groups(1) (2)1 0 - 4 11,658,856 11,013,204 22,672,0602 5 - 9 11,970,804 11,276,366 23,247,1703 10 - 14 11,659,310 11,018,180 22,677,4904 15 - 19 10,610,119 10,260,967 20,871,0865 20 - 24 9,881,969 9,996,448 19,878,4176 25 - 29 10,626,458 10,673,629 21,300,0877 30 - 34 9,945,211 9,876,989 19,822,2008 35 - 39 9,333,720 9,163,782 18,497,5029 40 - 44 8,319,453 8,199,015 16,518,46810 45 - 49 7,030,168 7,005,784 14,035,95211 50 - 54 5,863,756 5,693,103 11,556,85912 55 - 59 4,398,805 4,046,531 8,445,33613 60 - 64 2,926,073 3,130,238 6,056,31114 65 - 69 2,224,273 2,467,877 4,692,15015 70 - 74 1,530,938 1,924,247 3,455,18516 75+ 1,605,817 2,227,546 3,833,36317 Not Answered 45,183 36,507 81,690Total 119,630,913 118,010,413 237,641,326Source: BPS-Statistics <strong>Indonesia</strong>, Population Census <strong>2010</strong>Males(3)Females(4)Males and Females(5)
Annex 2.4POPULATION GROWTH RATEBY PROVINCE 1971 - <strong>2010</strong>NoProvincesPopulation Growth Rate (% per Year)1971-1980 1980-1990 1990-2000 2000-<strong>2010</strong>(1) (2) (3) (4) (5) (6)1 Aceh 2.93 2.72 1.46 1.352 North Sumatera 2.60 2.06 1.32 1.113 West Sumatera 2.21 1.62 0.62 1.344 Riau 3.11 4.30 4.27 3.595 Jambi 4.07 3.40 1.83 2.556 South Sumatera 3.32 3.15 1.24 1.857 Bengkulu 4.39 4.38 2.20 1.668 Lampung 5.77 2.67 1.17 1.239 Bangka Belitung Islands NA NA NA 3.1410 Riau Islands NA NA NA 4.9911 DKI Jakarta 3.93 2.42 0.13 1.3912 West Java 2.66 2.57 2.24 1.8913 Central Java 1.64 1.18 0.94 0.3714 DI Yogyakarta 1.10 0.57 0.72 1.0215 East Java 1.49 1.08 0.70 0.7616 Banten NA NA NA 2.7917 Bali 1.69 1.18 1.31 2.1518 West Nusa Tenggara 2.36 2.15 1.81 1.1719 East Nusa Tenggara 1.95 1.79 1.63 2.0620 West Kalimantan 2.31 2.65 2.28 0.9121 Central Kalimantan 3.43 3.88 2.98 1.7422 South Kalimantan 2.16 2.32 1.45 1.9823 East Kalimantan 5.73 4.42 2.80 3.8024 North Sulawesi 2.31 1.60 1.40 1.2625 Central Sulawesi 3.86 2.87 2.57 1.9426 South Sulawesi 1.74 1.42 1.48 1.1727 Southeast Sulawesi 3.09 3.66 3.14 2.0728 Gorontalo NA NA NA 2.2429 West Sulawesi NA NA NA 2.6730 Maluku 2.88 2.79 0.67 2.7831 North Maluku NA NA NA 2.4432 West Papua NA NA NA 3.7233 Papua 2.67 3.46 3.10 5.46<strong>Indonesia</strong>2.31 1.98 1.40 1.49Source : BPS-Statistics <strong>Indonesia</strong>, Population Census 1971, 1980, 1990, 2000, Population Inter Census (SUPAS) 1995 and Population Census <strong>2010</strong>, "Laporan Bulanan Data Sosial Ekonomi Edisi 10 March 2011 "NA: Province Expansion Since 1999
Annex 2.5MAINLAND AREA, TOTAL POPULATION AND POPULATION DENSITYBY PROVINCE <strong>2010</strong>NoProvincesMainlandArea(Km²) (a)Per Km²(1) (2) (3) (4) (5) (6) (7)1 Aceh 57,956 2,248,952 2,245,458 4,494,410 782 North Sumatera 72,981 6,483,354 6,498,850 12,982,204 1783 West Sumatera 42,013 2,404,377 2,442,532 4,846,909 1154 Riau 87,024 2,853,168 2,685,199 5,538,367 645 Jambi 50,058 1,581,110 1,511,155 3,092,265 626 South Sumatera 91,592 3,792,647 3,657,747 7,450,394 817 Bengkulu 19,919 877,159 838,359 1,715,518 868 Lampung 34,624 3,916,622 3,691,783 7,608,405 2209 Bangka Belitung Islands 16,424 635,094 588,202 1,223,296 7410 Riau Islands 8,202 862,144 817,019 1,679,163 20511 DKI Jakarta 664 4,870,938 4,736,849 9,607,787 14,46912 West Java 35,378 21,907,040 21,146,692 43,053,732 1,21713 Central Java 32,801 16,091,112 16,291,545 32,382,657 98714 DI Yogyakarta 3,133 1,708,910 1,748,581 3,457,491 1,10415 East Java 47,800 18,503,516 18,973,241 37,476,757 78416 Banten 9,663 5,439,148 5,193,018 10,632,166 1,10017 Bali 5,780 1,961,348 1,929,409 3,890,757 67318 West Nusa Tenggara 18,572 2,183,646 2,316,566 4,500,212 24219 East Nusa Tenggara 48,718 2,326,487 2,357,340 4,683,827 9620 West Kalimantan 147,307 2,246,903 2,149,080 4,395,983 3021 Central Kalimantan 153,565 1,153,743 1,058,346 2,212,089 1422 South Kalimantan 38,744 1,836,210 1,790,406 3,626,616 9423 East Kalimantan 204,534 1,871,690 1,681,453 3,553,143 1724 North Sulawesi 13,852 1,159,903 1,110,693 2,270,596 16425 Central Sulawesi 61,841 1,350,844 1,284,165 2,635,009 4326 South Sulawesi 46,717 3,924,431 4,110,345 8,034,776 17227 Southeast Sulawesi 38,068 1,121,826 1,110,760 2,232,586 5928 Gorontalo 11,257 521,914 518,250 1,040,164 9229 West Sulawesi 16,787 581,526 577,125 1,158,651 6930 Maluku 46,914 775,477 758,029 1,533,506 3331 North Maluku 31,983 531,393 506,694 1,038,087 3232 West Papua 97,024 402,398 358,024 760,422 833 Papua 319,036 1,505,883 1,327,498 2,833,381 9<strong>Indonesia</strong>1,910,931.32 119,630,913 118,010,413 237,641,326 124Source: (a) Directorate General PUM of Ministry of Home Affairs, <strong>2010</strong>(b) BPS-Statistics <strong>Indonesia</strong>, Population Census <strong>2010</strong>Total Population (people) [b]Males Females Males + FemalesPopulationDensity
Annex 2.6NUMBER OF POPULATION BY SEX, AGE GROUP AND DEPENDENCY RATIOBY PROVINCE <strong>2010</strong>NoProvincesMalesFemalesMales + FemalesAge Group (Years Old)Not Age Group (Years Old)Not Age Group (Years Old)NotTotalTotal0-14 15-64 65+ Answered 0-14 15-64 65+ Answered 0-14 15-64 65+ AnsweredTotalDependencyRatio(1) (2) (3) (4) (5) (6) (7) (8) (9) (10) (11) (12) (13) (14) (15) (16) (17) (18)1 Aceh 738,658 1436703 73,588 3 2,248,952 699,372 1,448,615 97,468 3 2,245,458 1,438,030 2,885,318 171,056 6 4,494,410 55.772 North Sumatera 2,219,026 4,053,861 210,119 348 6,483,354 2,096,415 4,108,097 294,014 324 6,498,850 4,315,441 8,161,958 504,133 672 12,982,204 59.053 West Sumatera 797,096 1,495,487 110,395 1,399 2,404,377 749,428 1,527,492 164,183 1,429 2,442,532 1,546,524 3,022,979 274,578 2,828 4,846,909 60.244 Riau 944,893 1,840,012 68,042 221 2,853,168 890,865 1,721,924 72,192 218 2,685,199 1,835,758 3,561,936 140,234 439 5,538,367 55.485 Jambi 485,019 1,043,069 52,643 379 1,581,110 459,430 994,973 56,501 251 1,511,155 944,449 2,038,042 109,144 630 3,092,265 51.706 South Sumatera 1,158,639 2,493,548 139,506 954 3,792,647 1,095,422 2,398,153 163,521 651 3,657,747 2,254,061 4,891,701 303,027 1,605 7,450,394 52.277 Bengkulu 269,637 575,562 31,001 959 877,159 254,588 548,343 34,839 589 838,359 524,225 1,123,905 65,840 1,548 1,715,518 52.508 Lampung 1,152,258 2,578,331 183,914 2,119 3,916,622 1,086,878 2,417,964 185,659 1,282 3,691,783 2,239,136 4,996,295 369,573 3,401 7,608,405 52.219 Bangka Belitung Islands 184,862 429,702 20,412 118 635,094 175,674 388,249 24,216 63 588,202 360,536 817,951 44,628 181 1,223,296 49.5310 Riau Islands 254,021 590,833 16,910 380 862,144 238,612 561,038 17,116 253 817,019 492,633 1,151,871 34,026 633 1,679,163 45.7211 DKI Jakarta 1,179,776 3,550,850 138,441 1,871 4,870,938 1,117,856 3,462,458 155,246 1,289 4,736,849 2,297,632 7,013,308 293,687 3,160 9,607,787 36.9512 West Java 6,470,027 14,503,547 918,749 14,717 21,907,040 6,124,621 13,950,656 1,059,644 11,771 21,146,692 12,594,648 28,454,203 1,978,393 26,488 43,053,732 51.2213 Central Java 4,376,532 10,682,795 1,031,768 17 16,091,112 4,139,235 10,860,520 1,291,773 17 16,291,545 8,515,767 21,543,315 2,323,541 34 32,382,657 50.3114 DI Yogyakarta 390,675 1,171,571 143,748 2,916 1,708,910 368,647 1,193,515 184,784 1,635 1,748,581 759,322 2,365,086 328,532 4,551 3,457,491 46.0015 East Java 4,724,653 12,642,240 1,122,271 14,352 18,503,516 4,486,631 12,946,813 1,526,344 13,453 18,973,241 9,211,284 25,589,053 2,648,615 27,805 37,476,757 46.3516 Banten 1,640,944 3,662,065 135,893 246 5,439,148 1,541,255 3,488,636 162,846 281 5,193,018 3,182,199 7,150,701 298,739 527 10,632,166 48.6817 Bali 520,899 1,321,726 118,720 3 1,961,348 486324 1,304,905 138,180 1,929,409 1,007,223 2,626,631 256,900 3 3,890,757 48.1318 West Nusa Tenggara 719,018 1,369,324 95,287 17 2,183,646 682,767 1,523,817 109,968 14 2,316,566 1,401,785 2,893,141 205,255 31 4,500,212 55.5519 East Nusa Tenggara 898,567 1,316,603 111,125 192 2,326,487 849,112 1,387,063 121,031 134 2,357,340 1,747,679 2,703,666 232,156 326 4,683,827 73.2320 West Kalimantan 717,996 1,450,825 77,726 356 2,246,903 682,208 1,387,061 79,510 301 2,149,080 1,400,204 2,837,886 157,236 657 4,395,983 54.8821 Central Kalimantan 352,275 769,516 31,951 1 1,153,743 332,198 693,908 32,239 1 1,058,346 684,473 1,463,424 64,190 2 2,212,089 51.1622 South Kalimantan 544,555 1,236,416 55,232 7 1,836,210 511,351 1,203,573 75,477 5 1,790,406 1,055,906 2,439,989 130,709 12 3,626,616 48.6323 East Kalimantan 561,000 1,266,864 42,529 1,297 1,871,690 525,732 1,113,837 41,038 846 1,681,453 1,086,732 2,380,701 83,567 2,143 3,553,143 49.1624 North Sulawesi 327,254 776,894 55,706 49 1,159,903 305,156 734,341 71,169 27 1,110,693 632,410 1,511,235 126,875 76 2,270,596 50.2425 Central Sulawesi 450,644 853,448 46,405 347 1,350,844 424,749 810,799 48,376 241 1,284,165 875,393 1,664,247 94,781 588 2,635,009 58.3026 South Sulawesi 1,276,892 2,461,105 186,051 383 3,924,431 1,205,617 2,649,089 255,327 312 4,110,345 2,482,509 5,110,194 441,378 695 8,034,776 57.2227 Southeast Sulawesi 403,131 679,618 38,210 867 1,121,826 379,095 684,977 46,011 677 1,110,760 782,226 1,364,595 84,221 1,544 2,232,586 63.4928 Gorontalo 170,664 334,693 16,551 6 521,914 162,501 334,990 20,750 9 518,250 333,165 669,683 37,301 15 1,040,164 55.3229 West Sulawesi 214,904 344,712 21,700 210 581,526 202,737 348,882 25,342 164 577,125 417,641 693,594 47,042 374 1,158,651 67.0030 Maluku 286,647 459,419 29,411 NA 775,477 267,854 457,766 32,409 NA 758,029 554,501 917,185 61,820 NA 1,533,506 67.2031 North Maluku 190,293 326,613 14,440 47 531,393 179,157 312,135 15,375 27 506,694 369,450 638,748 29,815 74 1,038,087 62.5132 West Papua 134,483 260,711 6,922 282 402,398 125,119 227,217 5,594 94 358,024 259,602 487,928 12,516 376 760,422 55.7733 Papua 533,032 957,069 15,662 120 1,505,883 461,144 854,680 11,528 146 1,327,498 994,176 1,811,749 27,190 266 2,833,381 56.37<strong>Indonesia</strong>35,288,970 78,935,732 5,361,028 45,183 119,630,913 33,307,750 78,046,486 6,619,670 36,507 118,010,413 68,596,720 156,982,218 11,980,698 81,690 237,641,326 51.33Source: BPS-Statistics <strong>Indonesia</strong>, People Estimation of <strong>Health</strong> Program Target, from"Data Penduduk Sasaran Program Pembangunan Kesehatan 2007 - 2011", Ministry of <strong>Health</strong> Republic of <strong>Indonesia</strong>, 2009.NA: Not Aplicable
Annex 2.7NUMBER AND PERCENTAGE OF UNDERDEVELOPED DISTRICTSBY PROVINCE 2006 - <strong>2010</strong>NoProvincesNumber ofDistrictsUnderdevelopedDistricts(%)Number ofDistrictsUnderdevelopedDistricts(%)Number ofDistrictsUnderdevelopedDistricts(%)Number ofDistrictsUnderdevelopedDistricts(%)Number ofDistrictsUnderdevelopedDistricts(1) (2) (3) (4) (5) (6) (7) (8) (9) (10) (11) (12) (13) (14) (15) (16) (17)1 Aceh 21 16 76.19 23 16 69.57 23 16 69.57 23 16 69.57 23 12 52.172 North Sumatera 25 6 24.00 28 6 21.43 33 6 18.18 33 6 18.18 33 6 18.183 West Sumatera 19 9 47.37 19 9 47.37 19 9 47.37 19 9 47.37 19 8 42.114 Riau 11 2 18.18 11 2 18.18 11 2 18.18 12 2 16.67 12 0 0.005 Jambi 10 2 20.00 10 2 20.00 11 2 18.18 11 2 18.18 11 0 0.006 South Sumatera 14 6 42.86 15 6 40.00 15 6 40.00 15 6 40.00 15 7 46.677 Bengkulu 9 8 88.89 9 8 88.89 10 8 80.00 10 8 80.00 10 6 60.008 Lampung 10 5 50.00 11 5 45.45 14 5 35.71 14 5 35.71 14 4 28.579 Bangka Belitung Islands 7 3 42.86 7 3 42.86 7 3 42.86 7 3 42.86 7 1 14.2910 Riau Islands 6 1 16.67 6 1 16.67 7 1 14.29 7 1 14.29 7 2 28.5711 DKI Jakarta 6 0 0.00 6 0 0 6 0 0.00 6 0 0.00 6 0 0.0012 West Java 25 2 8.00 26 2 7.692 26 2 7.69 26 2 7.69 26 2 7.6913 Central Java 35 3 8.57 35 3 8.571 35 3 8.57 35 3 8.57 35 0 0.0014 DI Yogyakarta 5 2 40.00 5 2 40.00 5 2 40.00 5 2 40.00 5 0 0.0015 East Java 38 8 21.05 38 8 21.05 38 8 21.05 38 8 21.05 38 5 13.1616 Banten 6 2 33.33 7 2 28.57 8 2 25.00 8 2 25.00 8 2 25.0017 Bali 9 1 11.11 9 1 11.11 9 1 11.11 9 1 11.11 9 0 0.0018 West Nusa Tenggara 9 7 77.78 9 6 66.67 10 6 60.00 10 7 70.00 10 8 80.0019 East Nusa Tenggara 16 15 93.75 20 15 75.00 21 15 71.43 21 15 71.43 21 20 95.2420 West Kalimantan 12 9 75.00 14 10 71.43 14 10 71.43 14 9 64.29 14 10 71.4321 Central Kalimantan 14 7 50.00 14 7 50.00 14 7 50.00 14 7 50.00 14 1 7.1422 South Kalimantan 13 0 0.00 13 2 15.38 13 2 15.38 13 2 15.38 13 2 15.3823 East Kalimantan 13 5 38.46 14 3 21.43 14 3 21.43 14 3 21.43 14 3 21.4324 North Sulawesi 9 2 22.22 13 2 15.38 15 2 13.33 15 2 13.33 15 3 20.0025 Central Sulawesi 10 9 90.00 10 9 90.00 11 9 81.82 11 9 81.82 11 10 90.9126 South Sulawesi 23 13 56.52 23 13 56.52 24 13 54.17 24 13 54.17 24 4 16.6727 Southeast Sulawesi 10 8 80.00 12 8 66.67 12 8 66.67 12 8 66.67 12 9 75.0028 Gorontalo 5 4 80.00 6 4 66.67 6 4 66.67 6 4 66.67 6 3 50.0029 West Sulawesi 5 5 100.00 5 5 100.00 5 5 100.00 5 5 100.00 5 5 100.0030 Maluku 8 7 87.50 9 7 77.78 11 7 63.64 11 7 63.64 11 8 72.7331 North Maluku 8 6 75.00 8 6 75.00 9 6 66.67 9 6 66.67 9 7 77.7832 West Papua 9 7 77.78 9 7 77.78 10 7 70.00 11 7 63.64 11 8 72.7333 Papua 20 19 95.00 21 19 90.48 29 19 65.52 29 19 65.52 29 27 93.10<strong>Indonesia</strong>2006Source: Ministry of Underdeveloped Area Development Republic of <strong>Indonesia</strong> , <strong>2010</strong>2007 20082009 <strong>2010</strong>440 199 45.2 465 199 42.80 495 199 40.20 497 199 40.04 497 183 36.82(%)
Annex 2.838 DISTRICTS AS PRIORITY AND VERY PRIORITY AREAIN BORDER AND OUTER ISLANDS REGION IN INDONESIA <strong>2010</strong>No Provinces DistrictsCategory(1) (2) (3)(4)1 A c e h 1 Sabang Very Priority2 North Sumatera 1 Serdang Bedagai Priority3 R i a u 1 Dumai Priority2 Bengkalis Priority3 Rotan Hilir Priority4 Indragiri Hilir Priority5 Meranti Islands Priority4 Riau Islands 1 Karimun Priority2 Batam Very Priority3 Natuna Very Priority4 Bintan Priority5 Anambas Islands Priority5 East Nusa Tenggara 1 Kupang Very Priority2 Timor Tengah Utara Very Priority3 Belu Very Priority4 Alor Priority5 Rote Ndao Priority6 West Kalimantan 1 Sambas Very Priority2 Bengkayang Very Priority3 Sanggau Very Priority4 Sintang Very Priority5 Hulu Very Priority7 East Kalimantan 1 Nunukan Very Priority2 Malinau Very Priority3 Kutai Barat Very Priority8 North Sulawesi 1 Talaud Islands Very Priority2 Sangihe Islands Very Priority9 Maluku 1 Maluku Barat Daya Priority2 Maluku Tenggara Barat Priority3 Aru Islands Priority10 North Maluku 1 Morotai Priority11 West Papua 1 Raja Ampat Priority12 Papua 1 Keerom Priority2 Merauke Very Priority3 Boven Digoel Very Priority4 Bintang Mountains Priority5 Jayapura Very Priority6 Supiori Priority<strong>Indonesia</strong>38Source: Ministry of Underdeveloped Area Development Republic of <strong>Indonesia</strong>, <strong>2010</strong>Note:Very Priority : if it meets the three indicators of underdevelop areaPriority : if it meets the two indicators of underdevelop area
Annex 2.9POVERTY LINE OF POOR PEOPLE BY PROVINCE AND AREA (MARCH, <strong>2010</strong>)Poverty Line of Poor People (Rupiahs/Capita/Month)NoProvincesUrban Rural Urban + Rural(1) (2) (3) (4) (5)1 Aceh 308,306 266,285 278,3892 North Sumatera 247,547 201,810 222,8983 West Sumatera 262,173 214,458 230,8234 Riau 276,627 235,267 256,1125 Jambi 262,826 193,834 216,1876 South Sumatera 258,304 198,572 221,6877 Bengkulu 255,762 209,616 225,8578 Lampung 236,098 189,954 202,4149 Bangka Belitung Islands 289,644 283,302 286,33410 Riau Islands 321,668 265,258 295,09511 DKI Jakarta 331,169 - 331,16912 West Java 212,210 185,335 201,13813 Central Java 205,606 179,982 192,43514 DI Yogyakarta 240,282 195,406 224,25815 East Java 213,383 185,879 199,32716 Banten 220,771 188,741 208,02317 Bali 222,868 188,071 208,15218 West Nusa Tenggara 223,784 176,283 196,18519 East Nusa Tenggara 241,807 160,743 175,30820 West Kalimantan 207,884 182,293 189,40721 Central Kalimantan 220,658 212,790 215,46622 South Kalimantan 230,712 196,753 210,85023 East Kalimantan 307,479 248,583 285,21824 North Sulawesi 202,469 188,096 194,33425 Central Sulawesi 231,225 195,795 203,23726 South Sulawesi 186,693 151,879 163,08927 Southeast Sulawesi 177,787 161,451 165,20828 Gorontalo 180,606 167,162 171,37129 West Sulawesi 182,206 165,914 171,35630 Maluku 249,895 217,599 226,03031 North Maluku 238,533 202,185 212,98232 West Papua 319,170 287,512 294,72733 Papua 298,285 247,563 259,128<strong>Indonesia</strong>232,988 192,354 211,726Source: BPS-Statistics <strong>Indonesia</strong>, 2011
Annex 2.10NUMBER AND PERCENTAGE OF POOR PEOPLE BY PROVINCE AND AREA 2008 - <strong>2010</strong>NoProvincesNumber(thousand)%Number(thousand)%Number(thousand)%Number(thousand)%(1) (2) (3) (4) (5) (6) (7) (8) (9) (10) (11) (12) (13) (14) (15) (16) (17) (18) (19) (20)1 Aceh 195.8 16.67 763.9 26.30 959.7 23.53 182.1 15.44 710.7 24.37 892.8 21.80 173.4 14.65 688.5 23.54 861.9 20.982 North Sumatera 761.7 12.85 852.1 12.29 1,613.8 12.55 688.0 11.45 811.6 11.56 1499.7 11.51 689.0 11.34 801.9 11.29 1490.9 11.313 West Sumatera 127.3 8.30 349.9 11.91 477.2 10.67 115.8 7.50 313.5 10.00 429.3 9.54 106.2 6.84 323.8 10.88 430.0 9.504 Riau 245.1 9.12 321.6 12.16 566.7 10.63 225.6 8.04 301.9 10.93 527.5 9.48 208.9 7.17 291.3 10.15 500.3 8.655 Jambi 120.1 13.28 140.2 7.43 260.3 9.32 117.3 12.71 132.4 6.88 249.7 8.77 110.8 11.80 130.8 6.67 241.6 8.346 South Sumatera 514.7 18.87 734.9 17.01 1,249.6 17.73 470.0 16.93 697.9 15.87 1167.9 16.28 471.2 16.73 654.5 14.67 1125.7 15.477 Bengkulu 131.8 21.95 220.2 19.93 352.0 20.64 117.6 19.16 206.5 18.28 324.1 18.59 117.2 18.75 207.7 18.05 324.9 18.308 Lampung 365.6 17.85 1226.0 22.14 1,591.6 20.98 349.3 16.78 1209.0 21.49 1558.0 20.22 301.7 14.30 1178.2 20.65 1479.9 18.949 Bangka Belitung Islands 36.5 7.57 50.2 9.52 86.7 8.58 28.8 5.86 47.9 8.93 76.6 7.46 21.9 4.39 45.9 8.45 67.8 6.5110 Riau Islands 69.2 8.81 67.1 9.60 136.4 9.18 62.6 7.63 65.6 8.98 128.2 8.27 67.1 7.87 62.6 8.24 129.7 8.0511 DKI Jakarta 379.6 4.29 - - 379.6 4.29 323.2 3.62 - - 323.0 3.62 312.2 3.48 - - 312.2 3.4812 West Java 2617.4 10.88 2705.0 16.05 5,322.4 13.01 2531.4 10.33 2452.2 14.28 4983.6 11.96 2350.5 9.43 2423.2 13.88 4773.7 11.2713 Central Java 2556.5 16.34 3633.1 21.96 6,189.6 19.23 2420.9 15.41 3304.8 19.89 5725.7 17.72 2258.9 14.33 3110.2 18.66 5369.2 16.5614 DI Yogyakarta 324.2 14.99 292.1 24.32 616.3 18.32 311.5 14.25 274.3 22.60 585.8 17.23 308.4 13.98 268.9 21.95 577.3 16.8315 East Java 2310.6 13.15 4340.6 23.64 6,651.3 18.51 2148.5 12.17 3874.1 21.00 6022.6 16.68 1873.6 10.58 3655.8 19.74 5529.3 15.2616 Banten 371.0 6.15 445.7 11.18 816.7 8.15 348.7 5.62 439.3 10.70 788.1 7.64 318.3 4.99 439.9 10.44 758.2 7.1617 Bali 115.1 5.70 100.7 6.81 215.7 6.17 92.1 4.50 89.7 5.98 181.7 5.13 83.6 4.04 91.3 6.02 174.9 4.8818 West Nusa Tenggara 560.4 29.47 520.2 19.73 1,080.6 23.81 557.5 28.84 493.4 18.40 1051.0 22.78 552.6 28.16 456.7 16.78 1009.4 21.5519 East Nusa Tenggara 119.3 15.50 979.1 27.88 1,098.3 25.65 109.4 14.01 903.7 25.35 1013.2 23.31 107.4 13.57 906.7 25.10 1014.1 23.0320 West Kalimantan 127.5 9.98 381.3 11.49 508.8 11.07 94.0 7.23 340.8 10.09 434.8 9.30 83.4 6.31 345.3 10.06 428.8 9.0221 Central Kalimantan 45.3 5.81 154.6 10.20 200.0 8.71 35.8 4.45 130.1 8.34 165.9 7.02 33.2 4.03 131.0 8.19 164.2 6.7722 South Kalimantan 81.1 5.79 137.8 6.97 218.9 6.48 68.8 4.82 107.2 5.33 176.0 5.12 65.8 4.54 116.2 5.69 182.0 5.2123 East Kalimantan 110.4 5.89 176.1 15.47 286.4 9.51 77.1 4.00 162.2 13.86 239.2 7.73 79.2 4.02 163.8 13.66 243.0 7.6624 North Sulawesi 72.7 7.56 150.9 12.04 223.5 10.10 79.3 8.14 140.3 11.05 219.6 9.79 76.4 7.75 130.4 10.14 206.7 9.1025 Central Sulawesi 60.9 11.47 463.8 23.22 524.7 20.75 54.7 10.09 435.2 21.35 489.8 18.98 54.2 9.82 420.8 20.26 475.0 18.0726 South Sulawesi 150.8 6.05 880.9 16.79 1,031.7 13.34 124.5 4.94 839.1 15.81 963.6 12.31 119.2 4.70 794.3 14.88 913.4 11.6027 Southeast Sulawesi 27.2 5.29 408.7 23.78 435.9 19.53 26.2 4.96 408.2 23.11 434.3 18.93 22.2 4.10 378.5 20.92 400.7 17.0528 Gorontalo 27.5 9.87 194.1 31.72 221.6 24.88 22.2 7.89 202.4 32.82 224.6 25.01 17.8 6.29 192.1 30.89 209.9 23.1929 West Sulawesi 48.3 14.14 122.8 18.03 171.1 16.73 43.5 12.59 114.7 16.65 158.2 15.29 33.7 9.70 107.6 15.52 141.3 13.5830 Maluku 44.7 12.97 346.7 35.56 391.3 29.66 38.8 11.03 341.2 34.30 380.0 28.23 36.4 10.20 342.3 33.94 378.6 27.7431 North Maluku 9.0 3.27 96.0 14.67 105.1 11.28 8.7 3.10 89.3 13.42 98.0 10.36 7.6 2.66 83.4 12.28 91.1 9.4232 West Papua 9.5 5.93 237.0 43.74 246.5 35.12 8.6 5.22 248.3 44.71 256.8 35.71 9.6 5.73 246.7 43.48 256.3 34.8833 Papua 31.6 7.02 701.5 45.96 733.1 37.08 28.2 6.10 732.2 46.81 760.4 37.53 26.2 5.55 735.4 46.02 761.6 36.80<strong>Indonesia</strong>12768.5 11.65 22194.8 18.93 34963.3 15.42 11910.5 10.72 20619.4 17.35 32530.0 14.15 11097.8 9.87 19925.6 16.56 31023.4 13.33Source: BPS-Statistics <strong>Indonesia</strong>, "Berita Resmi Statistik No. 45/07/Th.XIII" 1 July <strong>2010</strong>March 2008 March 2009Urban Rural Urban + Rural Urban RuralNumber(thousand)%Urban + RuralNumber(thousand)%Number(thousand)%March <strong>2010</strong>Urban Rural Urban + RuralNumber(thousand)%Number(thousand)%
Annex 2.11PERCENTAGE OF HOUSEHOLDS WITH PHYSICAL QUALITY OF DRINKING WATERBY PROVINCE IN INDONESIA, RISKESDAS <strong>2010</strong>NoProvincePhysical Quality of Drinking WaterTurbid Color Tasted Foam Smell Good*)(1) (2) (3) (4) (5) (6) (7) (8)1 Aceh 12.3 6.2 2.1 1.1 2.2 84.52 North Sumatera 11.4 7.0 5.6 1.5 4.2 84.53 West Sumatera 6.4 5.7 2.8 1.3 3.4 91.34 Riau 5.6 4.9 3.9 2.3 3.9 90.55 Jambi 11.9 6.6 2.5 1.2 3.8 84.26 South Sumatera 14.7 7.4 6.3 2.2 4.5 81.47 Bengkulu 10.3 6.0 7.8 1.3 3.4 84.18 Lampung 10.4 5.1 3.3 2.3 3.2 87.19 Bangka Belitung Islands 2.2 1.0 6.2 0.7 0.7 92.010 Riau Islands 3.8 3.0 2.3 0.9 1.5 94.911 DKI Jakarta 4.0 1.9 3.0 0.5 3.6 92.412 West Java 4.6 2.8 2.5 0.8 2.2 92.613 Central Java 4.5 2.3 1.4 0.7 1.9 94.114 DI Yogyakarta 4.6 2.0 0.8 0.2 0.9 94.315 East Java 4.5 2.4 2.2 0.7 1.8 93.816 Banten 5.8 3.5 4.7 1.6 3.0 90.517 Bali 1.9 2.2 1.6 0.4 1.2 95.718 West Nusa Tenggara 6.8 3.8 5.7 1.0 2.0 89.019 East Nusa Tenggara 5.7 5.4 3.0 0.8 1.0 88.220 West Kalimantan 14.6 12.0 8.9 6.5 5.9 75.621 Central Kalimantan 19.3 12.1 4.0 1.3 4.9 76.822 South Kalimantan 18.2 10.5 6.2 1.1 4.1 76.323 East Kalimantan 11.1 7.4 3.5 1.6 3.2 87.224 North Sulawesi 7.7 4.5 2.0 0.4 1.3 91.525 Central Sulawesi 11.1 7.5 9.0 1.9 4.8 79.226 South Sulawesi 7.6 3.3 5.5 1.7 4.1 87.927 Southeast Sulawesi 11.8 4.7 10.0 0.8 1.7 79.428 Gorontalo 9.1 5.6 10.3 2.9 4.7 84.529 West Sulawesi 9.8 3.4 3.1 1.3 2.7 87.630 Maluku 16.8 5.5 6.3 2.4 3.6 80.331 North Maluku 1.4 1.2 5.4 0.3 1.2 92.332 West Papua 5.1 9.3 1.4 0.9 3.6 88.833 Papua 24.2 15.4 15.6 3.0 10.4 69.0<strong>Indonesia</strong>6.9 4.0 3.4 1.2 2.7 90.0Note: *) Good = no turbidity, no color, no taste, no foaming and no smellSource: National Board of <strong>Health</strong> Research and Development, Ministry of <strong>Health</strong> Republic of <strong>Indonesia</strong>, Riskesdas <strong>2010</strong>
Annex 2.12PERCENTAGE OF HOUSEHOLDS BY SOURCE OF CLEAN WATER FACILITIES FOR DOMESTIC PURPOSEBY PROVINCE IN INDONESIA, RISKESDAS <strong>2010</strong>Source of Clean Water FacilitiesNoProvincesPipe/drinking waterRetail pipe drinkingwater/buying waterArtesian Well/pumpProtected wellUnprotected wellProtected SpringUnprotected SpringRain water tankRiver/lake/irrigationOthers(1) (2) (3) (4) (5) (6) (7) (8) (9) (10) (11) (12)1 Aceh 23.0 0.4 9.3 38.7 13.4 5.0 5.1 1.0 2.7 1.42 North Sumatera 25.4 1.4 18.9 22.2 6.7 8.8 3.5 3.4 9.5 0.33 West Sumatera 26.7 0.7 5.8 23.0 13.4 10.3 9.7 1.0 9.3 0.04 Riau 2.8 0.4 19.4 35.5 22.0 2.9 2.6 6.8 7.4 0.15 Jambi 19.7 1.7 10.4 24.7 22.4 0.9 1.5 3.2 10.7 4.86 South Sumatera 12.9 0.4 6.8 33.7 18.1 3.7 1.2 3.2 19.9 0.17 Bengkulu 16.1 0.8 6.5 41.1 22.1 2.6 5.4 0.2 4.6 0.68 Lampung 5.3 0.5 6.6 48.7 27.6 3.7 5.3 1.2 1.0 0.19 Bangka Belitung Islands 0.4 0.9 15.1 36.2 25.4 3.9 3.9 1.6 12.4 0.210 Riau Islands 31.1 3.1 1.6 44.3 16.6 1.6 0.6 0.2 0.9 0.011 DKI Jakarta 42.5 2.2 50.6 3.4 1.1 0.1 0.0. 0.0 0.0 0.012 West Java 13.5 1.2 30.6 30.5 7.8 9.3 4.3 0.1 2.3 0.313 Central Java 19.7 0.6 14.9 36.7 8.2 13.6 3.9 0.5 1.6 0.214 DI Yogyakarta 13.2 0.3 5.7 63.2 5.4 2.3 3.0 6.8 0.1 0.015 East Java 17.6 1.3 32.4 25.5 8.1 9.4 3.3 0.7 1.6 0.116 Banten 12.6 1.4 48.2 20.3 7.6 3.3 3.8 0.4 1.8 0.717 Bali 52.2 2.1 7.9 23.1 4.8 3.0 1.6 3.5 1.7 0.118 West Nusa Tenggara 15.6 2.0 15.8 37.3 15.4 10.5 1.6 0.0 1.6 0.119 East Nusa Tenggara 30.7 12.0 2.8 11.6 7.6 20.3 6.8 1.0 3.8 3.220 West Kalimantan 13.7 0.7 6.0 14.1 13.9 4.1 1.1 8.3 36.7 1.321 Central Kalimantan 22.6 0.1 16.6 7.8 4.1 4.4 1.3 4.0 38.9 0.122 South Kalimantan 27.5 1.0 14.9 17.7 10.1 1.1 0.5 0.1 27.1 0.123 East Kalimantan 48.8 2.0 5.6 7.1 6.2 1.2 2.5 11.1 15.3 0.224 North Sulawesi 25.2 0.4 12.8 19.0 18.0 19.0 5.0 0.1 0.2 0.325 Central Sulawesi 22.3 1.9 17.3 10.7 8.1 21.5 7.2 0.1 9.1 1.826 South Sulawesi 22.3 1.1 17.9 19.7 18.1 11.8 4.0 2.1 3.0 0.027 Southeast Sulawesi 39.0 0.9 9.9 22.8 5.6 12.4 2.1 3.4 3.7 0.128 Gorontalo 17.9 0.9 10.7 47.8 9.1 4.9 2.0 0.0 6.5 0.129 West Sulawesi 8.4 0.8 10.9 25.9 7.4 23.7 6.6 2.8 13.2 0.230 Maluku 18.2 2.4 8.0 25.4 23.9 7.6 11.5 1.9 1.1 0.031 North Maluku 23.4 0.8 2.7 40.6 22.9 1.8 2.4 0.5 5.0 0.032 West Papua 24.6 0.8 10.0 26.7 9.1 2.6 0.4 13.1 12.5 0.233 Papua 15.9 0.8 9.7 16.3 14.8 5.3 17.3 11.2 7.9 0.9<strong>Indonesia</strong>19.5 1.3 22.2 27.9 10.2 8.4 3.7 1.6 4.9 0.4Source: National Board of <strong>Health</strong> Research and Development, Ministry of <strong>Health</strong> Republic of <strong>Indonesia</strong>, Riskesdas <strong>2010</strong>
Annex 2.13PERCENTAGE OF HOUSEHOLDS BY SOURCE OF DRINKING WATER FACILITIES FOR DOMESTIC PURPOSEBY PROVINCE IN INDONESIA, RISKESDAS <strong>2010</strong>Source of Drinking Water FacilitiesNoProvincesPackaged WaterRetail Drinking WaterPipe/drinking waterRetail pipe drinkingwater/buying waterArtesian Well/PumpProtected wellUnprotected wellProtected SpringUnprotected SpringRain water tankRiver/lake/irrigationOthers(1) (2) (3) (4) (5) (6) (7) (8) (9) (10) (11) (12) (13) (14)1 Aceh 2.7 30.4 9.6 0.9 3.9 28.9 10.1 3.5 6.0 1.9 0.9 1.32 North Sumatera 3.3 11.2 22.5 2.3 15.5 19.2 4.5 8.4 3.9 3.5 5.4 0.23 West Sumatera 1.8 17.2 20.8 0.2 3.9 22.1 10.0 9.8 9.1 1.4 3.6 0.04 Riau 4.5 25.5 1.0 1.0 9.3 23.4 11.7 0.2 0.5 21.2 1.6 0.15 Jambi 2.7 17.8 12.8 1.8 5.9 19.7 22.8 0.9 0.4 13.7 1.7 0.06 South Sumatera 2.0 14.4 10.1 1.8 4.5 33.3 16.3 2.0 1.0 4.9 9.7 0.07 Bengkulu 1.0 7.9 13.2 0.6 7.2 39.6 22.1 0.5 2.9 0.4 4.1 0.58 Lampung 4.2 4.3 4.5 1.5 4.5 49.7 23.7 1.5 4.9 0.8 0.4 0.19 Bangka Belitung Islands 12.1 27.9 0.7 0.2 7.0 25.1 17.5 3.8 0.5 3.1 2.0 0.010 Riau Islands 9.7 45.5 6.1 2.0 0.3 27.3 8.5 0.2 0.2 0.1 0.0 0.011 DKI Jakarta 36.2 29.3 15.8 2.5 14.8 1.0 0.1 0.2 0.0 0.1 0.0 0.012 West Java 8.8 17.3 9.4 1.8 17.8 27.1 6.0 7.6 3.6 0.2 0.4 0.013 Central Java 4.2 5.0 19.2 2.6 11.7 35.2 6.3 11.7 2.9 0.4 0.8 0.114 DI Yogyakarta 11.6 8.0 8.4 0.6 4.1 51.0 5.4 1.2 3.0 6.7 0.0 0.015 East Java 8.8 8.5 13.3 2.1 24.8 24.0 6.3 8.0 3.3 0.5 0.3 0.016 Banten 15.0 25.8 5.5 1.9 23.7 15.4 4.3 2.4 3.8 1.3 0.6 0.317 Bali 19.5 13.3 33.9 1.2 3.1 13.4 3.1 4.8 3.7 3.9 0.1 0.018 West Nusa Tenggara 5.3 13.2 12.6 2.7 12.2 33.4 11.2 8.7 0.5 0.1 0.1 0.019 East Nusa Tenggara 1.0 3.9 30.1 10.3 3.8 12.1 6.6 19.8 6.1 1.1 2.8 2.520 West Kalimantan 4.1 7.2 7.5 0.2 2.5 5.6 3.6 4.6 1.9 45.0 17.3 0.421 Central Kalimantan 3.2 14.4 14.3 0.6 10.3 10.9 3.4 1.0 8.6 8.2 25.1 0.122 South Kalimantan 2.4 12.6 27.3 2.4 13.7 14.5 7.3 0.1 0.2 2.5 17.0 0.023 East Kalimantan 6.8 29.6 26.3 0.9 3.2 3.8 3.5 1.9 2.0 14.0 7.5 0.424 North Sulawesi 8.7 25.1 18.7 0.3 6.3 11.3 8.8 15.4 5.3 0.0 0.0 0.025 Central Sulawesi 1.8 9.9 18.8 1.5 12.7 11.5 7.3 20.8 6.0 0.0 7.6 2.026 South Sulawesi 2.3 16.7 16.5 1.1 13.8 15.5 13.9 11.1 3.5 3.3 2.4 0.027 Southeast Sulawesi 5.4 8.9 32.3 1.7 4.2 26.1 8.1 8.3 1.5 0.3 3.3 0.028 Gorontalo 1.5 3.8 17.7 1.5 10.5 50.5 8.0 3.8 1.0 0.2 1.4 0.129 West Sulawesi 0.8 9.3 6.8 1.5 5.6 29.6 5.8 26.3 7.5 1.4 5.0 0.430 Maluku 0.6 4.7 14.1 3.4 7.4 22.1 24.5 10.3 8.4 3.5 0.9 0.031 North Maluku 2.5 3.8 21.0 0.6 4.2 40.3 18.6 0.5 0.0 3.6 5.0 0.032 West Papua 2.4 25.5 17.0 0.4 1.1 18.1 6.1 2.2 0.4 15.1 11.7 0.033 Papua 4.0 17.2 12.9 0.8 2.2 8.0 9.7 6.3 15.5 18.3 4.4 0.7<strong>Indonesia</strong>7.8 13.8 14.2 2.0 14.0 24.7 7.7 7.1 3.3 2.9 2.3 0.2Source: National Board of <strong>Health</strong> Research and Development, Ministry of <strong>Health</strong> Republic of <strong>Indonesia</strong>, Riskesdas <strong>2010</strong>
Annex 2.14PERCENTAGE OF HOUSEHOLDS FOR ACCESS TO QUALITY DRINKING WATERBY PROVINCE IN INDONESIA, RISKESDAS <strong>2010</strong>NoProvincesAccess to Quality Drinking WaterPoorGood*)(1) (2) (3) (4)1 Aceh 37.1 62.92 North Sumatera 35.6 64.53 West Sumatera 33.7 66.44 Riau 41.8 58.25 Jambi 49.3 50.76 South Sumatera 51.3 48.77 Bengkulu 49.0 51.18 Lampung 53.9 46.19 Bangka Belitung Islands 36.5 63.510 Riau Islands 26.2 73.911 DKI Jakarta 13.0 87.012 West Java 29.6 70.413 Central Java 26.0 74.014 DI Yogyakarta 23.2 76.815 East Java 24.9 75.116 Banten 25.8 74.217 Bali 20.3 79.718 West Nusa Tenggara 34.1 65.919 East Nusa Tenggara 46.2 53.820 West Kalimantan 64.1 35.921 Central Kalimantan 55.8 44.222 South Kalimantan 50.5 49.523 East Kalimantan 36.6 63.424 North Sulawesi 28.1 71.925 Central Sulawesi 38.8 61.226 South Sulawesi 43.2 56.827 Southeast Sulawesi 39.2 60.828 Gorontalo 30.3 69.729 West Sulawesi 37.0 63.030 Maluku 59.4 40.631 North Maluku 43.4 56.632 West Papua 35.5 64.533 Papua 58.7 41.3<strong>Indonesia</strong>32.5 67.5Source: National Board of <strong>Health</strong> Research and Development, Ministry of <strong>Health</strong> Republic of <strong>Indonesia</strong>, Riskesdas <strong>2010</strong>
Annex 2.15PERCENTAGE OF HOUSEHOLDS BY ACCESS TO DRINKING WATERBY PROVINCE IN INDONESIA, RISKESDAS <strong>2010</strong>Access to Drinking WaterNoProvincesDifficult inHardYes (easy)dry seasonthroughout the year(1) (2) (3) (4) (5)1 Aceh 89.0 10.9 0.22 North Sumatera 82.0 17.5 0.53 West Sumatera 88.6 11.1 0.24 Riau 70.7 29.3 0.15 Jambi 74.9 25.0 0.16 South Sumatera 71.5 28.2 0.37 Bengkulu 83.2 16.6 0.28 Lampung 69.7 29.8 0.59 Bangka Belitung Islands 74.7 25.3 0.010 Riau Islands 85.0 14.3 0.711 DKI Jakarta 93.3 6.5 0.212 West Java 81.1 18.6 0.313 Central Java 85.3 14.5 0.214 DI Yogyakarta 85.8 14.2 0.015 East Java 84.9 14.6 0.516 Banten 84.7 15.0 0.317 Bali 86.6 13.1 0.318 West Nusa Tenggara 80.1 18.1 1.819 East Nusa Tenggara 71.5 26.6 1.920 West Kalimantan 57.8 41.8 0.421 Central Kalimantan 78.6 21.3 0.122 South Kalimantan 72.9 26.7 0.323 East Kalimantan 76.8 21.1 2.024 North Sulawesi 87.8 11.8 0.325 Central Sulawesi 90.6 9.3 0.126 South Sulawesi 79.5 20.3 0.227 Southeast Sulawesi 81.9 17.9 0.128 Gorontalo 89.5 10.1 0.329 West Sulawesi 87.3 12.7 0.030 Maluku 80.6 14.5 4.931 North Maluku 76.9 21.6 1.532 West Papua 82.0 17.6 0.433 Papua 58.4 37.7 3.9<strong>Indonesia</strong>81.7 17.8 0.5Source: National Board of <strong>Health</strong> Research and Development, Ministry of <strong>Health</strong> Republic of <strong>Indonesia</strong>, Riskesdas <strong>2010</strong>
Annex 2.16PERCENTAGE OF HOUSEHOLDS BY NUMBER OF WATER USAGE (PERSON/DAY)BY PROVINCE IN INDONESIA, RISKESDAS <strong>2010</strong>No ProvincesNumber of Water Usage (Liter)< 5 5-19,9 20-49,9 50-99,9 ≥ 100(1) (2) (3) (4) (5) (6) (7)1 Aceh 0.7 10.3 18.8 24.9 45.32 North Sumatera 3.2 18.6 24.7 18.7 34.83 West Sumatera 1.4 9.7 18.1 29.3 41.54 Riau 2.3 6.8 19.8 28.9 42.15 Jambi 1.0 5.6 21.1 41.2 31.06 South Sumatera 4.0 10.8 28.0 34.2 22.97 Bengkulu 1.9 8.6 24.1 34.6 30.78 Lampung 0.4 7.4 21.7 32.6 37.99 Bangka Belitung Islands 3.5 8.9 26.6 33.7 27.310 Riau Islands 0.9 3.3 12.8 40.7 42.211 DKI Jakarta 4.6 15.8 24.0 21.3 34.412 West Java 2.2 8.4 18.5 26.1 44.813 Central Java 1.4 10.0 20.5 29.5 38.614 DI Yogyakarta 0.6 3.1 13.2 31.6 51.515 East Java 3.4 14.1 22.9 23.3 36.416 Banten 2.7 11.8 24.1 23.9 37.417 Bali 0.2 10.3 30.1 34.4 25.018 West Nusa Tenggara 1.4 10.3 20.9 36.2 31.319 East Nusa Tenggara 5.5 36.5 29.5 20.5 7.920 West Kalimantan 3.6 15.5 27.7 26.9 26.321 Central Kalimantan 4.3 7.8 11.9 36.1 39.922 South Kalimantan 2.3 7.6 18.8 40.9 30.423 East Kalimantan 0.3 1.6 14.5 43.7 39.924 North Sulawesi 1.5 11.7 22.3 33.8 30.725 Central Sulawesi 1.3 11.1 26.6 29.2 31.726 South Sulawesi 1.8 15.2 36.4 25.0 21.727 Southeast Sulawesi 0.2 16.7 32.6 28.5 22.028 Gorontalo 3.5 16.5 12.8 30.3 36.929 West Sulawesi 1.0 18.2 21.2 25.3 34.230 Maluku 1.0 10.0 27.5 38.6 22.831 North Maluku 0.3 14.3 44.2 22.5 18.732 West Papua 0.7 14.3 32.4 29.7 22.933 Papua 9.1 23.9 18.8 23.1 25.1<strong>Indonesia</strong>2.4 11.6 22.1 27.3 36.6Source: National Board of <strong>Health</strong> Research and Development, Ministry of <strong>Health</strong> Republic of <strong>Indonesia</strong>, Riskesdas <strong>2010</strong>
Annex 2.17PERCENTAGE OF HOUSEHOLDS WITH TOILET FACILITYBY PROVINCE IN INDONESIA, RISKESDAS <strong>2010</strong>NoProvincesToilet FacilitiesPrivate Shared Public Facilities No Facilities(1) (2) (3) (4) (5) (6)1 Aceh 63.6 5.5 9.9 21.02 North Sumatera 72.0 4.0 5.8 18.23 West Sumatera 57.5 8.2 9.0 25.34 Riau 84.3 6.1 2.4 7.35 Jambi 71.1 8.6 2.2 18.16 South Sumatera 64.3 7.4 4.5 23.87 Bengkulu 74.3 5.0 1.5 19.38 Lampung 79.0 8.2 1.8 11.09 Bangka Belitung Islands 66.3 1.8 3.3 28.710 Riau Islands 80.4 7.6 8.0 4.011 DKI Jakarta 77.0 15.8 6.9 0.312 West Java 73.5 7.8 11.1 7.713 Central Java 72.4 7.1 5.0 15.614 DI Yogyakarta 75.5 17.9 2.1 4.515 East Java 69.0 8.3 3.8 18.816 Banten 67.0 6.8 4.3 21.917 Bali 73.0 12.6 1.5 13.018 West Nusa Tenggara 50.5 10.7 5.7 33.119 East Nusa Tenggara 67.0 8.6 2.8 21.620 West Kalimantan 60.1 4.8 1.8 33.321 Central Kalimantan 49.4 12.8 16.8 21.022 South Kalimantan 64.2 13.5 10.9 11.423 East Kalimantan 74.6 5.8 4.1 15.524 North Sulawesi 73.3 10.3 3.9 12.525 Central Sulawesi 49.7 5.9 5.9 38.626 South Sulawesi 67.7 7.9 5.3 19.127 Southeast Sulawesi 61.7 8.5 6.4 23.428 Gorontalo 32.1 9.2 19.6 39.229 West Sulawesi 49.6 4.1 7.2 39.130 Maluku 52.9 8.1 9.9 29.131 North Maluku 49.6 7.8 24.3 18.432 West Papua 51.2 16.4 20.4 12.033 Papua 60.2 17.1 6.3 16.4<strong>Indonesia</strong>69.7 8.3 6.2 15.8Source: National Board of <strong>Health</strong> Research and Development, Ministry of <strong>Health</strong> Republic of <strong>Indonesia</strong>, Riskesdas <strong>2010</strong>
Annex 2.18PERCENTAGE OF HOUSEHOLDS BY TYPE OF CLOSET FACILITYBY PROVINCE IN INDONESIA, RISKESDAS <strong>2010</strong>No ProvincesType of Closet FacilitySwan Trine Plengsengan' Pit Privy No Facility(1) (2) (3) (4) (5) (6)1 Aceh 80.2 7.6 10.7 1.52 North Sumatera 77.1 7.4 13.3 2.13 West Sumatera 72.2 5.8 17.1 4.94 Riau 64.4 10.8 24.4 0.35 Jambi 71.1 6.5 19.7 2.76 South Sumatera 66.1 4.8 25.9 3.37 Bengkulu 79.5 2.2 16.1 2.28 Lampung 65.0 3.3 30.9 0.89 Bangka Belitung Islands 83.3 15.2 1.0 0.510 Riau Islands 84.4 2.8 12.4 0.411 DKI Jakarta 94.1 3.7 2.1 0.012 West Java 77.4 7.7 12.9 2.013 Central Java 80.5 5.4 12.3 1.914 DI Yogyakarta 88.0 2.3 8.9 0.815 East Java 74.9 6.4 17.3 1.316 Banten 85.3 4.6 8.6 1.517 Bali 94.6 2.4 2.3 0.718 West Nusa Tenggara 76.4 8.6 12.5 2.619 East Nusa Tenggara 45.9 27.0 27.1 0.020 West Kalimantan 74.6 6.1 18.2 1.121 Central Kalimantan 55.7 5.5 30.1 8.722 South Kalimantan 66.8 3.3 23.6 6.323 East Kalimantan 85.6 8.2 5.2 1.024 North Sulawesi 87.3 4.4 7.0 1.225 Central Sulawesi 87.7 2.2 9.8 0.426 South Sulawesi 85.8 5.5 7.8 1.027 Southeast Sulawesi 78.4 5.2 14.9 1.628 Gorontalo 92.6 1.5 1.7 4.229 West Sulawesi 88.6 2.0 8.9 0.630 Maluku 85.5 5.0 8.6 1.031 North Maluku 89.8 2.2 6.0 2.032 West Papua 80.0 5.5 13.9 0.633 Papua 55.5 8.2 34.5 1.9<strong>Indonesia</strong>77.58 6.37 14.32 1.73Source: National Board of <strong>Health</strong> Research and Development, Ministry of <strong>Health</strong> Republic of <strong>Indonesia</strong>, Riskesdas <strong>2010</strong>
Annex 2.19PERCENTAGE OF HOUSEHOLDS BY THE END OF FECES DISPOSALBY PROVINCE IN INDONESIA, RISKESDAS <strong>2010</strong>The End of Feces DisposalNoProvincesSeptic tankWaste WaterDisposalPond/Rice Field River/Lake Hole Beach/Garden Others(1) (2) (3) (4) (5) (6) (7) (8) (9)1 Aceh 62.1 3.2 1.3 14.0 11.7 4.4 3.32 North Sumatera 61.4 3.1 1.7 14.8 10.1 7.0 1.93 West Sumatera 42.4 2.4 14.9 28.7 8.7 1.0 1.94 Riau 59.9 2.1 1.9 9.9 22.8 2.4 1.05 Jambi 54.4 1.5 1.2 26.6 13.6 1.5 1.36 South Sumatera 49.6 1.7 2.4 26.4 16.6 2.2 1.17 Bengkulu 61.2 1.1 0.9 12.7 13.8 8.5 1.88 Lampung 47.7 2.5 4.9 9.4 33.3 1.0 1.29 Bangka Belitung Islands 66.7 2.2 0.2 7.1 2.0 17.1 4.810 Riau Islands 74.1 0.9 0.3 13.9 2.3 5.0 3.611 DKI Jakarta 90.6 2.5 0.5 4.0 0.7 0.4 1.412 West Java 56.7 3.8 12.6 19.2 5.0 1.3 1.513 Central Java 62.4 2.6 4.3 16.5 10.9 1.7 1.614 DI Yogyakarta 76.1 6.8 0.8 5.5 9.9 0.4 0.615 East Java 58.0 2.7 1.3 18.4 16.2 2.6 0.916 Banten 67.0 2.4 5.5 9.1 3.2 11.7 1.117 Bali 73.1 1.9 0.3 6.0 9.8 8.8 0.118 West Nusa Tenggara 51.7 3.0 0.9 23.4 8.4 10.3 2.519 East Nusa Tenggara 34.4 1.6 0.2 0.7 42.5 17.3 3.320 West Kalimantan 43.2 1.2 0.9 27.8 16.0 9.7 1.221 Central Kalimantan 37.7 1.2 1.0 47.0 10.0 2.5 0.722 South Kalimantan 50.1 4.1 0.8 31.8 12.2 0.9 0.323 East Kalimantan 71.7 2.1 0.2 15.5 6.9 3.0 0.724 North Sulawesi 68.6 5.3 0.5 11.3 10.2 2.4 1.625 Central Sulawesi 51.1 1.1 0.1 24.1 8.2 11.8 3.626 South Sulawesi 64.6 2.9 2.5 7.5 12.8 7.4 2.327 Southeast Sulawesi 48.5 5.1 2.4 7.9 22.8 12.2 1.128 Gorontalo 49.6 2.1 0.6 22.2 6.0 17.2 2.429 West Sulawesi 33.3 10.9 0.8 22.7 19.1 11.0 2.230 Maluku 61.5 0.3 0.4 9.3 5.7 20.7 2.231 North Maluku 73.2 1.0 0.2 10.7 2.7 11.5 0.632 West Papua 66.1 2.0 1.1 14.8 3.1 11.0 2.033 Papua 43.1 2.1 1.8 10.5 34.0 7.9 0.7<strong>Indonesia</strong>59.3 2.9 4.3 16.4 11.7 4.0 1.5Source: National Board of <strong>Health</strong> Research and Development, Ministry of <strong>Health</strong> Republic of <strong>Indonesia</strong>, Riskesdas <strong>2010</strong>
Annex 2.20PERCENTAGE OF HOUSEHOLDS BY ACCESS TO PROPER OF WASTE DISPOSAL IN ACCORDANCE MDGsBY PROVINCE IN INDONESIA, RISKESDAS <strong>2010</strong>No Provinces No Access Access(1) (2) (3) (4)1 Aceh 46.2 53.82 North Sumatera 42.7 57.33 West Sumatera 58.5 41.54 Riau 45.7 54.35 Jambi 48.7 51.36 South Sumatera 52.9 47.17 Bengkulu 42.5 57.58 Lampung 53.3 46.79 Bangka Belitung Islands 45.1 54.910 Riau Islands 31.1 68.911 DKI Jakarta 17.3 82.712 West Java 45.7 54.313 Central Java 41.1 58.914 DI Yogyakarta 20.8 79.215 East Java 45.7 54.316 Banten 38.8 61.217 Bali 28.2 71.818 West Nusa Tenggara 57.2 42.819 East Nusa Tenggara 74.8 25.220 West Kalimantan 57.3 42.721 Central Kalimantan 64.1 35.922 South Kalimantan 49.1 50.923 East Kalimantan 34.3 65.724 North Sulawesi 31.9 68.125 Central Sulawesi 54.2 45.826 South Sulawesi 39.2 60.827 Southeast Sulawesi 54.4 45.628 Gorontalo 64.7 35.329 West Sulawesi 64.4 35.630 Maluku 49.0 51.031 North Maluku 49.4 50.632 West Papua 52.0 48.033 Papua 60.9 39.1<strong>Indonesia</strong>44.5 55.5Source: National Board of <strong>Health</strong> Research and Development, Ministry of <strong>Health</strong> Republic of <strong>Indonesia</strong>, Riskesdas <strong>2010</strong>
Annex 2.21PERCENTAGE OF HOUSEHOLDS BY WAY OF DEFECATION IN ACCORDANCE WITH JMP WHO-UNICEF 2008BY PROVINCE IN INDONESIA, RISKESDAS <strong>2010</strong>No Provinces Improved*)Shared**)Unimproved***)Open Defecation****)(1) (2) (3) (4) (5) (6)1 Aceh 49.9 10.7 17.2 22.22 North Sumatera 55.1 4.5 20.5 19.93 West Sumatera 39.8 3.1 28.2 28.94 Riau 51.5 3.3 37.6 7.65 Jambi 48.7 3.2 27.8 20.36 South Sumatera 43.9 3.8 25.9 26.37 Bengkulu 54.2 4.1 20.6 21.08 Lampung 42.1 5.6 40.6 11.79 Bangka Belitung Islands 53.8 4.1 13.0 29.010 Riau Islands 64.9 7.2 23.5 4.411 DKI Jakarta 69.8 18.4 11.5 0.312 West Java 51.5 4.4 34.6 9.513 Central Java 54.6 6.3 21.9 17.214 DI Yogyakarta 63.5 17.3 14.0 5.215 East Java 50.4 5.6 24.1 19.916 Banten 57.0 6.0 14.0 23.117 Bali 62.1 10.9 13.4 13.518 West Nusa Tenggara 36.0 10.1 19.0 34.819 East Nusa Tenggara 22.4 3.4 52.7 21.620 West Kalimantan 41.5 1.4 23.1 34.021 Central Kalimantan 30.0 7.1 35.0 27.822 South Kalimantan 46.8 6.1 30.0 17.023 East Kalimantan 61.3 6.8 15.6 16.324 North Sulawesi 60.2 10.3 15.9 13.625 Central Sulawesi 40.8 10.3 10.1 38.826 South Sulawesi 54.5 10.3 15.4 19.927 Southeast Sulawesi 40.6 10.5 24.4 24.628 Gorontalo 27.6 23.1 7.6 41.729 West Sulawesi 32.9 8.3 19.4 39.530 Maluku 45.5 12.5 12.2 29.831 North Maluku 43.5 29.8 6.7 20.032 West Papua 38.4 26.6 22.4 12.633 Papua 35.6 5.2 41.4 17.9<strong>Indonesia</strong>51.1 6.7 25.0 17.2Source: National Board of <strong>Health</strong> Research and Development, Ministry of <strong>Health</strong> Republic of <strong>Indonesia</strong>, Riskesdas <strong>2010</strong>
Annex 2.22PERCENTAGE OF HOUSEHOLDS BY HEALTHY HOUSES CRITERIABY PROVINCE IN INDONESIA, RISKESDAS <strong>2010</strong>NoProvincesNumber of Examinated Houses<strong>Health</strong>y Houses CriteriaNumber of <strong>Health</strong>y Houses(1) (2) (3) (4)1 Aceh 70.3 29.82 North Sumatera 62.7 37.43 West Sumatera 74.0 26.04 Riau 58.9 41.15 Jambi 77.8 22.26 South Sumatera 71.4 28.67 Bengkulu 68.3 31.78 Lampung 85.9 14.19 Bangka Belitung Islands 65.5 34.510 Riau Islands 57.3 42.711 DKI Jakarta 66.8 33.212 West Java 75.6 24.413 Central Java 81.3 18.814 DI Yogyakarta 73.0 27.015 East Java 75.4 24.616 Banten 77.6 22.417 Bali 67.4 32.618 West Nusa Tenggara 82.9 17.119 East Nusa Tenggara 92.5 7.520 West Kalimantan 71.9 28.121 Central Kalimantan 76.5 23.522 South Kalimantan 71.9 28.123 East Kalimantan 56.4 43.624 North Sulawesi 64.0 36.025 Central Sulawesi 83.8 16.226 South Sulawesi 82.5 17.627 Southeast Sulawesi 80.8 19.228 Gorontalo 74.2 25.829 West Sulawesi 82.1 17.930 Maluku 83.3 16.731 North Maluku 78.3 21.732 West Papua 66.2 33.833 Papua 76.0 24.0<strong>Indonesia</strong>75.1 24.9Source: National Board of <strong>Health</strong> Research and Development, Ministry of <strong>Health</strong> Republic of <strong>Indonesia</strong>, Riskesdas <strong>2010</strong>
Annex 2.23PREVALENCE OF POPULATION 15 YEARS OF AGE AND OVER, SMOKING AND NOT SMOKINGBY PROVINCE IN INDONESIA, RISKESDAS <strong>2010</strong>NoProvincesSmokingEvery Day Sometimes Ex Smokers Non Smokers(1) (2) (3) (4) (5) (6)1 Aceh 31.9 5.2 3.5 59.42 North Sumatera 30.0 6.0 3.4 60.93 West Sumatera 33.1 5.3 7.0 54.64 Riau 30.3 6.0 4.1 59.65 Jambi 32.7 5.4 5.5 56.46 South Sumatera 29.9 6.6 3.3 60.27 Bengkulu 33.0 4.8 3.6 58.78 Lampung 31.4 6.6 4.0 57.99 Bangka Belitung Islands 31.2 4.1 6.0 58.810 Riau Islands 33.4 5.5 8.2 52.811 DKI Jakarta 23.9 6.9 8.2 61.012 West Java 30.9 6.8 5.9 56.413 Central Java 25.3 7.3 5.2 62.214 DI Yogyakarta 25.3 6.3 10.4 58.115 East Java 25.1 6.3 4.4 64.216 Banten 29.6 6.7 7.1 56.717 Bali 25.1 5.9 4.8 64.218 West Nusa Tenggara 30.5 5.0 3.2 61.319 East Nusa Tenggara 33.0 8.2 3.0 55.820 West Kalimantan 29.3 5.0 5.0 60.721 Central Kalimantan 36.0 7.1 5.7 51.122 South Kalimantan 25.3 5.2 6.9 62.523 East Kalimantan 28.4 6.4 7.8 57.024 North Sulawesi 29.1 7.1 10.3 53.525 Central Sulawesi 30.7 7.5 5.8 56.026 South Sulawesi 26.1 5.5 7.0 61.427 Southeast Sulawesi 22.0 6.3 3.3 68.428 Gorontalo 32.7 6.0 5.4 55.929 West Sulawesi 27.6 8.0 5.3 59.130 Maluku 26.2 10.5 3.9 59.431 North Maluku 31.8 8.9 5.6 53.632 West Papua 28.9 9.6 3.5 58.033 Papua 28.4 8.7 5.5 57.3<strong>Indonesia</strong>28.2 6.5 5.4 59.9Source: National Board of <strong>Health</strong> Research and Development, Ministry of <strong>Health</strong> Republic of <strong>Indonesia</strong>, Riskesdas <strong>2010</strong>No Smoking
Annex 2.24PREVALENCE OF SMOKERS 15 YEARS OF AGE AND OVER BY FIRST SMOKING OR CHEWING TOBACCOBY PROVINCE , RISKESDAS <strong>2010</strong>First Smoking or Chewing Tobacco (Years)NoProvinces5-9 10-14 15-19 20-24 25-29 ≥30(1) (2) (3) (4) (5) (6) (7) (8)1 Aceh 1.3 20.6 43.8 13.0 3.5 3.52 North Sumatera 0.8 15.5 43.1 11.0 2.8 4.43 West Sumatera 3.8 27.7 42.1 11.9 3.1 4.04 Riau 0.8 14.2 49.5 13.4 3.7 2.65 Jambi 0.9 18.8 41.6 14.8 4.7 2.56 South Sumatera 1.9 18.1 47.7 13.8 2.9 2.07 Bengkulu 1.3 22.4 40.5 13.0 2.5 2.28 Lampung 1.7 20.4 43.8 9.8 3.7 2.49 Bangka Belitung Islands 5.1 22.3 47.1 14.5 3.3 2.810 Riau Islands 2.0 19.8 47.2 17.5 4.1 3.911 DKI Jakarta 2.2 21.4 46.7 15.3 4.8 3.112 West Java 1.2 15.3 44.6 16.2 4.6 4.913 Central Java 1.8 16.8 41.9 15.1 5.2 4.214 DI Yogyakarta 4.4 19.5 38.7 15.3 5.6 6.215 East Java 2.2 17.4 41.8 16.1 5.3 3.716 Banten 1.6 19.2 46.7 12.6 3.1 2.317 Bali 0.5 10.3 40.8 16.8 4.7 8.318 West Nusa Tenggara 1.8 19.4 48.2 12.5 3.1 3.019 East Nusa Tenggara 0.9 12.6 35.5 15.8 5.3 4.720 West Kalimantan 1.3 15.2 44.6 12.5 3.8 3.221 Central Kalimantan 1.8 17.5 42.0 16.2 4.6 5.522 South Kalimantan 2.7 20.6 43.6 15.3 4.4 4.623 East Kalimantan 2.1 22.7 42.5 16.6 4.4 3.424 North Sulawesi 1.1 16.6 44.7 15.0 3.1 3.225 Central Sulawesi 1.6 17.4 41.5 12.6 3.5 2.726 South Sulawesi 2.1 21.7 41.1 13.4 3.9 3.427 Southeast Sulawesi 1.3 12.0 36.7 10.7 2.9 2.528 Gorontalo 2.4 19.4 43.2 11.8 3.6 4.629 West Sulawesi 1.3 13.0 32.9 10.9 2.8 3.930 Maluku 1.3 13.7 45.0 12.3 5.2 3.631 North Maluku 1.1 16.0 51.9 16.0 5.0 4.832 West Papua 1.5 15.8 40.2 13.6 4.4 3.633 Papua 1.4 18.0 31.3 11.0 3.3 3.6<strong>Indonesia</strong>1.7 17.5 43.3 14.6 4.3 3.9Source: National Board of <strong>Health</strong> Research and Development, Ministry of <strong>Health</strong> Republic of <strong>Indonesia</strong>, Riskesdas <strong>2010</strong>
Annex 2.25PERCENTAGE OF HOUSEHOLDS BY WASTE HANDLING CRITERIABY PROVINCE IN INDONESIA, RISKESDAS <strong>2010</strong>NoProvincesPoorWaste Handling CriteriaGood(1) (2) (3) (4)1 Aceh 82.4 17.62 North Sumatera 78.7 21.33 West Sumatera 83.1 16.94 Riau 79.8 20.25 Jambi 80.0 20.06 South Sumatera 80.3 19.77 Bengkulu 76.3 23.78 Lampung 86.8 13.29 Bangka Belitung Islands 87.8 12.210 Riau Islands 51.9 48.111 DKI Jakarta 15.7 84.312 West Java 67.3 32.713 Central Java 74.4 25.614 DI Yogyakarta 55.7 44.315 East Java 71.7 28.316 Banten 66.5 33.517 Bali 59.4 40.618 West Nusa Tenggara 81.0 19.019 East Nusa Tenggara 88.3 11.720 West Kalimantan 89.5 10.521 Central Kalimantan 82.3 17.722 South Kalimantan 76.3 23.723 East Kalimantan 52.8 47.224 North Sulawesi 73.1 26.925 Central Sulawesi 87.1 12.926 South Sulawesi 75.4 24.627 Southeast Sulawesi 79.5 20.528 Gorontalo 94.0 6.029 West Sulawesi 84.8 15.230 Maluku 73.6 26.431 North Maluku 86.3 13.732 West Papua 76.3 23.733 Papua 84.9 15.1<strong>Indonesia</strong>Source: National Board of <strong>Health</strong> Research and Development, Ministry of <strong>Health</strong> Republic of <strong>Indonesia</strong>, Riskesdas <strong>2010</strong>71.3 28.7
Annex 2.26PERCENTAGE OF WOMEN AGED 10-59 YEARS BY AGE IN FIRST MARRIAGEBY PROVINCE IN INDONESIA, RISKESDAS <strong>2010</strong>Women's Age in First Marriage (%)NoProvincesNot Answered/ AverageAge 10-14 Age 15-19 Age 20-24 Age 25-29 Age 30-34 Age 35 +Forget (Years Old)(1) (2) (3) (4) (5) (6) (7) (8) (9) (10)1 Aceh 2.3 36.9 35.6 15.1 2.5 1.2 6.4 20.72 North Sumatera 1.4 28.5 44.2 17.0 2.7 0.9 5.3 21.53 West Sumatera 2.1 34.1 43.0 16.3 3.0 0.6 0.9 21.04 Riau 2.9 36.4 40.3 13.8 1.6 0.7 4.4 20.55 Jambi 6.3 44.6 31.1 10.7 1.1 0.8 5.5 19.46 South Sumatera 4.8 43.7 33.9 9.5 1.9 0.9 5.2 19.87 Bengkulu 6.3 45.9 33.0 9.7 1.3 0.4 3.3 19.38 Lampung 3.2 44.3 36.1 10.6 0.9 0.3 4.6 19.69 Bangka Belitung Islands 2.8 47.9 35.3 9.4 0.9 1.3 2.4 20.010 Riau Islands 2.6 29.9 40.1 20.1 3.2 0.9 3.2 22.211 DKI Jakarta 3.2 29.3 39.5 21.8 3.9 0.9 1.3 21.712 West Java 7.5 50.2 29.1 8.3 1.1 0.3 3.6 19.213 Central Java 4.4 43.6 34.5 10.5 2.0 0.7 4.4 20.014 DI Yogyakarta 1.6 29.6 42.8 18.4 4.0 1.3 2.3 21.915 East Java 6.1 44.5 31.9 9.2 1.6 0.4 6.2 19.616 Banten 6.5 45.7 29.9 8.8 1.2 0.2 7.7 19.617 Bali 0.6 30.6 39.6 17.0 2.6 0.4 9.0 21.518 West Nusa Tenggara 2.3 41.6 35.2 10.2 2.1 1.0 7.7 20.119 East Nusa Tenggara 0.9 23.6 35.3 20.0 5.0 1.2 14.1 22.320 West Kalimantan 3.6 44.2 34.0 7.4 1.1 1.0 8.8 19.621 Central Kalimantan 7.0 52.1 27.3 9.6 1.0 0.6 2.3 19.022 South Kalimantan 9.0 48.4 28.4 7.9 1.5 0.9 4.0 19.023 East Kalimantan 7.1 42.4 31.9 11.9 1.6 0.4 4.7 19.824 North Sulawesi 0.9 33.8 42.2 15.6 3.9 0.7 2.8 21.425 Central Sulawesi 4.1 46.3 27.0 11.4 1.6 0.4 9.2 19.626 South Sulawesi 4.3 38.0 30.3 13.3 3.1 1.7 9.3 20.527 Southeast Sulawesi 3.4 43.5 25.3 9.9 1.2 0.5 16.1 19.628 Gorontalo 2.6 39.7 36.1 12.8 1.5 1.7 5.6 20.329 West Sulawesi 4.3 36.0 23.6 11.3 1.9 0.2 22.8 19.830 Maluku 2.4 28.3 39.3 18.4 2.8 1.6 7.2 21.631 North Maluku 3.1 43.0 31.9 13.2 2.3 0.4 6.1 20.032 West Papua 2.5 26.5 36.1 12.3 2.1 0.4 20.0 20.933 Papua 4.6 35.0 25.3 12.0 1.5 0.7 21.0 19.9<strong>Indonesia</strong>4.8 41.9 33.6 11.5 1.9 0.6 5.7 20.0Source: National Board of <strong>Health</strong> Research and Development, Ministry of <strong>Health</strong> Republic of <strong>Indonesia</strong>, Riskesdas <strong>2010</strong>
Annex 2.27PERCENTAGE OF MARRIAGE WOMEN AGE 10 - 59 YEARSBY NUMBER OF CHILDREN BIRTH AND PROVINCE IN INDONESIA, RISKESDAS <strong>2010</strong>No ProvincesNot yet/Do Not Have Children1-2 Children 3-4 Children5-6 Children 7 + Children(1) (2) (3) (4) (5) (6) (7)1 Aceh 2.6 46.4 32.6 13.0 5.52 North Sumatera 2.7 39.9 36.1 14.7 6.63 West Sumatera 2.5 41.5 35.5 14.9 5.64 Riau 1.4 50.4 34.1 9.9 4.25 Jambi 2.1 52.2 31.8 10.0 3.86 South Sumatera 2.2 52.3 32.9 8.8 3.87 Bengkulu 2.5 51.4 31.3 11.9 2.88 Lampung 2.2 54.4 31.5 8.6 3.29 Bangka Belitung Islands 2.1 57.8 26.9 8.9 4.310 Riau Islands 2.5 61.0 28.8 6.1 1.711 DKI Jakarta 2.3 59.9 29.0 6.2 2.612 West Java 2.2 56.4 29.9 8.1 3.313 Central Java 2.2 59.1 29.7 6.7 2.314 DI Yogyakarta 2.6 67.7 25.9 3.3 0.515 East Java 1.5 68.1 25.1 4.2 1.116 Banten 2.5 52.1 28.3 10.4 6.717 Bali 1.6 62.5 30.0 4.8 1.018 West Nusa Tenggara 2.5 53.6 28.9 10.8 4.319 East Nusa Tenggara 2.2 35.6 34.9 20.4 6.920 West Kalimantan 2.0 55.3 31.1 8.6 3.021 Central Kalimantan 2.0 55.8 28.5 10.2 3.422 South Kalimantan 3.7 55.6 26.5 9.3 4.923 East Kalimantan 2.5 56.9 30.3 7.7 2.624 North Sulawesi 2.6 65.8 26.4 4.3 0.925 Central Sulawesi 3.3 45.7 34.4 12.2 4.426 South Sulawesi 3.2 42.8 33.9 13.8 6.227 Southeast Sulawesi 1.8 44.8 36.2 12.5 4.728 Gorontalo 3.7 50.7 32.4 9.5 3.629 West Sulawesi 1.5 45.8 32.4 15.8 4.430 Maluku 2.3 44.0 32.1 14.3 7.331 North Maluku 2.8 41.4 35.4 13.8 6.732 West Papua 2.8 47.7 29.0 13.1 7.533 Papua 2.7 50.0 29.2 12.4 5.6<strong>Indonesia</strong>2.2 56.1 29.9 8.4 3.4Source: National Board of <strong>Health</strong> Research and Development, Ministry of <strong>Health</strong> Republic of <strong>Indonesia</strong>, Riskesdas <strong>2010</strong>
Annex 3.1ESTIMATION OF INFANT MORTALITY RATE, UNDERFIVE MORTALITY RATE (UMR) IN 2007AND LIFE EXPECTANCY RATE IN 2009 BY PROVINCEE s t i m a t i o nNoProvinces*Infant Mortality Rate *Underfive Mortality Rate Life Expectancy Rate(1) (2)(IMR)(3)(UMR)(4)2009(5)1 Aceh 25 45 68.602 North Sumatera 46 67 69.353 West Sumatera 47 62 69.254 Riau 37 47 71.255 Jambi 39 47 68.956 South Sumatera 42 52 69.407 Bengkulu 46 65 69.658 Lampung 43 55 69.259 Bangka Belitung Islands 39 46 68.7510 Riau Islands 43 58 69.7511 DKI Jakarta 28 36 73.0512 West Java 39 49 68.0013 Central Java 26 32 71.2514 DI Yogyakarta 19 22 73.1615 East Java 35 45 69.3516 Banten 46 58 64.7517 Bali 34 38 70.6718 West Nusa Tenggara 72 92 61.8019 East Nusa Tenggara 57 80 67.2520 West Kalimantan 46 59 66.4521 Central Kalimantan 30 34 71.1022 South Kalimantan 58 75 63.4523 East Kalimantan 26 38 71.0024 North Sulawesi 35 43 72.1225 Central Sulawesi 60 69 66.3526 South Sulawesi 41 53 69.8027 Southeast Sulawesi 41 62 67.6028 Gorontalo 52 69 66.5029 West Sulawesi 74 96 67.6030 Maluku 59 93 67.2031 North Maluku 51 74 65.7032 West Papua 41 62 68.2033 Papua 36 64 68.35<strong>Indonesia</strong>34 44 69.21Source: <strong>Indonesia</strong> Demography <strong>Health</strong> Survey 2007, Statistics <strong>Indonesia</strong>,* : Five years period before surveyLife Expectancy Rate :Statistics <strong>Indonesia</strong>-Statistic <strong>Indonesia</strong>, Human Development Index 2009
Annex 3.220082009ReductionNo.ProvincesLife ExpectancyAverage ofReal ExpenditureLife ExpectancyAverage ofReal Expenditureof ShortRateSchool Duration Literacy Rate (%) HDI Rank/ Capita (Rp.000)RateSchool Duration Literacy Rate (%) HDI Rank/ Capita (Rp.000)Fall(Year)(Year)(1) (2) (3) (4) (5) (6) (7) (8) (9) (10) (11) (12) (13) (14) (15)1 Aceh 68.50 8,50 96,20 605,56 70,76 17 68.60 8.63 96.39 610.27 71.31 17 1.902 North Sumatera 69.20 8,60 97,08 629,97 73,29 8 69.35 8.65 97.15 634.73 73.80 8 1.893 West Sumatera 69.00 8,26 96,66 631,52 72,96 9 69.25 8.45 96.81 633.72 73.44 9 1.784 Riau 71.10 8,51 97,81 638,31 75,09 3 71.25 8.56 98.11 642.55 75.60 3 2.065 Jambi 68.80 7,63 96,05 628,25 71,99 13 68.95 7.68 96.06 632.60 72.45 13 1.646 South Sumatera 69.20 7,60 97,05 623,49 72,05 12 69.40 7.66 97.21 628.30 72.61 10 2.017 Bengkulu 69.40 8,00 94,87 625,66 72,14 11 69.65 8.23 94.90 626.82 72.55 12 1.468 Lampung 69.00 7,30 93,63 615,03 70,30 20 69.25 7.49 94.37 617.42 70.93 21 2.129 Bangka Belitung Islands 68.60 7,37 95,57 636,07 72,19 10 68.75 7.41 95.63 639.10 72.55 11 1.3010 Riau Islands 69.70 8,94 96,00 637,67 74,18 6 69.75 8.96 96.08 641.63 74.54 6 1.4211 DKI Jakarta 72.90 10,80 98,76 625,70 77,03 1 73.05 10.90 98.94 627.46 77.36 1 1.4512 West Java 67.80 7,50 95,53 626,81 71,12 15 68.00 7.72 95.98 628.71 71.64 15 1.8013 Central Java 71.10 6,86 89,24 633,59 71,60 14 71.25 7.07 89.46 636.39 72.10 14 1.7714 DI Yogyakarta 73.11 8,71 89,46 643,25 74,88 4 73.16 8.78 90.18 644.67 75.23 4 1.3915 East Java 69.10 6,95 87,43 636,61 70,38 18 69.35 7.20 87.80 640.12 71.06 18 2.2916 Banten 64.60 8,10 95,60 625,52 69,70 23 64.75 8.15 95.95 627.63 70.06 23 1.1917 Bali 70.61 7,81 86,94 626,63 70,98 16 70.67 7.83 87.22 632.15 71.52 16 1.8418 West Nusa Tenggara 61.50 6,70 80,13 633,58 64,12 32 61.80 6.73 80.18 637.98 64.66 32 1.5019 East Nusa Tenggara 67.00 6,55 87,66 599,93 66,15 31 67.25 6.60 87.96 602.60 66.60 31 1.3220 West Kalimantan 66.30 6,70 89,40 624,74 68,17 29 66.45 6.75 89.70 630.34 68.79 28 1.9421 Central Kalimantan 71.00 8,00 97,67 628,64 73,88 7 71.10 8.02 97.69 633.91 74.36 7 1.8422 South Kalimantan 63.10 7,44 95,30 630,83 68,72 26 63.45 7.54 95.41 634.59 69.30 26 1.8623 East Kalimantan 70.80 8,80 96,36 634,52 74,52 5 71.00 8.85 96.89 638.73 75.11 5 2.3224 North Sulawesi 72.01 8,80 99,31 625,58 75,16 2 72.12 8.82 99.41 631.00 75.68 2 2.0725 Central Sulawesi 66.10 7,81 95,68 622,35 70,09 22 66.35 7.89 95.78 627.40 70.70 22 2.0426 South Sulawesi 69.60 7,23 86,53 630,81 70,22 21 69.80 7.41 87.02 635.48 70.94 20 2.3927 Southeast Sulawesi 67.40 7,74 91,42 611,72 69,00 25 67.60 7.90 91.51 615.29 69.52 25 1.6928 Gorontalo 66.20 6,91 95,75 619,70 69,29 24 66.50 7.18 95.77 621.31 69.79 24 1.6229 West Sulawesi 67.40 6,99 87,31 625,04 68,55 27 67.60 7.05 87.59 630.32 69.18 27 1.9930 Maluku 67.00 8,60 98,12 605,02 70,38 18 67.20 8.63 98.13 610.73 70.96 19 1.9431 North Maluku 65.40 8,60 95,44 595,69 68,18 28 65.70 8.61 95.74 598.45 68.63 29 1.4332 West Papua 67.90 7,67 92,15 593,13 67,95 30 68.20 8.01 92.34 595.28 68.58 30 1.9533 Papua 68.10 6,52 75,41 599,65 64,00 33 68.35 6.57 75.58 603.88 64.53 33 1.49<strong>Indonesia</strong>69.00 7,52 92,19 628,33 71,17 69.21 7.72 92.58 631.46 71.76 2.06Source : Human Development Index 2008-2009, BPS-Statistics <strong>Indonesia</strong>Note : Reduction of Short Fall is an escalation of human development to achieve proper HDIHUMAN DEVELOPMENT INDEX AND COMPONENT BY PROVINCE, 2008- 2009
Annex 3.310 MAIN DISEASES OF HOSPITAL INPATIENTS IN <strong>2010</strong>NoCause of Diseases Based on BasicTabulation ListCasesCases ProportionMales Females Males (%) Females (%)ReleasedPatientDeathsCFR (%)(1) (2) (3) (4) (5) (6) (7) (8) (9)1Diarrhea & gastroenteritis caused by certaininfection (colitic infection)37,281 34,608 51.86 48.14 71,889 1,289 1.792 Dengue Haemorrhagic Fever 30,232 28,883 51.14 48.86 59,115 325 0.553 Typhoid Fever and Paratyphoid 19,706 21,375 47.97 52.03 41,081 274 0.674 Obstacle of pregnancy and delivery 0 40,636 0.00 100.00 40,636 276 0.685 Dispeptia 9,594 15,122 38.82 61.18 24,716 166 0.676 Other injuries and multiple area 14,405 7,328 66.28 33.72 21,733 605 2.787 Essential Hypertention (primary) 8,423 11,451 42.38 57.62 19,874 955 4.818 Intracranial Injury 12,010 7,371 61.97 38.03 19,381 1,025 5.299 Other upper acute respiratory infections 9,737 8,181 54.34 45.66 17,918 589 3.2910 Pneumonie 9,340 7,971 53.95 46.05 17,311 1,315 7.60Source: DG of <strong>Health</strong> Effort , MoH RI, 2011
Annex 3.410 MAIN DISEASES OF HOSPITAL OUTPATIENTS IN <strong>2010</strong>NoCause of Diseases Based on BasicTabulation ListMalesCasesFemalesNew CasesVisits(1) (2) (3) (4) (5) (6)1 Other upper acute respiratory infections 147,410 143,946 291,356 433,3542 Other injuries and multiple area 77,337 49,739 127,076 168,7683 Disease of skin and other subcutaneous 48,576 73,500 122,076 192,4144 Refraction and acomodation disorder 42,349 69,164 111,513 143,4045Diarrhea & gastroenteritis caused by certaininfection (colitic infection)53,389 51,890 105,279 141,5566 Dispeptia 34,981 53,618 88,599 163,4287 Disease of pulp and periapical 39,427 46,994 86,421 163,2118 Essential hypertention (primary) 35,462 45,153 80,615 277,8469 Conjungtivitis and other conjungtiva disorders 30,250 37,776 68,026 87,51310 Disease of ear and prosesus mastoid 30,583 30,855 61,438 99,663Source: DG of <strong>Health</strong> Effort , MoH RI, 2011
Annex 3.5PREVALENCE OF UNDERFIVE NUTRITIONAL STATUS BASED ON WEIGHT PER AGEBY PROVINCE IN <strong>2010</strong>Nutritional Status by Weight per AgeNo.ProvincesSevere MalNutrition (%)Under Weight (%) Normal (%) Over Weight (%) Total (%)(1) (2) (3) (4) (5) (6) (7)1 Aceh 7.1 16.6 72.1 4.2 1002 North Sumatera 7.8 13.5 71.1 7.5 1003 West Sumatera 2.8 14.4 81.3 1.6 1004 Riau 4.8 11.4 75.2 8.6 1005 Jambi 5.4 14.3 76.3 4.1 1006 South Sumatera 5.5 14.4 74.5 5.6 1007 Bengkulu 4.3 11.0 73.7 10.9 1008 Lampung 3.5 10.0 79.8 6.8 1009 Bangka Belitung Islands 3.2 11.7 80.6 4.5 10010 Riau Islands 4.3 9.8 81.3 4.6 10011 DKI Jakarta 2.6 8.7 77.7 11.1 10012 West Java 3.1 9.9 81.6 5.4 10013 Central Java 3.3 12.4 78.1 6.2 10014 DI Yogyakarta 1.4 9.9 81.5 7.3 10015 East Java 4.8 12.3 75.3 7.6 10016 Banten 4.8 13.7 77.5 4.0 10017 Bali 1.7 9.2 81.0 8.0 10018 West Nusa Tenggara 10.6 19.9 66.9 2.6 10019 East Nusa Tenggara 9.0 20.4 67.5 3.1 10020 West Kalimantan 9.5 19.7 67.0 3.9 10021 Central Kalimantan 5.3 22.3 69.4 2.9 10022 South Kalimantan 6.0 16.8 73.1 4.0 10023 East Kalimantan 4.4 12.7 75.9 7.0 10024 North Sulawesi 3.8 6.8 84.3 5.1 10025 Central Sulawesi 7.9 18.6 69.1 4.4 10026 South Sulawesi 6.4 18.6 72.2 2.8 10027 Southeast Sulawesi 6.5 16.3 66.9 10.2 10028 Gorontalo 11.2 15.3 69.4 4.1 10029 West Sulawesi 7.6 12.9 74.9 4.7 10030 Maluku 8.4 17.8 70.5 3.4 10031 North Maluku 5.7 17.9 73.2 3.2 10032 West Papua 9.1 17.4 67.3 6.2 10033 Papua 6.3 10.0 78.4 5.3 100<strong>Indonesia</strong>4.9 13.0 76.2 5.8 100Source: Riskesdas <strong>2010</strong>, National Institute for <strong>Health</strong> Research and Development, MoH RI
Annex 3.6PREVALENCE OF UNDERFIVE NUTRITIONAL STATUS BASED ON HEIGHT PER AGEBY PROVINCE IN <strong>2010</strong>Nutritional Status by Height per AgeNo.ProvincesSevere Stunted(%)Stunted (%) Normal (%) Total (%)(1) (2) (3) (4) (5) (6)1 Aceh 24.2 14.8 61.1 1002 North Sumatera 23.4 18.9 57.7 1003 West Sumatera 14.3 18.4 67.2 1004 Riau 19.6 12.5 67.8 1005 Jambi 15.4 14.8 69.8 1006 South Sumatera 23.1 17.3 59.6 1007 Bengkulu 18.3 13.3 68.4 1008 Lampung 20.6 15.6 63.7 1009 Bangka Belitung Islands 12.5 16.6 71.0 10010 Riau Islands 11.4 15.5 73.1 10011 DKI Jakarta 14.3 12.3 73.4 10012 West Java 16.6 17.1 66.4 10013 Central Java 16.9 17.0 66.1 10014 DI Yogyakarta 10.2 12.3 77.5 10015 East Java 20.9 14.9 64.1 10016 Banten 16.5 17.0 66.5 10017 Bali 14.0 15.3 70.7 10018 West Nusa Tenggara 27.8 20.5 51.8 10019 East Nusa Tenggara 30.9 27.5 41.6 10020 West Kalimantan 20.7 19.0 60.3 10021 Central Kalimantan 18.0 21.6 60.4 10022 South Kalimantan 15.9 19.4 64.7 10023 East Kalimantan 14.4 14.7 70.9 10024 North Sulawesi 12.7 15.1 72.2 10025 Central Sulawesi 16.0 20.1 63.8 10026 South Sulawesi 15.8 23.1 61.1 10027 Southeast Sulawesi 20.8 17.0 62.2 10028 Gorontalo 21.6 18.7 59.7 10029 West Sulawesi 21.6 20.0 58.4 10030 Maluku 16.5 21.0 62.5 10031 North Maluku 14.4 15.0 70.6 10032 West Papua 28.6 20.6 50.8 10033 Papua 13.3 15.0 71.7 100<strong>Indonesia</strong>18.5 17.1 64.4 100Source: Riskesdas <strong>2010</strong>, National Institute for <strong>Health</strong> Research and Development, MoH RI
Annex 3.7PREVALENCE OF UNDERFIVE NUTRITIONAL STATUS BASED ON WEIGHT PER HEIGHTBY PROVINCE IN <strong>2010</strong>Nutritional Status by Weight per HeightNo.ProvincesSevere Wasted(%)Wasted (%) Normal (%) Obese (%) Total (%)(1) (2) (3) (4) (5) (6) (7)1 Aceh 6.3 7.9 69.6 16.2 1002 North Sumatera 5.6 8.4 67.6 18.3 1003 West Sumatera 4.0 4.2 83.5 8.3 1004 Riau 9.2 8.0 66.8 16.0 1005 Jambi 11.3 8.7 70.4 9.6 1006 South Sumatera 7.3 7.3 68.7 16.8 1007 Bengkulu 9.7 8.1 66.7 15.5 1008 Lampung 5.4 8.5 69.6 16.4 1009 Bangka Belitung Islands 1.7 5.8 82.8 9.6 10010 Riau Islands 2.0 6.0 81.4 10.6 10011 DKI Jakarta 4.4 6.9 69.1 19.6 10012 West Java 4.6 6.4 74.4 14.6 10013 Central Java 6.4 7.8 71.8 14.0 10014 DI Yogyakarta 2.6 6.5 77.3 13.6 10015 East Java 7.3 6.8 68.8 17.1 10016 Banten 6.2 7.9 74.2 11.7 10017 Bali 5.2 7.9 69.4 17.5 10018 West Nusa Tenggara 5.9 8.0 73.5 12.5 10019 East Nusa Tenggara 6.8 6.4 74.8 11.9 10020 West Kalimantan 7.6 9.1 72.5 10.8 10021 Central Kalimantan 6.0 9.6 75.4 9.0 10022 South Kalimantan 8.4 7.2 74.6 9.8 10023 East Kalimantan 5.8 7.1 77.6 9.6 10024 North Sulawesi 2.6 6.7 82.3 8.5 10025 Central Sulawesi 8.4 6.4 75.1 10.2 10026 South Sulawesi 4.8 7.2 81.1 6.9 10027 Southeast Sulawesi 6.2 9.6 66.1 18.1 10028 Gorontalo 4.1 7.7 80.4 7.8 10029 West Sulawesi 6.1 10.6 71.5 11.8 10030 Maluku 6.3 6.9 78.5 8.2 10031 North Maluku 6.4 11.3 77.2 5.0 10032 West Papua 6.0 5.5 73.8 14.8 10033 Papua 8.2 5.7 75.5 10.7 100<strong>Indonesia</strong>6.0 7.3 72.8 14.0 100Source: Riskesdas <strong>2010</strong>, National Institute for <strong>Health</strong> Research and Development, MoH RI
Annex 3.8PREVALENCE OF UNDERFIVE NUTRITIONAL STATUS BASED ON HEIGHT PER AGE AND WEIGHT PER HEIGHTBY PROVINCE IN <strong>2010</strong>Nutritional Status by Height per Age and Weight per HeightNo.ProvincesStunted-Wasted Stunted-Normal Stunted-Obese Normal-Wasted Normal-Normal Normal-Obese(%)(%)(%)(%)(%)(%)Total (%)(1) (2) (3) (4) (5) (6) (7) (8) (9)1 Aceh 3.1 26.1 9.2 11.2 47.2 3.2 1002 North Sumatera 3.1 28.3 10.2 11.2 41.4 5.9 1003 West Sumatera 1.2 25.6 5.7 6.9 59.2 1.4 1004 Riau 1.7 20.7 7.7 15.6 46.9 7.3 1005 Jambi 3.1 22.2 4.3 16.8 49.6 4.1 1006 South Sumatera 2.0 27.2 10.3 12.8 43.9 3.8 1007 Bengkulu 1.2 20.8 7.7 16.2 48.1 6.0 1008 Lampung 1.6 24.2 8.7 12.4 47.4 5.7 1009 Bangka Belitung Islands 2.3 22.7 4.2 5.1 61.0 4.9 10010 Riau Islands 2.1 17.9 4.9 6.0 64.3 4.8 10011 DKI Jakarta 0.4 15.8 8.4 10.8 54.5 10.1 10012 West Java 1.4 23.4 8.4 9.4 52.7 4.8 10013 Central Java 1.3 23.9 7.8 12.5 49.4 5.1 10014 DI Yogyakarta 0.4 16.3 5.2 8.8 61.3 8.0 10015 East Java 1.6 24.2 9.7 12.4 46.4 5.7 10016 Banten 2.3 24.9 6.5 11.9 50.6 3.8 10017 Bali 0.9 18.7 8.6 12.6 51.9 7.3 10018 West Nusa Tenggara 5.3 36.4 6.8 9.0 40.1 2.5 10019 East Nusa Tenggara 4.9 44.3 9.7 8.3 31.9 1.0 10020 West Kalimantan 5.3 28.9 4.6 11.9 44.4 5.0 10021 Central Kalimantan 3.9 31.1 4.6 11.7 45.1 3.6 10022 South Kalimantan 2.5 26.6 4.9 12.5 49.3 4.2 10023 East Kalimantan 2.1 22.7 3.2 10.8 55.4 5.7 10024 North Sulawesi 2.2 21.2 3.9 6.8 62.5 3.5 10025 Central Sulawesi 4.3 25.8 5.0 10.4 51.9 2.7 10026 South Sulawesi 2.6 32.8 3.9 9.3 49.2 2.1 10027 Southeast Sulawesi 3.7 25.6 7.2 13.4 44.0 6.1 10028 Gorontalo 4.5 31.5 4.7 7.0 49.6 2.9 10029 West Sulawesi 4.2 29.8 6.3 13.1 42.9 3.6 10030 Maluku 4.0 28.4 5.4 9.4 50.8 2.0 10031 North Maluku 1.9 25.3 2.3 15.8 52.3 2.4 10032 West Papua 2.6 37.1 9.2 8.6 38.5 4.1 10033 Papua 2.3 22.1 4.6 11.4 54.5 5.1 100<strong>Indonesia</strong>2.1 25.3 7.6 11.1 49.1 4.8 100Source: Riskesdas <strong>2010</strong>, National Institute for <strong>Health</strong> Research and Development, MoH RI
Annex 3.9PREVALENCE OF ADULT NUTRITIONAL STATUS (>18 YEARS OF AGE)BASED ON BODY MASS INDEX (BMI) BY PROVINCE IN <strong>2010</strong>Kategori IMTNo.ProvincesOver NutritionWasted (%) Normal (%)(%)Obese (%)(1) (2) (3) (4) (5) (6)1 Aceh 11.1 64.5 10.9 13.42 North Sumatera 8.7 65.9 11.9 13.53 West Sumatera 14.1 64.1 9.4 12.54 Riau 9.2 69.4 11.1 10.35 Jambi 11.6 65.9 11.3 11.26 South Sumatera 14.9 65.9 9.2 10.07 Bengkulu 12.7 68.0 9.3 10.08 Lampung 12.0 70.7 8.5 8.89 Bangka Belitung Islands 10.2 63.4 9.9 16.510 Riau Islands 9.1 60.0 13.2 17.611 DKI Jakarta 9.7 61.8 12.3 16.212 West Java 12.5 64.8 10.0 12.813 Central Java 13.7 67.4 9.3 9.514 DI Yogyakarta 17.5 60.8 9.7 12.115 East Java 12.3 67.1 9.5 11.116 Banten 15.3 63.0 9.5 12.217 Bali 11.0 68.2 10.5 10.418 West Nusa Tenggara 16.1 67.1 8.0 8.819 East Nusa Tenggara 19.7 67.3 6.5 6.520 West Kalimantan 14.7 67.2 8.6 9.521 Central Kalimantan 12.1 68.4 9.2 10.322 South Kalimantan 18.6 60.1 10.5 10.823 East Kalimantan 8.4 62.1 12.1 17.324 North Sulawesi 6.0 56.8 15.2 21.925 Central Sulawesi 10.2 65.7 10.8 13.326 South Sulawesi 14.6 64.7 9.7 11.027 Southeast Sulawesi 10.9 72.8 8.9 7.428 Gorontalo 11.6 60.9 11.3 16.129 West Sulawesi 9.9 69.3 9.8 11.030 Maluku 10.6 64.8 9.5 15.131 North Maluku 10.4 62.4 12.8 14.432 West Papua 10.4 62.1 12.1 15.433 Papua 9.2 66.0 11.0 13.8<strong>Indonesia</strong>12.6 65.8 10.0 11.7Source: Riskesdas <strong>2010</strong>, National Institute for <strong>Health</strong> Research and Development, MoH RI
Annex 3.10NUMBER OF CASES AND MORBIDITY OF MALARIABY PROVINCE IN <strong>2010</strong>No Provinces Population at Risk Clinical CasesBlood SpecimensTestedPositiveAnnual ParasiteIncidence (API)(1) (2) (3) (4) (5) (6) (7)1 Aceh 4,363,475 29,559 30,689 2,354 0.542 North Sumatera 8,872,054 108,895 88,561 5,377 0.613 West Sumatera 2,359,946 998 699 260 0.114 Riau 4,190,975 8,156 7,735 1,005 0.245 Jambi 1,408,470 37,882 21,901 2,309 1.646 South Sumatera 5,350,075 49,444 25,212 2,396 0.457 Bengkulu 1,858,466 51,090 41,582 7,926 4.268 Lampung 6,295,088 25,922 22,960 2,025 0.329 Bangka Belitung Islands 1,106,657 58,382 6,216 5,596 5.0610 Riau Islands 1,244,515 16,078 4,787 1,073 0.8611 DKI Jakarta 200,000 0 0 0 0.0012 West Java 1,092,677 18,452 18,452 466 0.4313 Central Java 21,430,044 74,619 74,619 2,098 0.1014 DI Yogyakarta 3,565,783 - - 36 0.0115 East Java 6,814,535 23,260 20,672 657 0.1016 Banten 3,473,302 955 - 113 0.0317 Bali 1,402,202 10,806 10,806 40 0.0318 West Nusa Tenggara 4,380,548 72,125 75,695 7,919 1.8119 East Nusa Tenggara 4,617,521 436,717 65,075 56,075 12.1420 West Kalimantan 4,130,874 120,298 59,398 1,839 0.4521 Central Kalimantan 2,218,235 26,038 17,468 7,730 3.4822 South Kalimantan 3,394,359 8,718 7,704 2,672 0.7923 East Kalimantan 2,848,793 18,208 8,940 1,352 0.4724 North Sulawesi 2,452,635 31,901 19,835 3,990 1.6325 Central Sulawesi 2,531,777 74,191 36,070 5,271 2.0826 South Sulawesi 3,671,933 22,206 17,353 1,297 0.3527 Southeast Sulawesi 2,299,988 24,232 7,443 1,057 0.4628 Gorontalo 1,037,751 5,899 3,668 1,772 1.7129 West Sulawesi 1,176,149 25,743 7,911 642 0.5530 Maluku 1,576,914 42,762 30,921 8,559 5.4331 North Maluku 1,005,735 32,495 27,972 6,486 6.4532 West Papua 2,127,982 133,334 93,334 38,009 17.8633 Papua 2,851,999 259,634 310,728 51,418 18.03<strong>Indonesia</strong>117,351,457 1,848,999 1,164,406 229,819 1.96Source: DG of Disease Control and Environmental <strong>Health</strong>, MoH RI, 2011
Annex 3.11ANNUAL PARASITE INSIDENCE (API) OF MALARIABY PROVINCE IN 2007-<strong>2010</strong>No.ProvincesAPI2007 2008 2009 <strong>2010</strong>(1) (2) (3) (4) (5) (6)1 Aceh 0.94 0.25 0.48 0.542 North Sumatera NA 0.28 0.25 0.613 West Sumatera 0.03 0.57 0.41 0.114 Riau NA 0.23 0.47 0.245 Jambi 1.21 2.12 1.89 1.646 South Sumatera 0.08 0.54 0.45 0.457 Bengkulu 1.52 4.70 4.36 4.268 Lampung 0.33 0.33 0.78 0.329 Bangka Belitung Islands 15.89 8.09 7.87 5.0610 Riau Islands 1.06 1.34 1.12 0.8611 DKI Jakarta - - - -12 West Java 0.37 0.58 0.36 0.4313 Central Java 0.12 0.07 0.08 0.1014 DI Yogyakarta 0.05 0.00 0.30 0.0115 East Java 0.18 0.71 0.47 0.1016 Banten 0.05 0.03 0.14 0.0317 Bali 0.42 0.17 0.02 0.0318 West Nusa Tenggara 3.47 4.88 1.93 1.8119 East Nusa Tenggara 30.09 20.35 15.62 12.1420 West Kalimantan - 0.65 0.54 0.4521 Central Kalimantan - 2.53 1.38 3.4822 South Kalimantan 0.49 1.04 1.06 0.7923 East Kalimantan 2.90 2.04 0.93 0.4724 North Sulawesi 1.99 3.37 4.57 1.6325 Central Sulawesi 2.01 2.56 1.35 2.0826 South Sulawesi 0.08 0.31 0.47 0.3527 Southeast Sulawesi 0.52 0.28 0.22 0.4628 Gorontalo 0.43 4.13 0.54 1.7129 West Sulawesi 0.48 0.57 0.85 0.5530 Maluku 0.85 8.94 7.37 5.4331 North Maluku 11.25 8.91 8.91 6.4532 West Papua 53.57 46.10 27.66 17.8633 Papua 41.66 18.35 9.94 18.03<strong>Indonesia</strong>2.89 2.47 1.85 1.96Source: DG of Disease Control and Environmental <strong>Health</strong>, MoH RI, 2011
Annex 3.12PERIOD PREVALENCE OF MALARIA IN ONE LAST MONTHBY DIAGNOSIS AND PROVINCE IN <strong>2010</strong>No.ProvincesPeriod PrevalenceD (%) G (%) DG (%)(1) (2) (3) (4) (5)1 Aceh 0.7 11.5 12.12 North Sumatera 0.4 9.6 10.03 West Sumatera 0.3 11.9 12.24 Riau 0.5 6.0 6.55 Jambi 1.2 9.5 10.66 South Sumatera 0.9 8.4 9.27 Bengkulu 1.6 11.6 12.98 Lampung 0.5 9.1 9.69 Bangka Belitung Islands 1.5 17.9 19.010 Riau Islands 1.4 8.2 9.511 DKI Jakarta 0.1 8.3 8.412 West Java 0.1 10.6 10.713 Central Java 0.1 7.6 7.714 DI Yogyakarta 0.0 4.6 4.615 East Java 0.1 7.2 7.316 Banten 0.1 10.5 10.617 Bali 0.1 4.5 4.618 West Nusa Tenggara 1.4 13.0 14.219 East Nusa Tenggara 4.4 22.2 25.320 West Kalimantan 0.9 11.2 12.021 Central Kalimantan 1.4 15.0 16.222 South Kalimantan 0.7 14.0 14.523 East Kalimantan 0.9 8.6 9.324 North Sulawesi 1.9 20.1 21.625 Central Sulawesi 0.9 18.2 18.926 South Sulawesi 0.6 15.1 15.627 Southeast Sulawesi 0.4 6.8 7.128 Gorontalo 0.8 28.0 28.629 West Sulawesi 1.5 12.5 13.830 Maluku 1.4 11.5 12.631 North Maluku 3.6 18.1 20.832 West Papua 10.6 27.3 33.833 Papua 10.1 19.2 25.9Jawa-Bali0.1 8.5 8.6Luar Jawa-Bali1.3 12.3 13.4<strong>Indonesia</strong>0.6 10.0 10.6Source: DG of Disease Control and Environmental <strong>Health</strong>, MoH RI, 2011Note : D= Diagnosis by blood specimen test; G= diagnosis by clinical symptomDG= Diagnosis by blood specimen test and clinical symptom
Annex 3.13Detection CoverageNo Provinces Case EstimationAFB Case Detection RateAll CasesPositive (CDR) %(1) (2) (3) (4) (5) (6)1 Aceh 7,092 4,592 3,670 51.7%2 North Sumatera 21,524 19,673 16,078 74.7%3 West Sumatera 7,828 6,068 4,156 53.1%4 Riau 8,677 4,553 2,996 34.5%5 Jambi 4,608 3,459 3,149 68.3%6 South Sumatera 11,716 8,046 5,705 48.7%7 Bengkulu 2,707 2,083 1,784 65.9%8 Lampung 12,147 7,241 5,139 42.3%9 Bangka Belitung Islands 1,846 1,500 1,130 61.2%10 Riau Islands 2,527 1,621 917 36.3%11 DKI Jakarta 9,946 24,895 7,944 79.9%12 West Java 45,027 61,010 32,649 72.5%13 Central Java 35,411 37,986 19,190 54.2%14 DI Yogyakarta 2,262 2,450 1,193 52.7%15 East Java 40,093 37,511 23,350 58.2%16 Banten 10,662 13,877 8,018 75.2%17 Bali 2,294 2,942 1,449 63.2%18 West Nusa Tenggara 9,457 5,122 3,151 33.3%19 East Nusa Tenggara 9,880 5,507 3,755 38.0%20 West Kalimantan 9,216 5,797 4,634 50.3%21 Central Kalimantan 4,439 2,094 1,323 29.8%22 South Kalimantan 7,445 4,710 3,253 43.7%23 East Kalimantan 6,794 3,848 2,210 32.5%24 North Sulawesi 4,724 4,997 4,546 96.2%25 Central Sulawesi 5,296 2,719 2,307 43.6%26 South Sulawesi 16,822 9,633 7,820 46.5%27 Southeast Sulawesi 4,539 3,445 3,185 70.2%28 Gorontalo 2,091 1,822 1,617 77.3%29 West Sulawesi 2,233 1,361 1,149 51.5%30 Maluku 2,852 3,199 2,175 76.3%31 North Maluku 2,080 1,176 792 38.1%32 West Papua 1,591 1,487 635 39.9%33 Papua 4,491 6,437 2,297 51.1%<strong>Indonesia</strong>Source: DG of Disease Control and Environmental <strong>Health</strong>, MoH RI, 2011CASE DETECTION COVERAGE OF PULMONARY TBBY PROVINCE IN <strong>2010</strong>234,181 302,861 183,366 78.3%
Annex 3.14TB ACID FAST BACIL (AFB) POSITIVE NEW CASESBY SEX AND PROVINCE IN <strong>2010</strong>SexNoProvincesCasesMalesFemales% Cases %Males+Females(1) (2) (3) (4) (5) (6) (7)1 Aceh 2,352 64.1% 1,318 35.9% 3,6702 North Sumatera 10,496 65.3% 5,582 34.7% 16,0783 West Sumatera 2,693 64.8% 1,463 35.2% 4,1564 Riau 1,912 63.8% 1,084 36.2% 2,9965 Jambi 1,966 62.4% 1,183 37.6% 3,1496 South Sumatera 3,508 61.5% 2,197 38.5% 5,7057 Bengkulu 1,096 61.4% 688 38.6% 1,7848 Lampung 3,115 60.6% 2,024 39.4% 5,1399 Bangka Belitung Islands 727 64.3% 403 35.7% 1,13010 Riau Islands 576 62.8% 341 37.2% 91711 DKI Jakarta 4,884 61.5% 3,060 38.5% 7,94412 West Java 18,854 57.7% 13,795 42.3% 32,64913 Central Java 10,789 56.2% 8,401 43.8% 19,19014 DI Yogyakarta 719 60.3% 474 39.7% 1,19315 East Java 13,060 55.9% 10,290 44.1% 23,35016 Banten 4,780 59.6% 3,238 40.4% 8,01817 Bali 836 57.7% 613 42.3% 1,44918 West Nusa Tenggara 1,888 59.9% 1,263 40.1% 3,15119 East Nusa Tenggara 2,074 55.2% 1,681 44.8% 3,75520 West Kalimantan 2,961 63.9% 1,673 36.1% 4,63421 Central Kalimantan 811 61.3% 512 38.7% 1,32322 South Kalimantan 1,979 60.8% 1,274 39.2% 3,25323 East Kalimantan 1,355 61.3% 855 38.7% 2,21024 North Sulawesi 2,821 62.1% 1,725 37.9% 4,54625 Central Sulawesi 1,401 60.7% 906 39.3% 2,30726 South Sulawesi 4,559 58.3% 3,261 41.7% 7,82027 Southeast Sulawesi 1,919 60.3% 1,266 39.7% 3,18528 Gorontalo 916 56.6% 701 43.4% 1,61729 West Sulawesi 681 59.3% 468 40.7% 1,14930 Maluku 1,245 57.2% 930 42.8% 2,17531 North Maluku 495 62.5% 297 37.5% 79232 West Papua 368 58.0% 267 42.0% 63533 Papua 1,330 57.9% 967 42.1% 2,297<strong>Indonesia</strong>109,166 59.5% 74,200 40.5% 183,366Source: DG of Disease Control and Environmental <strong>Health</strong>, MoH RI, 2011
Annex 3.15NoProvinces(1) (2) (3) (4) (5) (6) (7) (8) (9) (10) (11) (12) (13) (14) (15) (16) (17) (18) (19)1 Aceh 24 14 265 207 474 280 434 269 479 236 478 220 198 92 2,352 1,318 3,6702 North Sumatera 77 67 1,360 1,036 2,169 1,302 2,293 1,169 2,375 1,098 1,673 677 549 233 10,496 5,582 16,0783 West Sumatera 13 14 379 287 591 337 460 264 538 236 461 223 251 102 2,693 1,463 4,1564 Riau 9 18 262 200 437 274 377 224 405 191 290 139 132 38 1,912 1,084 2,9965 Jambi 12 14 238 200 390 258 411 239 413 247 336 152 166 73 1,966 1,183 3,1496 South Sumatera 23 23 441 345 759 516 711 463 723 386 577 334 274 130 3,508 2,197 5,7057 Bengkulu 6 17 111 116 248 145 228 141 213 128 202 103 88 38 1,096 688 1,7848 Lampung 26 17 332 321 667 493 628 388 601 362 572 320 289 123 3,115 2,024 5,1399 Bangka Belitung Islands 1 4 94 75 158 101 143 59 147 81 123 59 61 24 727 403 1,13010 Riau Islands 6 5 84 97 176 106 126 52 91 41 63 31 30 9 576 341 91711 DKI Jakarta 27 30 1,001 743 1,525 852 939 633 794 497 461 229 137 76 4,884 3,060 7,94412 West Java 129 140 3,714 3,300 4,815 3,624 3,580 2,674 3,018 2,212 2,522 1,380 1,076 465 18,854 13,795 32,64913 Central Java 60 86 1,608 1,780 2,395 2,016 1,937 1,541 2,067 1,409 1,745 1,138 977 431 10,789 8,401 19,19014 DI Yogyakarta - 4 107 114 141 116 127 82 132 83 114 51 98 24 719 474 1,19315 East Java 70 101 1,566 1,690 2,530 2,303 2,459 2,132 2,783 2,059 2,514 1,518 1,138 487 13,060 10,290 23,35016 Banten 32 24 973 807 1,257 866 959 664 827 522 545 279 187 76 4,780 3,238 8,01817 Bali 5 4 123 123 196 159 157 113 141 92 138 86 76 36 836 613 1,44918 West Nusa Tenggara 10 8 252 200 413 303 339 249 408 259 342 196 124 48 1,888 1,263 3,15119 East Nusa Tenggara 17 34 287 293 458 364 352 297 352 277 363 278 245 138 2,074 1,681 3,75520 West Kalimantan 18 27 317 280 570 364 575 335 628 305 577 268 276 94 2,961 1,673 4,63421 Central Kalimantan 11 10 84 90 177 124 186 112 193 100 112 54 48 22 811 512 1,32322 South Kalimantan 9 9 221 198 402 285 394 275 415 257 405 193 133 57 1,979 1,274 3,25323 East Kalimantan 11 10 214 173 310 187 254 173 257 165 212 108 97 39 1,355 855 2,21024 North Sulawesi 27 15 377 315 516 322 519 363 608 302 484 246 290 162 2,821 1,725 4,54625 Central Sulawesi 11 9 186 154 294 218 296 200 291 184 226 108 97 33 1,401 906 2,30726 South Sulawesi 9 25 557 514 908 666 907 665 925 683 838 522 415 186 4,559 3,261 7,82027 Southeast Sulawesi 10 13 288 220 380 297 400 241 359 208 325 222 157 65 1,919 1,266 3,18528 Gorontalo 6 8 145 125 210 164 186 140 171 134 131 95 67 35 916 701 1,61729 West Sulawesi 3 2 107 85 136 122 141 85 128 83 120 79 46 12 681 468 1,14930 Maluku 20 21 195 181 267 219 212 151 227 162 203 119 121 77 1,245 930 2,17531 North Maluku 3 7 99 68 139 92 83 48 80 38 55 34 36 10 495 297 79232 West Papua 2 4 93 91 113 78 66 38 47 31 34 20 13 5 368 267 63533 Papua 27 32 421 372 424 285 211 150 141 74 88 43 18 11 1,330 967 2,297<strong>Indonesia</strong>Source: DG of Disease Control and Environmental <strong>Health</strong>, MoH RI, 2011TB AFB POSITIVE NEW CASESBY AGE GROUP, SEX, AND PROVINCE IN <strong>2010</strong>Age Group (Year)0 - 14 15 - 24 25 - 34 35 - 44 45 - 54L P L P L P L P L P55 - 64L714 816 16,501 14,800 24,645 17,838 21,090 14,629 20,977 13,142 17,329 9,524 7,910 3,451 109,166 74,200 183,366PL> 65PLTotalPT
Annex 3.16TB AFB POSITIVE, CURED, AND COMPLETE TREATMENTAND SUCCESS RATE (SR) BY PROVINCE IN 2009No.ProvincesTB AFB PositiveCuredComplete Treatment Cured andDeathComplete Success RateAll Cases AFB Positive Cases % Cases % TreatmentCases %(1) (2) (3) (4) (5) (6) (7) (8) (9) (10) (11) (12)1 Aceh 3,966 3,065 2,681 87.5 172 5.6 2,853 93.1 71 2.32 North Sumatera 16,815 13,897 12,984 93.4 367 2.6 13,351 96.1 154 1.13 West Sumatera 5,482 3,732 2,950 79.0 351 9.4 3,301 88.5 124 3.34 Riau 4,325 2,880 1,840 63.9 572 19.9 2,412 83.8 55 1.95 Jambi 3,291 2,745 2,458 89.5 127 4.6 2,585 94.2 73 2.76 South Sumatera 7,779 5,181 4,641 89.6 284 5.5 4,925 95.1 67 1.37 Bengkulu 1,941 1,588 1,371 86.3 135 8.5 1,506 94.8 43 2.78 Lampung 7,266 4,943 4,284 86.7 323 6.5 4,607 93.2 101 2.09 Bangka Belitung Islands 1,229 951 837 88.0 20 2.1 857 90.1 27 2.810 Riau Islands 1,695 784 471 60.1 172 21.9 643 82.0 5 0.611 DKI Jakarta 25,074 7,989 5,749 72.0 1,108 13.9 6,857 85.8 121 1.512 West Java 61,964 31,433 27,153 86.4 1,813 5.8 28,966 92.2 414 1.313 Central Java 34,671 16,906 14,365 85.0 926 5.5 15,291 90.4 301 1.814 DI Yogyakarta 2,345 1,155 893 77.3 79 6.8 972 84.2 54 4.715 East Java 38,010 22,598 19,165 84.8 1,293 5.7 20,458 90.5 509 2.316 Banten 15,629 8,134 7,031 86.4 560 6.9 7,591 93.3 118 1.517 Bali 3,227 1,517 1,154 76.1 186 12.3 1,340 88.3 56 3.718 West Nusa Tenggara 5,346 3,089 2,436 78.9 472 15.3 2,908 94.1 64 2.119 East Nusa Tenggara 5,302 3,369 2,634 78.2 467 13.9 3,101 92.0 125 3.720 West Kalimantan 5,499 4,156 3,733 89.8 128 3.1 3,861 92.9 57 1.421 Central Kalimantan 2,090 1,339 1,116 83.3 153 11.4 1,269 94.8 13 1.022 South Kalimantan 4,609 2,891 2,587 89.5 127 4.4 2,714 93.9 74 2.623 East Kalimantan 3,694 2,065 1,407 68.1 355 17.2 1,762 85.3 64 3.124 North Sulawesi 4,989 3,988 3,596 90.2 237 5.9 3,833 96.1 78 2.025 Central Sulawesi 2,397 1,918 1,689 88.1 111 5.8 1,800 93.8 40 2.126 South Sulawesi 8,223 6,428 5,615 87.4 163 2.5 5,778 89.9 204 3.227 Southeast Sulawesi 2,663 2,296 1,920 83.6 246 10.7 2,166 94.3 68 3.028 Gorontalo 1,620 1,370 1,117 81.5 191 13.9 1,308 95.5 30 2.229 West Sulawesi 1,179 942 809 85.9 61 6.5 870 92.4 31 3.330 Maluku 2,702 2,014 1,530 76.0 421 20.9 1,951 96.9 13 0.631 North Maluku 1,096 708 392 55.4 207 29.2 599 84.6 29 4.132 West Papua 1,559 638 224 35.1 84 13.2 308 48.3 20 3.133 Papua 7,054 2,504 1,146 45.8 405 16.2 1,551 61.9 79 3.2<strong>Indonesia</strong>294,731 169,213 141,978 83.9 12,316 7.3 154,294 91.2 3,282 1.9Source: DG of Disease Control and Environmental <strong>Health</strong>, MoH RI, 2011
Annex 3.17TB PERIOD PREVALENCE (D) AND SUSPECT TB PERIOD PREVALENCE (G)ON > 15 YEARS OF AGE POPULATION BY PROVINCE, RISKESDAS <strong>2010</strong>No.ProvincesPeriod PrevalenceD (%) G (%)(1) (2) (3) (4)1 Aceh 0,644 2.6522 North Sumatera 0,539 3.0093 West Sumatera 0,674 4.7574 Riau 0,433 1.9885 Jambi 0,630 5.3376 South Sumatera 0,351 1.7657 Bengkulu 0,827 3.8868 Lampung 0,270 1.7469 Bangka Belitung Islands 0,640 3.58510 Riau Islands 0,427 3.22011 DKI Jakarta 1.032 2.24012 West Java 0,937 2.74613 Central Java 0,687 2.16314 DI Yogyakarta 0,311 2.06515 East Java 0,628 1.84316 Banten 1.282 3.12717 Bali 0,306 1.33918 West Nusa Tenggara 0,927 2.87719 East Nusa Tenggara 0,577 6.51120 West Kalimantan 0,903 2.80221 Central Kalimantan 0,426 4.30522 South Kalimantan 0,810 4.20123 East Kalimantan 0,789 2.75824 North Sulawesi 1.221 3.38225 Central Sulawesi 0,542 5.36726 South Sulawesi 0,577 4.84427 Southeast Sulawesi 0,418 2.14728 Gorontalo 1.200 6.99229 West Sulawesi 0,668 2.12630 Maluku 0,887 4.02231 North Maluku 0,546 3.01632 West Papua 0,637 6.72233 Papua 1.441 3.813<strong>Indonesia</strong>0,725 2.728Source: DG of Disease Control and Environmental <strong>Health</strong>, MoH RI, 2011
Annex 3.18AIDS NEW CASES , AIDS CUMULATIVE CASES, DEATH CASES, AND CASE RATE AIDS PER 100,000 POPULATIONBY PROVINCE UP TO DECEMBER <strong>2010</strong>No Provinces New CasesCumulative CasesDeath CasesCase Rateper 100,000 Population(1) (2) (3) (4) (5) (6)1 Aceh 10 53 12 1.292 North Sumatera 22 507 94 3.883 West Sumatera 80 410 99 9.104 Riau 2 477 132 8.395 Jambi 103 268 62 9.376 South Sumatera - 219 38 3.047 Bengkulu 40 131 29 7.498 Lampung - 144 42 1.869 Bangka Belitung Islands 3 120 18 11.6510 Riau Islands 41 374 143 24.9611 DKI Jakarta 1167 3,995 576 44.7412 West Java 130 3,728 665 8.9113 Central Java 227 944 289 2.9214 DI Yogyakarta 215 505 108 14.8215 East Java 545 3,771 779 10.4416 Banten 82 401 67 3.8617 Bali 132 1,747 311 49.1618 West Nusa Tenggara 23 142 69 3.0719 East Nusa Tenggara 104 242 36 5.5520 West Kalimantan 331 1,125 138 23.9621 Central Kalimantan 36 57 4 2.4022 South Kalimantan - 27 5 0.7823 East Kalimantan - 11 10 0.3524 North Sulawesi - 173 62 7.6925 Central Sulawesi - 12 6 0.4626 South Sulawesi - 591 62 6.6527 Southeast Sulawesi 1 22 5 0.9528 Gorontalo - 3 1 0.3329 West Sulawesi - - - -30 Maluku - 192 70 14.2131 North Maluku 7 17 8 1.7732 West Papua - 58 19 8.9333 Papua 857 3,665 580 173.69<strong>Indonesia</strong>4,158 24,131 4,539 10.46Source: DG of Disease Control and Environmental <strong>Health</strong>, MoH RI, 2011
Annex 3.19NoProvincesAIDS CUMULATIVE CASES PER QUARTERBY PROVINCE IN <strong>2010</strong>AIDS Cumulative Cases1st Quarter 2nd Quarter 3rd Quarter 4th Quarter(1) (2) (3) (4) (5) (6)1 Aceh 44 48 52 532 North Sumatera 485 485 485 5073 West Sumatera 382 410 410 4104 Riau 476 477 477 4775 Jambi 165 166 166 2686 South Sumatera 219 219 219 2197 Bengkulu 91 113 119 1318 Lampung 144 144 144 1449 Bangka Belitung Islands 117 120 120 1<strong>2010</strong> Riau Islands 334 341 365 37411 DKI Jakarta 2,828 3,740 3,870 3,99512 West Java 3,599 3,710 3,714 3,72813 Central Java 752 819 872 94414 DI Yogyakarta 290 290 458 50515 East Java 3,540 3,540 3,617 3,77116 Banten 318 323 326 40117 Bali 1,725 1,747 1,747 1,74718 West Nusa Tenggara 133 139 142 14219 East Nusa Tenggara 139 142 182 24220 West Kalimantan 794 794 1,125 1,12521 Central Kalimantan 30 40 49 5722 South Kalimantan 27 27 27 2723 East Kalimantan 11 11 11 1124 North Sulawesi 173 173 173 17325 Central Sulawesi 12 12 12 1226 South Sulawesi 591 591 591 59127 Southeast Sulawesi 21 22 22 2228 Gorontalo 3 3 3 329 West Sulawesi - - - -30 Maluku 192 192 192 19231 North Maluku 13 16 16 1732 West Papua 58 58 58 5833 Papua 2,858 2,858 2,962 3,665<strong>Indonesia</strong>20,564 21,770 22,726 24,131Source: DG of Disease Control and Environmental <strong>Health</strong>, MoH RI, 2011
Annex 3.20NUMBER OF CASES AND PERCENTAGE OF AIDS ON INJECTING DRUG USERS (IDU)BY PROVINCE UP TO DECEMBER <strong>2010</strong>No Provinces AIDS New Cases AIDS New Cases on IDUPercentage of AIDS NewCases on IDUAIDS Cumulative CasesAIDS Cumulative Cases onIDUPercentage of AIDSCumulative Cases on IDU(1) (2) (3) (4) (5) (6) (7) (8)1 Aceh 10 1 10.0 53 17 32.12 North Sumatera 22 13 59.1 507 222 43.83 West Sumatera 80 44 55.0 410 268 65.44 Riau 2 0 0.0 477 135 28.35 Jambi 103 59 57.3 268 155 57.86 South Sumatera - - - 219 104 47.57 Bengkulu 40 19 47.5 131 66 50.48 Lampung - - - 144 112 77.89 Bangka Belitung Islands 3 1 33.3 120 41 34.210 Riau Islands 41 1 2.4 374 31 8.311 DKI Jakarta 1167 729 62.5 3,995 2,801 70.112 West Java 130 77 59.2 3,728 2,706 72.613 Central Java 227 26 11.5 944 178 18.914 DI Yogyakarta 215 46 21.4 505 140 27.715 East Java 545 35 6.4 3,771 1,046 27.716 Banten 82 43 52.4 401 247 61.617 Bali 132 8 6.1 1,747 269 15.418 West Nusa Tenggara 23 4 17.4 142 50 35.219 East Nusa Tenggara 104 3 2.9 242 15 6.220 West Kalimantan 331 51 15.4 1,125 197 17.521 Central Kalimantan 36 7 19.4 57 14 24.622 South Kalimantan - - - 27 9 33.323 East Kalimantan - - - 11 4 36.424 North Sulawesi - - - 173 40 23.125 Central Sulawesi - - - 12 6 50.026 South Sulawesi - - - 591 265 44.827 Southeast Sulawesi 1 0 0.0 22 1 4.528 Gorontalo - - - 3 2 66.729 West Sulawesi - - - - - -30 Maluku - - - 192 79 41.131 North Maluku 7 3 42.9 17 5 29.432 West Papua - - - 58 5 8.633 Papua 857 0 0.0 3,665 3 0.1<strong>Indonesia</strong>4,158 1,170 28.1 24,131 9,233 38.3Source: DG of Disease Control and Environmental <strong>Health</strong>, MoH RI, 2011
Annex 3.21NUMBER OF UNDERFIVE PNEUMONIE CASESBY PROVINCE IN <strong>2010</strong>No.ProvincesUnderfive PopulationTarget (10%)Age < 1Underfive Pneumonia Case DetectionAge 1 - 4 Total %(1) (2) (3) (4) (5) (6) (7)1 Aceh 47,090 484 1,178 1,662 3.532 North Sumatera 144,630 19,236 18,483 37,719 26.083 West Sumatera 50,130 2,649 7,895 10,544 21.034 Riau 61,190 2,363 7,321 9,684 15.835 Jambi 28,590 1,186 2,994 4,180 14.626 South Sumatera 72,790 8,448 12,377 20,825 28.617 Bengkulu 16,810 88 194 282 1.688 Lampung 72,760 4,396 6,725 11,121 15.289 Bangka Belitung Islands 11,060 1,096 3,336 4,432 40.0710 Riau Islands 18,750 135 223 358 1.9111 DKI Jakarta 79,440 4,800 10,454 15,254 19.2012 West Java 398,720 67,346 126,634 193,980 48.6513 Central Java 275,810 8,097 22,143 30,240 10.9614 DI Yogyakarta 34,792 476 1,234 1,710 4.9115 East Java 263,230 17,282 35,492 52,774 20.0516 Banten 99,200 4,063 7,344 11,407 11.5017 Bali 25,980 1,367 2,372 3,739 14.3918 West Nusa Tenggara 50,830 13,263 19,515 32,778 64.4919 East Nusa Tenggara 56,230 1,349 1,765 3,114 5.5420 West Kalimantan 47,290 995 2,260 3,255 6.8821 Central Kalimantan 21,160 309 769 1,078 5.0922 South Kalimantan 33,560 5,006 11,640 16,646 49.6023 East Kalimantan 31,560 1,059 2,530 3,589 11.3724 North Sulawesi 17,710 2,803 1,470 4,273 24.1325 Central Sulawesi 25,700 2,412 5,294 7,706 29.9826 South Sulawesi 81,020 2,212 4,896 7,108 8.7727 Southeast Sulawesi 25,600 288 821 1,109 4.3328 Gorontalo 9,500 304 574 878 9.2429 West Sulawesi 10,490 1,341 2,879 4,220 40.2330 Maluku 15,270 924 1,490 2,414 15.8131 North Maluku 11,010 382 798 1,180 10.7232 West Papua 8,560 - - - -33 Papua 23,960 - - - -<strong>Indonesia</strong>2,170,423 176,159 323,100 499,259 23.00Source: DG of Disease Control and Environmental <strong>Health</strong>, MoH RI, 2011
Annex 3.22LEPROSY NEW CASES, CASE DETECTION RATE (CDR),PROPORTION OF DEFORMITY, CASES ON CHILDREN, AND WOMEN BY PROVINCE IN <strong>2010</strong>No.ProvincesPaucibacillary(PB)Multibacillary(MB)TotalCase DetectionRate per 100,000Population2nd Grade DeformityRFT Rate (%)(1) (2) (4) (5) (6) (7) (8) (9) (10) (11) (12) (13) (14) (15)1 Aceh 133 331 464 10.25 60 12.93 38 8.19 434 11 86.60 79.902 North Sumatera 28 172 200 1.51 38 19.00 23 11.50 213 1 94.50 92.803 West Sumatera 19 63 82 1.68 4 4.88 2 2.44 112 - 64.70 40.004 Riau 36 149 185 3.41 31 16.76 27 14.59 298 - 95.20 91.705 Jambi 22 87 109 3.78 7 6.42 21 19.27 116 - 88.50 85.106 South Sumatera 24 201 225 3.02 63 28.00 9 4.00 212 2 83.30 74.507 Bengkulu - 10 10 0.59 2 20.00 0 - 11 - 100.00 91.708 Lampung 52 309 361 4.75 57 15.79 43 11.91 405 7 78.00 65.009 Bangka Belitung Islands 9 22 31 2.63 1 3.23 5 16.13 37 4 100.00 80.0010 Riau Islands 4 1 5 0.32 1 20.00 - - 15 - 100.00 45.5011 DKI Jakarta 125 622 747 8.04 22 2.95 26 3.48 621 11 81.50 81.8012 West Java 209 1540 1,749 4.06 234 13.38 168 9.61 2,027 31 97.60 87.2013 Central Java 325 1415 1,740 5.33 240 13.79 164 9.43 2,169 21 95.00 84.0014 DI Yogyakarta 34 93 127 3.59 34 26.77 7 5.51 158 5 100.00 100.0015 East Java 719 3934 4,653 12.42 598 12.85 515 11.07 5,496 16 92.70 90.3016 Banten 91 320 411 4.12 42 10.22 106 25.79 997 - 100.00 87.5017 Bali 18 75 93 2.59 2 2.15 10 10.75 118 - 96.60 90.0018 West Nusa Tenggara 69 188 257 5.80 22 8.56 45 17.51 251 1 98.00 95.0019 East Nusa Tenggara 24 121 145 3.17 12 8.28 18 12.41 311 6 26.20 73.8020 West Kalimantan 7 108 115 2.62 6 5.22 17 14.78 217 - 90.00 88.0021 Central Kalimantan 8 67 75 3.71 7 9.33 2 2.67 72 - 100.00 95.0022 South Kalimantan 15 163 178 5.02 42 23.60 17 9.55 215 2 90.00 85.0023 East Kalimantan 30 185 215 6.84 13 6.05 14 6.51 212 - 88.40 65.4024 North Sulawesi 52 354 406 18.05 35 8.62 45 11.08 424 2 91.00 89.0025 Central Sulawesi 93 264 357 13.56 40 11.20 23 6.44 334 - 93.20 86.3026 South Sulawesi 202 890 1,092 13.63 119 10.90 62 5.68 1,013 10 91.00 82.4027 Southeast Sulawesi 33 221 254 11.36 7 2.76 15 5.91 286 - 96.60 81.0028 Gorontalo 15 136 151 14.89 17 11.26 18 11.92 156 - 89.50 93.2029 West Sulawesi 50 119 169 14.53 5 2.96 11 6.51 193 1 100.00 94.0030 Maluku 82 348 430 26.37 19 4.42 27 6.28 514 4 93.00 86.3031 North Maluku 179 334 513 49.01 17 3.31 94 18.32 520 4 97.00 92.0032 West Papua 117 174 291 38.90 6 2.06 55 18.90 410 9 76.40 45.2033 Papua 454 718 1,172 41.09 19 1.62 277 23.63 1,174 10 71.00 63.00<strong>Indonesia</strong>3,278 13,734 17,012 7.22 1,822 10.71 1,904 11.19 19,741 158 89.50 84.90Source: DG of Disease Control and Environmental <strong>Health</strong>, MoH RI, 2011Cases%0 - 14 YearsCases%RegisteredCasesRelapsedCasesPBMB
Annex 3.23NUMBER OF TETANUS NEONATORUM CASES AND RISK FACTORSBY PROVINCE IN <strong>2010</strong>Antenatal Care (ANC)Imunization StatusRisk FactorsDelivery Attendant Umbilical Cord Treatment Umbilical Cord Cutting Hospitalized StatusNo.ProvincesTotalDeathPhysicianMidwife/NurseTraditionalWithout ANCUnknownTT2+TT1No ImmunizationUnknown(1) (2) (3) (4) (5) (6) (7) (8) (9) (10) (11) (12) (13) (14) (15) (16) (17) (18) (19) (20) (21) (22) (23) (24) (25) (26) (27) (28)1 Aceh 6 4 1 3 2 0 0 2 0 2 2 0 3 3 0 0 0 0 6 4 1 0 1 6 0 02 North Sumatera 2 0 0 1 1 0 0 0 0 1 1 0 0 1 1 0 0 0 2 1 1 0 0 2 0 03 West Sumatera 0 0 0 0 0 0 0 0 0 0 0 0 0 0 0 0 0 0 0 0 0 0 0 0 0 04 Riau 4 3 0 0 0 4 0 0 0 4 0 0 0 4 0 0 4 0 0 4 0 0 0 3 1 05 Jambi 1 0 1 0 0 0 0 1 0 0 0 0 1 0 0 0 0 1 0 1 0 0 0 1 0 06 South Sumatera 11 5 0 6 0 1 4 0 3 4 4 0 1 6 4 2 6 0 3 3 3 2 3 8 2 17 Bengkulu 0 0 0 0 0 0 0 0 0 0 0 0 0 0 0 0 0 0 0 0 0 0 0 0 0 08 Lampung 11 8 1 4 2 3 1 1 3 5 2 0 3 7 1 2 6 1 2 5 2 1 3 7 2 29 Bangka Belitung Islands 0 0 0 0 0 0 0 0 0 0 0 0 0 0 0 0 0 0 0 0 0 0 0 0 0 010 Riau Islands 0 0 0 0 0 0 0 0 0 0 0 0 0 0 0 0 0 0 0 0 0 0 0 0 0 011 DKI Jakarta 3 3 0 3 0 0 0 0 0 3 0 0 3 0 0 0 0 0 3 0 0 0 3 3 0 012 West Java 11 6 1 3 0 6 1 1 1 9 0 0 2 8 1 0 2 9 0 9 0 2 0 10 1 013 Central Java 4 3 0 4 0 0 0 0 3 1 0 0 2 2 0 1 2 1 0 4 0 0 0 3 1 014 DI Yogyakarta 0 0 0 0 0 0 0 0 0 0 0 0 0 0 0 0 0 0 0 0 0 0 0 0 0 015 East Java 33 18 0 28 0 3 2 5 7 18 3 1 6 23 3 11 10 11 1 20 9 3 1 30 1 216 Banten 40 19 1 16 4 17 2 5 8 24 3 0 6 33 1 8 14 15 3 32 4 4 0 38 2 017 Bali 1 0 0 1 0 0 0 0 1 0 0 0 1 0 0 1 0 0 0 1 0 0 0 1 0 018 West Nusa Tenggara 0 0 0 0 0 0 0 0 0 0 0 0 0 0 0 0 0 0 0 0 0 0 0 0 0 019 East Nusa Tenggara 2 2 0 1 0 0 1 0 0 1 1 0 0 1 1 0 0 0 2 0 0 1 1 0 1 120 West Kalimantan 9 9 0 7 0 2 0 0 4 4 1 0 3 6 0 3 5 0 1 4 3 1 1 7 2 021 Central Kalimantan 0 0 0 0 0 0 0 0 0 0 0 0 0 0 0 0 0 0 0 0 0 0 0 0 0 022 South Kalimantan 2 2 0 1 0 1 0 0 1 1 0 0 0 2 0 1 1 0 0 1 1 0 0 2 0 023 East Kalimantan 0 0 0 0 0 0 0 0 0 0 0 0 0 0 0 0 0 0 0 0 0 0 0 0 0 024 North Sulawesi 0 0 0 0 0 0 0 0 0 0 0 0 0 0 0 0 0 0 0 0 0 0 0 0 0 025 Central Sulawesi 2 0 0 0 0 1 1 0 0 1 1 0 0 1 1 0 1 0 1 0 0 0 2 1 0 126 South Sulawesi 3 1 0 0 1 0 2 0 1 1 1 0 0 1 2 1 2 0 0 2 0 0 1 3 0 027 Southeast Sulawesi 1 0 0 0 1 0 0 0 0 1 0 0 0 1 0 0 0 0 1 0 0 0 1 0 1 028 Gorontalo 0 0 0 0 0 0 0 0 0 0 0 0 0 0 0 0 0 0 0 0 0 0 0 0 0 029 West Sulawesi 1 1 0 1 0 0 0 1 0 0 0 0 1 0 0 1 0 0 0 1 0 0 0 1 0 030 Maluku 0 0 0 0 0 0 0 0 0 0 0 0 0 0 0 0 0 0 0 0 0 0 0 0 0 031 North Maluku 0 0 0 0 0 0 0 0 0 0 0 0 0 0 0 0 0 0 0 0 0 0 0 0 0 032 West Papua 0 0 0 0 0 0 0 0 0 0 0 0 0 0 0 0 0 0 0 0 0 0 0 0 0 033 Papua 0 0 0 0 0 0 0 0 0 0 0 0 0 0 0 0 0 0 0 0 0 0 0 0 0 0<strong>Indonesia</strong>147 84 5 79 11 38 14 16 32 80 19 1 32 99 15 31 53 38 25 92 24 14 17 126 14 7Source: DG of Disease Control and Environmental <strong>Health</strong>, MoH RI, 2011PhysicianMidwife/NurseTraditionalUnknownAlcohol/IodineTraditionalOthersUnknownScissorsBambooOthersUnknownYesNoUnknown
Annex 3.24NUMBER OF MEASLES CASESBY MONTH AND PROVINCE IN <strong>2010</strong>No.ProvincesJanFebMarAprMayCases per MonthJun Jul AgsSep Oct NovDecTotal(1) (2) (3) (4) (5) (6) (7) (8) (9) (10) (11) (12) (13) (14) (15)1 Aceh 70 48 74 63 69 76 35 10 1 19 37 23 5252 North Sumatera 27 57 29 28 0 24 31 1 7 19 2 0 2253 West Sumatera 62 67 52 35 37 44 32 8 9 24 16 24 4104 Riau 45 35 53 18 64 0 30 37 48 50 23 14 4175 Jambi 67 38 41 57 37 26 21 22 8 16 16 21 3706 South Sumatera 79 71 49 34 47 47 33 34 30 35 10 39 5087 Bengkulu 32 42 19 22 21 8 2 6 1 1 3 4 1618 Lampung 114 95 77 61 58 40 21 24 30 24 16 13 5739 Bangka Belitung Islands 3 8 9 4 0 2 1 1 0 4 0 27 5910 Riau Islands 56 60 69 74 23 25 17 18 31 48 58 75 55411 DKI Jakarta 80 104 112 0 78 66 88 172 165 58 204 74 1,20112 West Java 424 434 462 499 456 137 133 3 0 0 0 0 2,54813 Central Java 429 566 420 310 243 167 183 125 120 106 82 63 2,81414 DI Yogyakarta 195 138 85 64 38 41 40 33 43 64 42 46 82915 East Java 194 224 153 205 176 131 72 52 32 17 15 0 1,27116 Banten 145 167 196 282 225 138 183 192 122 225 221 105 2,20117 Bali 0 40 77 11 6 0 0 7 0 0 0 0 14118 West Nusa Tenggara 2 1 2 2 2 5 1 9 0 0 0 0 2419 East Nusa Tenggara 7 30 16 16 12 18 1 0 7 0 5 0 11220 West Kalimantan 52 39 24 34 18 4 10 12 6 9 6 5 21921 Central Kalimantan 0 19 21 17 20 19 21 5 2 20 20 18 18222 South Kalimantan 34 13 13 10 6 18 8 13 15 13 3 3 14923 East Kalimantan 0 0 17 39 0 13 5 10 0 8 0 0 9224 North Sulawesi 63 98 87 23 24 16 5 38 19 17 10 10 41025 Central Sulawesi 10 9 10 16 14 5 9 18 3 19 9 9 13126 South Sulawesi 105 117 124 97 54 43 28 3 0 0 0 0 57127 Southeast Sulawesi 0 0 0 0 0 0 1 0 0 2 0 0 328 Gorontalo 7 2 6 4 10 10 5 8 5 20 15 17 10929 West Sulawesi 0 0 0 0 0 1 1 0 1 0 5 0 830 Maluku 0 0 0 0 0 0 0 0 0 0 0 0 031 North Maluku 8 11 0 2 7 7 2 5 4 6 7 0 5932 West Papua 0 31 8 5 1 0 2 3 5 27 3 7 9233 Papua 12 67 18 22 20 6 2 1 6 13 1 3 171<strong>Indonesia</strong>2,322 2,631 2,323 2,054 1,766 1,137 1,023 870 720 864 829 600 17,139Source: DG of Disease Control and Environmental <strong>Health</strong>, MoH RI, 2011
Annex 3.25NUMBER OF MEASLES CASESBY AGE GROUP AND PROVINCE IN <strong>2010</strong>No.Provinces 14TotalVaccinatedTotal CasesProportion ofVaccinatedto All CasesVaccinated Cases Vaccinated Cases Vaccinated Cases Vaccinated Cases Vaccinated Cases(1) (2) (3) (4) (5) (6) (7) (8) (9) (10) (11) (12) (13) (14) (15)1 Aceh 4 63 9 113 18 149 9 81 8 119 48 525 9.142 North Sumatera 17 35 30 72 19 56 0 45 2 17 68 225 30.223 West Sumatera 19 38 61 110 85 136 32 58 22 68 219 410 53.414 Riau 19 38 78 149 69 147 15 45 15 38 196 417 47.005 Jambi 15 57 45 72 78 98 54 71 12 72 204 370 55.146 South Sumatera 22 77 68 134 66 135 21 53 12 109 189 508 37.207 Bengkulu 8 21 20 33 38 40 18 41 8 26 92 161 57.148 Lampung 22 64 65 106 103 173 66 106 42 124 298 573 52.019 Bangka Belitung Islands 1 7 3 10 2 24 1 8 1 10 8 59 13.5610 Riau Islands 39 77 96 189 81 170 31 49 20 69 267 554 48.1911 DKI Jakarta 0 183 0 504 0 220 0 114 0 180 0 1,201 0.0012 West Java 0 310 0 823 0 761 0 355 0 299 0 2,548 0.0013 Central Java 69 231 294 546 472 850 264 574 141 613 1240 2,814 44.0714 DI Yogyakarta 3 50 7 115 7 148 4 148 4 368 25 829 3.0215 East Java 55 122 235 363 238 401 125 194 97 191 750 1,271 59.0116 Banten 30 364 134 890 83 565 28 149 22 233 297 2,201 13.4917 Bali 1 1 5 10 18 36 12 41 9 53 45 141 31.9118 West Nusa Tenggara 0 3 0 2 4 14 2 2 0 3 6 24 25.0019 East Nusa Tenggara 2 2 16 34 12 45 2 13 10 18 42 112 37.5020 West Kalimantan 3 11 30 52 30 42 27 36 10 78 100 219 45.6621 Central Kalimantan 9 22 18 35 20 43 13 25 31 57 91 182 50.0022 South Kalimantan 7 27 26 34 14 38 2 14 5 36 54 149 36.2423 East Kalimantan 8 20 21 27 26 30 9 10 5 5 69 92 75.0024 North Sulawesi 8 44 26 132 18 132 5 47 7 55 64 410 15.6125 Central Sulawesi 1 26 9 33 12 33 1 19 1 20 24 131 18.3226 South Sulawesi 30 65 105 132 84 115 58 87 111 172 388 571 67.9527 Southeast Sulawesi 0 0 0 1 0 0 0 2 0 0 0 3 0.0028 Gorontalo 4 6 16 26 9 35 3 21 0 21 32 109 29.3629 West Sulawesi 2 3 2 2 1 1 1 1 1 1 7 8 87.5030 Maluku 0 0 0 0 0 0 0 0 0 0 0 0 0.0031 North Maluku 5 13 6 22 7 15 2 6 1 3 21 59 35.5932 West Papua 2 9 14 58 5 20 1 5 0 0 22 92 23.9133 Papua 6 24 32 72 33 54 8 14 0 7 79 171 46.20<strong>Indonesia</strong>411 2,013 1,471 4,901 1,652 4,726 814 2,434 597 3,065 4,945 17,139 28.85Source: DG of Disease Control and Environmental <strong>Health</strong>, MoH RI, 2011
Annex 3.26NUMBER OF CASES, DEATHS, AND INCIDENCE RATE OF MEASLESBY PROVINCE IN <strong>2010</strong>No.ProvincesCasesRoutine ReportDeathsIR (per 10,000 Population)(1) (2) (3) (4) (5)1 Aceh 525 0 1.182 North Sumatera 225 0 0.173 West Sumatera 410 0 0.844 Riau 417 0 0.775 Jambi 370 0 1.286 South Sumatera 508 0 0.697 Bengkulu 161 0 0.958 Lampung 573 0 0.759 Bangka Belitung Islands 59 0 0.5110 Riau Islands 554 0 3.5111 DKI Jakarta 1,201 0 1.2912 West Java 2,548 0 0.6113 Central Java 2,814 5 0.8514 DI Yogyakarta 829 0 2.3515 East Java 1,271 0 0.3416 Banten 2,201 1 2.2117 Bali 141 0 0.3918 West Nusa Tenggara 24 0 0.0519 East Nusa Tenggara 112 0 0.2420 West Kalimantan 219 1 0.5021 Central Kalimantan 182 0 0.8622 South Kalimantan 149 0 0.4223 East Kalimantan 92 0 0.2824 North Sulawesi 410 0 1.8225 Central Sulawesi 131 0 0.5226 South Sulawesi 571 0 0.7127 Southeast Sulawesi 3 0 0.0128 Gorontalo 109 0 1.0929 West Sulawesi 8 0 0.0830 Maluku 0 0 0.0031 North Maluku 59 0 0.6032 West Papua 92 0 1.1933 Papua 171 0 0.80<strong>Indonesia</strong>17,139 7 0.73Source: DG of Disease Control and Environmental <strong>Health</strong>, MoH RI, 2011
Annex 3.27OUTBREAK FREQUENCY AND NUMBER OF CASES ON MEASLES OUTBREAKBY PROVINCE IN <strong>2010</strong>Outbreak ReportNo.ProvincesTotal OutbreakFrequency of Outbreak Frequency of Outbreak Frequency of Outbreak Total DeathsWith Specimens > 5 With Full Investigation With Report to MOH Cases(1) (2) (3) (4) (5) (6) (7) (8)1 Aceh 3 3 0 0 16 02 North Sumatera 1 1 1 1 15 03 West Sumatera 2 1 0 0 9 04 Riau 4 4 2 2 81 05 Jambi 6 6 6 6 88 06 South Sumatera 7 7 7 7 63 07 Bengkulu 2 2 2 2 25 08 Lampung 12 11 10 11 135 09 Bangka Belitung Islands 0 0 0 0 0 010 Riau Islands 0 0 0 0 0 011 DKI Jakarta 1 1 0 0 6 012 West Java 29 20 17 20 283 013 Central Java 21 19 17 19 336 014 DI Yogyakarta 3 3 3 3 23 015 East Java 13 9 0 0 65 016 Banten 33 33 31 33 463 117 Bali 7 7 7 7 134 018 West Nusa Tenggara 1 1 0 0 5 019 East Nusa Tenggara 2 2 0 0 10 020 West Kalimantan 0 0 0 0 0 021 Central Kalimantan 1 0 0 0 4 022 South Kalimantan 0 0 0 0 0 023 East Kalimantan 2 2 0 0 11 024 North Sulawesi 7 5 4 6 318 025 Central Sulawesi 2 1 0 0 8 026 South Sulawesi 1 1 0 0 5 027 Southeast Sulawesi 4 4 4 4 75 028 Gorontalo 3 2 0 0 13 029 West Sulawesi 0 0 0 0 0 030 Maluku 0 0 0 0 0 031 North Maluku 0 0 0 0 0 032 West Papua 1 1 1 1 6 033 Papua 6 5 0 0 373 5<strong>Indonesia</strong>174 151 112 122 2,570 6Source: DG of Disease Control and Environmental <strong>Health</strong>, MoH RI, 2011
Annex 3.28MEASLES OUTBREAK BASED ON LABORATORY CONFIRMATIONBY PROVINCE IN <strong>2010</strong>No. Provinces SampleMeaslesRubellaLaboratory ConfirmationMeasles and RubellaNegativePending Lab.Without SpecimensBlood Frequency Cases Frequency Cases Frequency Cases Frequency Cases Frequency Cases Frequency Cases(1) (2) (3) (4) (5) (6) (7) (8) (9) (10) (11) (12) (13) (14) (15)1 Aceh 16 0 0 3 16 0 0 0 0 0 0 0 02 North Sumatera 5 1 15 0 0 0 0 0 0 0 0 0 03 West Sumatera 9 1 4 0 0 0 0 1 5 0 0 0 04 Riau 24 4 81 0 0 0 0 0 0 0 0 0 05 Jambi 33 0 0 4 69 2 19 0 0 0 0 0 06 South Sumatera 36 3 32 3 26 0 0 1 5 0 0 0 07 Bengkulu 14 0 0 2 25 0 0 0 0 0 0 0 08 Lampung 65 1 40 7 66 0 0 4 29 0 0 0 09 Bangka Belitung Islands 0 0 0 0 0 0 0 0 0 0 0 0 010 Riau Islands 0 0 0 0 0 0 0 0 0 0 0 0 011 DKI Jakarta 6 1 6 0 0 0 0 0 0 0 0 0 012 West Java 140 13 154 6 65 2 11 8 53 0 0 0 013 Central Java 98 9 121 8 178 1 5 3 32 0 0 0 014 DI Yogyakarta 23 1 6 2 17 0 0 0 0 0 0 0 015 East Java 64 8 44 2 10 2 9 1 2 0 0 0 016 Banten 173 28 420 2 20 0 0 3 23 0 0 0 017 Bali 35 4 100 3 34 0 0 0 0 0 0 0 018 West Nusa Tenggara 5 1 5 0 0 0 0 0 0 0 0 0 019 East Nusa Tenggara 10 2 10 0 0 0 0 0 0 0 0 0 020 West Kalimantan 0 0 0 0 0 0 0 0 0 0 0 0 021 Central Kalimantan 4 1 4 0 0 0 0 0 0 0 0 0 022 South Kalimantan 0 0 0 0 0 0 0 0 0 0 0 0 023 East Kalimantan 11 0 0 2 11 0 0 0 0 0 0 0 024 North Sulawesi 35 6 313 0 0 1 5 0 0 0 0 0 025 Central Sulawesi 8 0 0 0 0 0 0 2 8 0 0 0 026 South Sulawesi 5 0 0 0 0 0 0 1 5 0 0 0 027 Southeast Sulawesi 25 3 66 0 0 1 9 0 0 0 0 0 028 Gorontalo 13 2 7 0 0 0 0 1 6 0 0 0 029 West Sulawesi 0 0 0 0 0 0 0 0 0 0 0 0 030 Maluku 0 0 0 0 0 0 0 0 0 0 0 0 031 North Maluku 0 0 0 0 0 0 0 0 0 0 0 0 032 West Papua 5 1 6 0 0 0 0 0 0 0 0 0 033 Papua 30 6 373 0 0 0 0 0 0 0 0 0 0<strong>Indonesia</strong>892 96 1,807 44 537 9 58 25 168 0 0 0 0Source: DG of Disease Control and Environmental <strong>Health</strong>, MoH RI, 2011
Annex 3.29NUMBER OF DIPHTERIA CASES BY AGE GROUPAND PROVINCE IN <strong>2010</strong>Cases by Age Group (Month)No.Provinces 14Vaccinated Cases Vaccinated Cases Vaccinated Cases Vaccinated Cases Vaccinated CasesDeathsTotalVaccinatedTotalCasesProportion ofVaccinated toCases(1) (2) (3) (4) (5) (6) (7) (8) (9) (10) (11) (12) (13) (14) (15) (16)1 Aceh 0 0 0 0 0 0 0 0 0 0 0 0 0 0.002 North Sumatera 0 0 0 0 0 0 0 0 0 0 0 0 0 0.003 West Sumatera 0 0 2 3 2 3 1 1 0 0 0 5 7 71.434 Riau 0 0 0 0 0 0 0 0 0 0 0 0 0 0.005 Jambi 0 0 0 0 0 0 0 0 0 0 0 0 0.006 South Sumatera 0 0 1 2 0 2 0 2 0 1 0 1 7 14.297 Bengkulu 0 0 0 0 1 1 0 0 0 0 1 1 1 100.008 Lampung 0 0 0 1 0 0 0 0 0 0 0 0 1 0.009 Bangka Belitung Islands 0 0 0 0 0 2 0 0 0 0 1 0 2 0.0010 Riau Islands 0 0 0 1 0 1 0 0 0 0 1 0 2 0.0011 DKI Jakarta 0 0 0 0 0 0 0 0 0 0 0 0 0 0.0012 West Java 0 0 0 0 0 0 0 0 0 0 0 0 0 0.0013 Central Java 1 1 3 3 0 1 0 0 0 2 0 4 7 57.1414 DI Yogyakarta 0 0 0 0 2 2 0 0 0 0 0 2 2 100.0015 East Java 3 4 65 96 67 107 25 44 7 35 16 167 286 58.3916 Banten 0 0 1 6 1 2 1 1 0 0 0 3 9 33.3317 Bali 0 0 0 0 1 1 1 1 0 0 0 2 2 100.0018 West Nusa Tenggara 0 0 0 0 0 0 0 0 0 0 0 0 0 0.0019 East Nusa Tenggara 0 0 0 0 0 0 0 0 0 0 0 0 0 0.0020 West Kalimantan 1 1 1 8 3 3 0 0 0 1 5 5 13 38.4621 Central Kalimantan 0 0 0 0 0 0 0 0 0 0 0 0 0 0.0022 South Kalimantan 0 0 0 0 0 0 0 0 0 0 0 0 0 0.0023 East Kalimantan 1 3 12 18 13 16 2 5 1 4 0 29 46 63.0424 North Sulawesi 0 0 0 0 0 0 0 0 0 0 0 0 0 0.0025 Central Sulawesi 0 0 0 0 0 0 0 0 0 0 0 0 0 0.0026 South Sulawesi 0 0 0 0 0 0 0 0 0 0 0 0 0 0.0027 Southeast Sulawesi 0 0 0 0 0 0 0 0 0 0 0 0 0 0.0028 Gorontalo 0 0 0 0 0 0 0 0 0 0 0 0 0 0.0029 West Sulawesi 0 0 0 0 0 0 0 0 0 0 0 0 0 0.0030 Maluku 0 0 0 0 0 0 0 0 0 0 0 0 0 0.0031 North Maluku 0 0 0 0 0 0 0 0 0 0 0 0 0 0.0032 West Papua 0 0 0 0 0 0 0 0 0 0 0 0 0 0.0033 Papua 0 0 0 0 0 0 0 0 0 0 0 0 0 0.00<strong>Indonesia</strong>6 9 85 138 90 141 30 54 8 43 24 219 385 56.88Source: DG of Disease Control and Environmental <strong>Health</strong>, MoH RI, 2011
Annex 3.30NUMBER OF DIPTHERIA CASES PER MONTHBY PROVINCE IN <strong>2010</strong>No.ProvincesCases per MonthJan Feb Mar Apr May Jun Jul Ags Sep Oct Nov Dec Total(1) (2) (3) (4) (5) (6) (7) (8) (9) (10) (11) (12) (13) (14) (15)1 Aceh 0 0 0 0 0 0 0 0 0 0 0 0 02 North Sumatera 0 0 0 0 0 0 0 0 0 0 0 0 03 West Sumatera 0 0 1 0 2 2 2 0 0 0 0 0 74 Riau 0 0 0 0 0 0 0 0 0 0 0 0 05 Jambi 0 0 0 0 0 0 0 0 0 0 0 0 06 South Sumatera 0 0 2 0 1 1 2 0 0 1 0 0 77 Bengkulu 0 0 0 0 0 0 0 0 0 0 1 0 18 Lampung 0 0 0 0 0 0 0 0 0 0 1 0 19 Bangka Belitung Islands 1 1 0 0 0 0 0 0 0 0 0 0 210 Riau Islands 0 0 0 0 0 0 0 0 2 0 0 0 211 DKI Jakarta 0 0 0 0 0 0 0 0 0 0 0 0 012 West Java 0 0 0 0 0 0 0 0 0 0 0 0 013 Central Java 1 0 0 0 0 1 2 1 0 1 1 0 714 DI Yogyakarta 0 0 0 0 0 1 1 0 0 0 0 0 215 East Java 17 22 15 25 21 18 13 31 17 39 42 26 28616 Banten 4 0 0 1 0 2 2 0 0 0 0 0 917 Bali 0 0 0 0 0 1 0 1 0 0 0 0 218 West Nusa Tenggara 0 0 0 0 0 0 0 0 0 0 0 0 019 East Nusa Tenggara 0 0 0 0 0 0 0 0 0 0 0 0 020 West Kalimantan 0 0 0 2 1 0 2 0 0 5 1 2 1321 Central Kalimantan 0 0 0 0 0 0 0 0 0 0 0 0 022 South Kalimantan 0 0 0 0 0 0 0 0 0 0 0 0 023 East Kalimantan 0 0 4 16 8 10 6 2 0 0 0 0 4624 North Sulawesi 0 0 0 0 0 0 0 0 0 0 0 0 025 Central Sulawesi 0 0 0 0 0 0 0 0 0 0 0 0 026 South Sulawesi 0 0 0 0 0 0 0 0 0 0 0 0 027 Southeast Sulawesi 0 0 0 0 0 0 0 0 0 0 0 0 028 Gorontalo 0 0 0 0 0 0 0 0 0 0 0 0 029 West Sulawesi 0 0 0 0 0 0 0 0 0 0 0 0 030 Maluku 0 0 0 0 0 0 0 0 0 0 0 0 031 North Maluku 0 0 0 0 0 0 0 0 0 0 0 0 032 West Papua 0 0 0 0 0 0 0 0 0 0 0 0 033 Papua 0 0 0 0 0 0 0 0 0 0 0 0 0<strong>Indonesia</strong>23 23 22 44 33 36 30 35 19 46 46 28 385Source: DG of Disease Control and Environmental <strong>Health</strong>, MoH RI, 2011
Annex 3.31NUMBER OF AFP CASES AND NON POLIO AFP RATEBY PROVINCE IN <strong>2010</strong>No Provinces Minimum Cases per Year AFP Cases Non Polio AFP Rate / 100,000 population(1) (2) (3) (4) (5)1 Aceh 26 48 3.692 North Sumatera 84 88 2.103 West Sumatera 30 29 1.934 Riau 34 56 3.295 Jambi 16 19 2.386 South Sumatera 44 59 2.687 Bengkulu 10 12 2.408 Lampung 42 44 2.109 Bangka Belitung Islands 6 10 3.3010 Riau Islands 10 11 2.2011 DKI Jakarta 44 59 2.6812 West Java 232 256 2.2113 Central Java 164 177 2.1614 DI Yogyakarta 12 29 4.8315 East Java 158 263 3.3316 Banten 60 81 2.7017 Bali 16 23 2.8818 West Nusa Tenggara 28 45 3.0719 East Nusa Tenggara 30 62 3.9320 West Kalimantan 26 27 2.0821 Central Kalimantan 12 8 1.3322 South Kalimantan 20 22 2.2023 East Kalimantan 18 24 2.6724 North Sulawesi 10 31 6.2025 Central Sulawesi 14 20 2.7126 South Sulawesi 46 58 2.4827 Southeast Sulawesi 14 18 2.5728 Gorontalo 6 17 5.6729 West Sulawesi 6 6 1.6730 Maluku 8 8 2.0031 North Maluku 6 3 1.0032 West Papua 4 6 3.0033 Papua 12 22 3.67<strong>Indonesia</strong>1,248 1,641 2.62Source: DG of Disease Control and Environmental <strong>Health</strong>, MoH RI, 2011
Annex 3.32No.NUMBER OF DENGUE HAEMORRHAGIC FEVER (DHF) CASES, DEATHS, CASE FATALITY RATE (%), AND INCIDENCE RATE PER 100,000 POPULATIONBY PROVINCE IN 2006 - <strong>2010</strong>Provinces2006 2007 20082009 <strong>2010</strong>C D CFR IR C D CFR IR C D CFR IR C D CFR IR C D CFR IR(1) (2) (3) (4) (5) (6) (7) (8) (9) (10) (11) (12) (13) (14) (15) (16) (17) (18) (19) (20) (21) (22)1 Aceh 758 15 1.98 19.43 1,569 13 0.83 38.92 2,436 32 1.31 54.76 1,573 20 1.27 35.36 2,834 26 0.92 63.712 North Sumatera 2,125 34 1.60 16.86 3,990 34 0.85 31.66 4,454 49 1.10 34.49 4,697 58 1.23 35.70 8,889 87 0.98 67.253 West Sumatera 1,067 13 1.22 23.87 2,189 24 1.10 48.05 1,907 11 0.58 40.59 2,813 18 0.64 59.75 1,795 5 0.28 38.134 Riau 948 18 1.90 21.04 795 15 1.89 18.46 828 10 1.21 15.96 1,563 27 1.73 29.29 991 26 2.62 18.275 Jambi 365 11 3.01 13.83 309 5 1.62 11.20 245 9 3.67 8.64 254 5 1.97 8.55 178 1 0.56 5.996 South Sumatera 2,272 2 0.09 32.48 3,480 13 0.37 48.17 2,360 3 0.13 33.62 1,854 6 0.32 25.67 1,161 5 0.43 16.077 Bengkulu 129 1 0.78 7.61 274 7 2.55 15.62 339 1 0.29 19.33 260 8 3.08 15.44 609 13 2.13 35.368 Lampung 1,402 14 1.00 20.08 4,470 23 0.51 64.01 4,807 40 0.83 68.83 1,862 20 1.07 24.85 1,716 28 1.63 25.599 Bangka Belitung Islands 58 0 0.00 5.80 145 2 1.38 13.67 34 0 0.00 3.07 349 16 4.58 31.54 205 9 4.39 18.5210 Riau Islands 969 28 2.89 74.79 950 11 1.16 73.33 1,724 22 1.28 122.08 1,828 14 0.77 115.60 1,507 14 0.93 88.3711 DKI Jakarta 24,932 39 0.16 316.17 31,836 86 0.27 392.64 28,361 26 0.09 317.09 28,032 32 0.11 313.41 19,273 33 0.17 227.4412 West Java 25,851 275 1.06 66.08 30,536 288 0.94 78.05 23,248 231 0.99 54.23 37,861 307 0.81 89.41 25,727 171 0.66 59.5413 Central Java 10,924 220 2.01 33.72 20,391 327 1.60 61.96 19,235 228 1.19 58.45 17,881 248 1.39 54.81 19,871 251 1.26 60.4614 DI Yogyakarta 2,184 23 1.05 66.22 2,462 26 1.06 74.65 2,119 21 0.99 61.72 2,203 15 0.68 63.89 4,997 34 0.68 144.9215 East Java 20,374 247 1.21 56.19 25,950 372 1.43 69.95 17,310 168 0.97 46.31 18,631 185 0.99 50.03 26,020 233 0.90 68.9216 Banten 2,306 35 1.52 26.92 5,587 98 1.75 65.22 3,954 53 1.34 46.16 5,250 70 1.33 56.39 5,544 119 2.15 55.2717 Bali 5,629 30 0.53 170.57 6,375 14 0.22 193.18 6,254 19 0.30 181.31 5,810 9 0.15 167.41 11,697 34 0.29 337.0418 West Nusa Tenggara 623 4 0.64 15.59 720 2 0.28 16.90 777 4 0.51 18.10 615 4 0.65 13.72 2,096 12 0.57 51.0219 East Nusa Tenggara 251 3 1.20 6.36 518 11 2.12 13.13 695 22 3.17 14.58 399 7 1.75 8.44 1,459 15 1.03 30.6020 West Kalimantan 2,659 35 1.32 65.94 508 7 1.38 12.98 947 32 3.38 22.29 9,792 171 1.75 228.30 589 16 2.72 13.8621 Central Kalimantan 513 4 0.78 27.42 696 8 1.15 35.54 531 7 1.32 27.11 1,309 16 1.22 65.25 1,394 7 0.50 62.8222 South Kalimantan 455 7 1.54 12.40 1,321 16 1.21 35.59 576 11 1.91 15.52 1,113 20 1.80 29.30 1,134 33 2.91 29.8623 East Kalimantan 2,714 76 2.80 103.64 5,341 102 1.91 193.15 5,762 105 1.82 202.83 5,244 68 1.30 173.84 5,610 42 0.75 167.3124 North Sulawesi 1,290 19 1.47 59.62 1,865 24 1.29 86.15 1,430 16 1.12 63.58 1,640 20 1.22 68.79 2,091 40 1.91 87.7025 Central Sulawesi 492 11 2.24 20.01 1,338 17 1.27 54.02 1,389 17 1.22 55.25 952 7 0.74 36.50 2,098 29 1.38 81.8026 South Sulawesi 2,612 22 0.84 35.03 2,732 30 1.10 36.79 3,538 27 0.76 46.37 3,411 23 0.67 44.71 4,083 33 0.81 49.0227 Southeast Sulawesi 95 3 3.16 4.73 944 7 0.74 48.20 1,006 9 0.89 46.21 692 12 1.73 31.86 986 13 1.32 45.2828 Gorontalo 302 2 0.66 32.90 236 4 1.69 25.71 172 4 2.33 18.20 91 2 2.20 9.19 467 8 1.71 46.1429 West Sulawesi 31 1 3.23 3.06 2 0 0.00 0.20 43 0 0.00 4.24 149 0 0.00 13.74 144 0 0.00 14.1930 Maluku 0 0 0.00 0.00 0 0 0.00 0.00 0 0 0.00 0.00 0 0 0.00 0.00 6 1 16.67 0.4231 North Maluku 138 4 2.90 16.09 275 7 2.55 29.22 250 7 2.80 25.25 384 7 1.82 38.89 347 12 3.46 33.6132 West Papua 128 0 0.00 22.69 208 2 0.96 28.76 510 2 0.39 90.41 204 2 0.98 28.21 298 0 0.00 52.8333 Papua 60 0 0.00 3.55 103 4 3.88 6.09 228 1 0.44 13.47 196 3 1.53 10.93 270 8 2.96 15.05<strong>Indonesia</strong>114,656 1,196 1.04 52.48 158,115 1,599 1.01 71.78 137,469 1,187 0.86 59.02 158,912 1,420 0.89 68.22 156,086 1,358 0.87 65.70Source: D: DG of PP & PL, Kemenkes RI, 2011Note : C = Cases, D = Deaths, CFR = Case Fatality Rate, IR = Incidence Rate
Annex 3.33NUMBER OF DISTRICTS/MUNICIPALITIES INFECTED BY DHFBY PROVINCE IN 2006 - <strong>2010</strong>Districts/ Districts/ Districts/ Districts/ Districts/YearNo.Provinces MunicipalitiesMunicipalitiesMunicipalitiesMunicipalitiesMunicipalities 20062007 2008 2009<strong>2010</strong>2006 2007 2008 2009 <strong>2010</strong> Infected % Infected % Infected % Infected % Infected %(1) (2) (3) (4) (5) (6) (7) (8) (9) (10) (11) (12) (13) (14) (15) (16) (17)1 Aceh 21 23 23 23 23 15 71.43 15 65.22 17 73.91 17 73.91 21 91.302 North Sumatera 25 28 33 33 33 19 76.00 20 71.43 22 66.67 22 66.67 22 66.673 West Sumatera 19 19 19 19 19 12 63.16 15 78.95 17 89.47 16 84.21 16 84.214 Riau 11 11 11 12 12 11 100.00 11 100.00 10 90.91 11 91.67 12 100.005 Jambi 10 10 11 11 11 10 100.00 8 80.00 9 81.82 7 63.64 7 63.646 South Sumatera 14 15 15 15 15 9 64.29 12 80.00 9 60.00 12 80.00 13 86.677 Bengkulu 9 9 10 10 10 7 77.78 9 100.00 9 90.00 10 100.00 10 100.008 Lampung 10 11 14 14 14 10 100.00 10 90.91 10 71.43 11 78.57 11 78.579 Bangka Belitung Islands 7 7 7 7 7 5 71.43 7 100.00 6 85.71 7 100.00 7 100.0010 Riau Islands 6 6 7 7 7 3 50.00 4 66.67 4 57.14 5 71.43 6 85.7111 DKI Jakarta 6 6 6 6 6 5 83.33 6 100.00 6 100.00 6 100.00 6 100.0012 West Java 25 26 26 26 26 25 100.00 25 96.15 26 100.00 26 100.00 26 100.0013 Central Java 35 35 35 35 35 35 100.00 35 100.00 35 100.00 35 100.00 35 100.0014 DI Yogyakarta 5 5 5 5 5 5 100.00 5 100.00 5 100.00 5 100.00 5 100.0015 East Java 38 38 38 38 38 38 100.00 38 100.00 38 100.00 38 100.00 38 100.0016 Banten 6 7 8 8 8 6 100.00 6 85.71 6 75.00 8 100.00 8 100.0017 Bali 9 9 9 9 9 9 100.00 9 100.00 9 100.00 9 100.00 9 100.0018 West Nusa Tenggara 9 9 10 10 10 8 88.89 8 88.89 8 80.00 7 70.00 9 90.0019 East Nusa Tenggara 16 20 21 21 21 1 6.25 5 25.00 5 23.81 6 28.57 9 42.8620 West Kalimantan 12 14 14 14 14 10 83.33 10 71.43 10 71.43 14 100.00 11 78.5721 Central Kalimantan 14 14 14 14 14 6 42.86 12 85.71 9 64.29 13 92.86 14 100.0022 South Kalimantan 13 13 13 13 13 12 92.31 13 100.00 13 100.00 13 100.00 13 100.0023 East Kalimantan 13 14 14 14 14 13 100.00 13 92.86 13 92.86 13 92.86 14 100.0024 North Sulawesi 9 13 15 15 15 9 100.00 9 69.23 9 60.00 11 73.33 12 80.0025 Central Sulawesi 10 10 11 11 11 7 70.00 9 90.00 9 81.82 9 81.82 11 100.0026 South Sulawesi 23 23 24 24 24 20 86.96 21 91.30 21 87.50 22 91.67 21 87.5027 Southeast Sulawesi 10 12 12 12 12 5 50.00 7 58.33 3 25.00 6 50.00 8 66.6728 Gorontalo 5 6 6 6 6 5 100.00 5 83.33 6 100.00 5 83.33 6 100.0029 West Sulawesi 5 5 5 5 5 2 40.00 1 20.00 1 20.00 4 80.00 4 80.0030 Maluku 8 9 11 11 11 0 0.00 0 0.00 0 0.00 0 0.00 1 9.0931 North Maluku 8 8 9 9 9 3 37.50 6 75.00 4 44.44 4 44.44 6 66.6732 West Papua 9 9 10 11 11 2 22.22 3 33.33 0 0.00 5 45.45 2 18.1833 Papua 20 21 29 29 29 3 15.00 4 19.05 6 20.69 7 24.14 7 24.14<strong>Indonesia</strong>440 465 495 497 497 330 75.00 361 77.63 355 71.72 384 77.26 400 80.48Source: DG of Disease Control and Environmental <strong>Health</strong>, MoH RI, 2011
Annex 3.34No.ProvincesDIARRHEA OUTBREAKSBY PROVINCE IN 2006 - <strong>2010</strong>2006 2007 2008 2009C D CFR C D CFR C D CFR C D CFR(1) (2) (3) (4) (5) (6) (7) (8) (9) (10) (11) (12) (13) (14) (15) (16) (17)1 Aceh 642 7 1.09 - - - 178 0 0.00 45 3 6.67 121 3 2.482 North Sumatera 1,264 13 1.03 1,078 23 2.13 636 12 1.89 - - - - - -3 West Sumatera 40 0 0.00 - - - - - - - - - 51 0 0.004 Riau - - - - - - - - - 86 0 0.00 116 1 0.865 Jambi - - - - - - - - - - - - - - -6 South Sumatera 46 0 0.00 - - - - - - - - - - - -7 Bengkulu 218 6 2.75 - - - - - - - - - - - -8 Lampung - - - - - - - - - 11 2 18.18 - - -9 Bangka Belitung Islands - - - - - - - - - - - - - - -10 Riau Islands - - - - - - - - - - - - - - -11 DKI Jakarta - - - - - - - - - - - - - - -12 West Java 1,722 18 1.05 174 2 1.15 380 2 0.53 1,425 14 0.98 1,068 5 0.4713 Central Java - - - - - - 216 1 0.46 95 6 6.32 35 1 2.8614 DI Yogyakarta - - - - - - - - - - - - - - -15 East Java 263 3 1.14 604 13 2.15 362 9 2.49 - - - 1,181 12 1.0216 Banten - - - 1,057 3 0.28 351 10 2.85 385 3 0.7817 Bali - - - - - - 1,047 4 0.38 - - - - - -18 West Nusa Tenggara 102 1 0.98 - - - 814 1 0.12 1,147 3 0.26 - - -19 East Nusa Tenggara 1,223 45 3.68 104 3 2.88 217 3 1.38 416 17 4.09 - - -20 West Kalimantan - - - - - - - - - - - - - - -21 Central Kalimantan 184 7 3.80 120 3 2.50 - - - - - - - - -22 South Kalimantan 488 7 1.43 163 6 3.68 - - - - - - - - -23 East Kalimantan 373 3 0.80 - - - - - - - - -24 North Sulawesi 50 1 2.00 - - - - - - - - - - - -25 Central Sulawesi - - - 66 11 16.67 106 2 1.89 437 21 4.81 817 30 3.6726 South Sulawesi 46 0 0.00 - - - 41 1 2.44 37 1 2.70 169 4 2.3727 Southeast Sulawesi 269 7 2.60 293 5 1.71 229 5 2.18 - - - - - -28 Gorontalo 177 12 6.78 - - - - - - - - - - - -29 West Sulawesi 40 0 0 - - - 2,023 23 1.14 423 10 2.36 - - -30 Maluku - - - - - - 130 18 13.85 - - - - - -31 North Maluku 133 6 4.51 - - - 169 14 8.28 205 3 1.46 - - -32 West Papua 6,544 158 2.41 - - - 1,585 144 9.09 473 7 1.48 37 8 21.6233 Papua - - - - - - - - - 605 3 0.50 224 6 2.68<strong>Indonesia</strong>13,451 291 2.16 4,032 72 1.79 8,133 239 2.94 5,756 100 1.74 4,204 73 1.74Source: DG of Disease Control and Environmental <strong>Health</strong>, MoH RI, 2011Ket . : C = Cases, D = Deaths, CFR = Case Fatality RateC<strong>2010</strong>DCFR
Annex 3.35NUMBER OF CHIKUNGUNYA CASESBY PROVINCE IN <strong>2010</strong>No.ProvincesCasesInfected AreasPeriodCases Deaths Districts/Municipalities(1) (2) (3) (4) (5) (6)1 Aceh 376 0 8 January-December2 North Sumatera - - - -3 West Sumatera 77 0 2 January-June4 Riau - - - -5 Jambi - - - -6 South Sumatera 1,506 0 1 January-April7 Bengkulu - - - -8 Lampung 27,087 0 13 Januar-June9 Bangka Belitung Islands 225 0 1 January-May10 Riau Islands - - - -11 DKI Jakarta 528 0 4 January-May12 West Java 4,441 0 9 January-October13 Central Java 345 0 - January-December14 DI Yogyakarta 568 0 2 January15 East Java 4,763 0 6 January-May16 Banten 192 0 1 January17 Bali 246 0 2 March-August18 West Nusa Tenggara 2,200 0 4 January-September19 East Nusa Tenggara - - - -20 West Kalimantan 492 0 1 January-May21 Central Kalimantan - - - -22 South Kalimantan 9,133 0 12 January-October23 East Kalimantan 378 0 3 January-May24 North Sulawesi 157 0 1 June25 Central Sulawesi 851 0 - September-December26 South Sulawesi 41 0 1 May27 Southeast Sulawesi - - - -28 Gorontalo 293 0 3 May-November29 West Sulawesi - - - -30 Maluku - - - -31 North Maluku - - - -32 West Papua - - - -33 Papua - - - -<strong>Indonesia</strong>53,899 0 74Source: DG of Disease Control and Environmental <strong>Health</strong>, MoH RI, 2011
Annex 3.36RABIES CASES IN INDONESIA IN 2008-<strong>2010</strong>No.Provinces2008 2009 <strong>2010</strong>GHPR VAR LYSSA GHPR VAR LYSSA GHPR VAR LYSSA(1) (2) (3) (4) (5) (6) (7) (8) (9) (10) (11)1 Aceh 269 248 0 329 294 5 524 471 02 North Sumatera 2,660 2,073 7 2,386 1,718 18 3,714 2,848 353 West Sumatera 2,374 1,688 7 2,818 2,061 14 858 514 54 Riau 791 560 1 653 636 5 1,293 1,082 25 Jambi 480 382 0 502 303 0 704 475 36 South Sumatera 883 769 2 2,123 1,518 9 144 75 27 Bengkulu 353 265 4 575 422 0 261 181 08 Lampung 886 466 10 1,274 1,095 7 1,018 76 39 Bangka Belitung Islands 0 0 0 0 0 0 0 0 010 Riau Islands 0 0 0 9 0 1 1 0 111 DKI Jakarta 0 0 0 0 0 0 0 0 012 West Java 651 489 3 288 83 0 294 183 113 Central Java 13 0 0 0 0 0 0 0 014 DI Yogyakarta 12 9 0 0 0 0 0 0 015 East Java 0 0 0 0 0 0 0 0 016 Banten 110 50 0 264 105 2 119 106 017 Bali 355 325 4 21,806 18,825 28 60,434 52,775 8218 West Nusa Tenggara 0 0 0 0 0 0 0 0 019 East Nusa Tenggara 3,414 3,061 25 3,882 3,237 33 3,547 2,154 2520 West Kalimantan 0 0 0 0 0 0 0 0 021 Central Kalimantan 385 256 3 629 346 1 566 390 122 South Kalimantan 165 125 4 110 104 0 65 53 023 East Kalimantan 197 131 0 240 173 1 42 2 024 North Sulawesi 1,917 534 14 1,859 689 12 1,412 439 1025 Central Sulawesi 391 246 5 605 512 4 591 371 326 South Sulawesi 1,015 913 5 947 827 3 99 85 027 Southeast Sulawesi 2,554 1,070 16 1,994 805 4 1,267 478 428 Gorontalo 238 107 1 284 139 5 325 127 229 West Sulawesi 101 85 1 325 215 0 97 50 530 Maluku 844 650 3 1,288 933 35 778 359 2131 North Maluku 187 181 7 276 276 8 50 40 132 West Papua 0 0 0 0 0 0 0 0 033 Papua 0 0 0 0 0 0 0 0 0<strong>Indonesia</strong>21,245 14,683 122 45,466 35,316 195 78,203 63,334 206Persentase (%) 69.1% 77.68% 80.99%Source: DG of Disease Control and Environmental <strong>Health</strong>, MoH RI, 2011Ket : GHPR = Animal bites infected Rabies, VAR = Vaccinated cases
Annex 3.37NUMBER OF FILARIASIS CASESBY PROVINCE IN 2006 - <strong>2010</strong>No.Provinces2006 2007 2008 2009 <strong>2010</strong>(1) (2) (3) (4) (5) (6) (7)1 Aceh 2,359 2,359 2,359 2,359 2,3592 North Sumatera 104 104 141 141 1413 West Sumatera 231 274 274 274 2744 Riau 532 532 532 532 5325 Jambi 255 255 257 257 2216 South Sumatera 191 191 210 210 2107 Bengkulu 94 94 94 94 948 Lampung 74 74 74 74 749 Bangka Belitung Islands 151 207 207 207 20710 Riau Islands 31 31 31 31 3111 DKI Jakarta 53 53 53 53 5312 West Java 252 265 404 474 47413 Central Java 224 395 395 412 41214 DI Yogyakarta 5 37 37 37 3715 East Java 207 238 219 219 21916 Banten 67 67 91 76 7617 Bali 18 18 18 18 1818 West Nusa Tenggara 62 69 71 71 7119 East Nusa Tenggara 1,682 1,682 1,682 1,730 1,73020 West Kalimantan 232 244 253 253 25321 Central Kalimantan 202 226 225 225 22522 South Kalimantan 385 385 385 385 38523 East Kalimantan 409 409 409 409 40924 North Sulawesi 30 30 30 30 3025 Central Sulawesi 451 451 451 451 45126 South Sulawesi 60 60 60 128 12827 Southeast Sulawesi 181 208 208 201 10728 Gorontalo 224 224 224 224 22429 West Sulawesi 92 92 96 96 9630 Maluku 70 70 70 70 7031 North Maluku 12 12 27 27 2732 West Papua 355 985 985 988 98833 Papua 1,132 1,132 1,127 1,158 1,343<strong>Indonesia</strong>10,427 11,473 11,699 11,914 11,969Source: DG of Disease Control and Environmental <strong>Health</strong>, MoH RI, 2011Cases
Annex 3.38PEST SITUATION BY PROVINCE IN <strong>2010</strong>No. Provinces istricts/Municipalitie Tested Specimens Positive Specimens Pool SpecimensHuman Rodent Human Rodent Tested Positive(1) (2) (3) (4) (5) (6) (7) (8) (9)1 Aceh 0 0 0 0 0 0 02 North Sumatera 0 0 0 0 0 0 03 West Sumatera 0 0 0 0 0 0 04 Riau 0 0 0 0 0 0 05 Jambi 0 0 0 0 0 0 06 South Sumatera 0 0 0 0 0 0 07 Bengkulu 0 0 0 0 0 0 08 Lampung 0 0 0 0 0 0 09 Bangka Belitung Islands 0 0 0 0 0 0 010 Riau Islands 0 0 0 0 0 0 011 DKI Jakarta 0 0 0 0 0 0 012 West Java 0 0 0 0 0 0 013 Central Java 0 0 0 0 0 0 014 DI Yogyakarta Sleman 0 407 0 34 0 015 East Java Pasuruan 1 0 0 0 0 016 Banten 0 0 0 0 0 0 017 Bali 0 0 0 0 0 0 018 West Nusa Tenggara 0 0 0 0 0 0 019 East Nusa Tenggara - - - - - - -20 West Kalimantan 0 0 0 0 0 0 021 Central Kalimantan - - - - - - -22 South Kalimantan 0 0 0 0 0 0 023 East Kalimantan 0 0 0 0 0 0 024 North Sulawesi 0 0 0 0 0 0 025 Central Sulawesi 0 0 0 0 0 0 026 South Sulawesi 0 0 0 0 0 0 027 Southeast Sulawesi - - - - - - -28 Gorontalo 0 0 0 0 0 0 029 West Sulawesi - - - - - - -30 Maluku - - - - - - -31 North Maluku - - - - - - -32 West Papua - - - - - - -33 Papua - - - - - - -<strong>Indonesia</strong>1 407 0 34 0 0Source: DG of Disease Control and Environmental <strong>Health</strong>, MoH RI, 2011
Annex 3.39NUMBER OF LEPTOSPYROSIS CASES, DEATHS, AND CASE FATALITY RATE (CFR)BY PROVINCE IN 2004 - <strong>2010</strong>No.Provinces2005 2006 20072008 2009 <strong>2010</strong>C D CFR C D CFR C D CFR C D CFR C D CFR C D CFR(1) (2) (3) (4) (5) (6) (7) (8) (9) (10) (11) (12) (13) (14) (15) (16) (17) (18) (19) (20)1 Aceh 0 0 0.0 49 0 0.0 0 0 0.0 0 0 0.0 0 0 0.0 0 0 0.02 North Sumatera 0 0 0.0 0 0 0.0 0 0 0.0 0 0 0.0 0 0 0.0 0 0 0.03 West Sumatera 0 0 0.0 0 0 0.0 0 0 0.0 0 0 0.0 0 0 0.0 0 0 0.04 Riau 0 0 0.0 0 0 0.0 0 0 0.0 0 0 0.0 0 0 0.0 0 0 0.05 Jambi 0 0 0.0 0 0 0.0 0 0 0.0 0 0 0.0 0 0 0.0 0 0 0.06 South Sumatera 0 0 0.0 0 0 0.0 0 0 0.0 0 0 0.0 0 0 0.0 0 0 0.07 Bengkulu 0 0 0.0 0 0 0.0 0 0 0.0 0 0 0.0 0 0 0.0 0 0 0.08 Lampung 0 0 0.0 0 0 0.0 0 0 0.0 0 0 0.0 0 0 0.0 0 0 0.09 Bangka Belitung Islands 0 0 0.0 0 0 0.0 0 0 0.0 0 0 0.0 0 0 0.0 0 0 0.010 Riau Islands 0 0 0.0 0 0 0.0 0 0 0.0 0 0 0.0 0 0 0.0 0 0 0.011 DKI Jakarta 56 0 0.0 51 0 0.0 470 34 7.2 141 2 1.4 8 2 25.0 15 0 0.012 West Java 0 0 0.0 0 0 0.0 9 1 11.1 0 0 0.0 0 0 0.0 1 0 0.013 Central Java 35 10 28.6 35 9 25.7 67 6 9.0 231 15 6.5 232 14 6.0 133 14 10.514 DI Yogyakarta 16 2 12.5 9 3 33.3 1 1 100.0 23 2 8.7 95 7 7.4 230 23 10.015 East Java 0 0 0.0 0 0 0.0 48 4 8.3 31 3 9.7 0 0 0.0 19 6 31.616 Banten 0 0 0.0 0 0 0.0 53 4 7.5 0 0 0.0 0 0 0.0 0 0 0.017 Bali 0 0 0.0 0 0 0.0 0 0 0.0 0 0 0.0 0 0 0.0 0 0 0.018 West Nusa Tenggara 0 0 0.0 0 0 0.0 0 0 0.0 0 0 0.0 0 0 0.0 0 0 0.019 East Nusa Tenggara 0 0 0.0 0 0 0.0 0 0 0.0 0 0 0.0 0 0 0.0 0 0 0.020 West Kalimantan 0 0 0.0 0 0 0.0 0 0 0.0 0 0 0.0 0 0 0.0 0 0 0.021 Central Kalimantan 0 0 0.0 0 0 0.0 0 0 0.0 0 0 0.0 0 0 0.0 0 0 0.022 South Kalimantan 0 0 0.0 0 0 0.0 0 0 0.0 0 0 0.0 0 0 0.0 0 0 0.023 East Kalimantan 0 0 0.0 0 0 0.0 0 0 0.0 0 0 0.0 0 0 0.0 0 0 0.024 North Sulawesi 0 0 0.0 0 0 0.0 0 0 0.0 0 0 0.0 0 0 0.0 0 0 0.025 Central Sulawesi 0 0 0.0 0 0 0.0 0 0 0.0 0 0 0.0 0 0 0.0 0 0 0.026 South Sulawesi 8 2 25.0 2 2 100.0 16 5 31.3 0 0 0.0 0 0 0.0 11 0 0.027 Southeast Sulawesi 0 0 0.0 0 0 0.0 0 0 0.0 0 0 0.0 0 0 0.0 0 0 0.028 Gorontalo 0 0 0.0 0 0 0.0 0 0 0.0 0 0 0.0 0 0 0.0 0 0 0.029 West Sulawesi 0 0 0.0 0 0 0.0 0 0 0.0 0 0 0.0 0 0 0.0 0 0 0.030 Maluku 0 0 0.0 0 0 0.0 0 0 0.0 0 0 0.0 0 0 0.0 0 0 0.031 North Maluku 0 0 0.0 0 0 0.0 0 0 0.0 0 0 0.0 0 0 0.0 0 0 0.032 West Papua 0 0 0.0 0 0 0.0 0 0 0.0 0 0 0.0 0 0 0.0 0 0 0.033 Papua 0 0 0.0 0 0 0.0 0 0 0.0 0 0 0.0 0 0 0.0 0 0 0.0<strong>Indonesia</strong>115 14 12.17 146 14 9.59 664 55 8.28 426 22 5.16 335 23 6.87 409 43 10.51Source: DG of Disease Control and Environmental <strong>Health</strong>, MoH RI, 2011Note : C= Cases, D= Deaths
Annex 3.40NUMBER OF ANTRAX CASES ON HUMANBY PROVINCE IN 2006 - <strong>2010</strong>2006 2007 2008 2009 <strong>2010</strong>No.ProvincesCases Treated Deaths Cases Treated Deaths Cases Treated Deaths Cases Treated Deaths Cases Treated Deaths(1) (2) (3) (4) (5) (6) (7) (8) (9) (10) (11) (12) (13) (14) (15) (16) (17)1 Aceh 0 0 0 0 0 0 0 0 0 0 0 0 0 0 02 North Sumatera 0 0 0 0 0 0 0 0 0 0 0 0 0 0 03 West Sumatera 0 0 0 0 0 0 0 0 0 0 0 0 0 0 04 Riau 0 0 0 0 0 0 0 0 0 0 0 0 0 0 05 Jambi 0 0 0 0 0 0 0 0 0 0 0 0 0 0 06 South Sumatera 0 0 0 0 0 0 0 0 0 0 0 0 0 0 07 Bengkulu 0 0 0 0 0 0 0 0 0 0 0 0 0 0 08 Lampung 0 0 0 0 0 0 0 0 0 0 0 0 0 0 09 Bangka Belitung Islands 0 0 0 0 0 0 0 0 0 0 0 0 0 0 010 Riau Islands 0 0 0 0 0 0 0 0 0 0 0 0 0 0 011 DKI Jakarta 0 0 0 0 0 0 2 2 0 0 0 0 0 0 012 West Java 8 7 1 18 18 0 18 18 0 0 0 0 0 0 013 Central Java 0 0 0 0 0 0 0 0 0 0 0 0 24 24 114 DI Yogyakarta 0 0 0 0 0 0 0 0 0 0 0 0 0 0 015 East Java 0 0 0 0 0 0 0 0 0 0 0 0 0 0 016 Banten 0 0 0 0 0 0 0 0 0 0 0 0 0 0 017 Bali 0 0 0 0 0 0 0 0 0 0 0 0 0 0 018 West Nusa Tenggara 7 7 0 0 0 0 0 0 0 0 0 0 0 0 019 East Nusa Tenggara 0 0 0 56 51 5 0 0 0 0 0 0 0 0 020 West Kalimantan 0 0 0 0 0 0 0 0 0 0 0 0 0 0 021 Central Kalimantan 0 0 0 0 0 0 0 0 0 0 0 0 0 0 022 South Kalimantan 0 0 0 0 0 0 0 0 0 0 0 0 0 0 023 East Kalimantan 0 0 0 0 0 0 0 0 0 0 0 0 0 0 024 North Sulawesi 0 0 0 0 0 0 0 0 0 0 0 0 0 0 025 Central Sulawesi 0 0 0 0 0 0 0 0 0 0 0 0 0 0 026 South Sulawesi 0 0 0 0 0 0 0 0 0 17 15 2 7 4 027 Southeast Sulawesi 0 0 0 0 0 0 0 0 0 0 0 0 0 0 028 Gorontalo 0 0 0 0 0 0 0 0 0 0 0 0 0 0 029 West Sulawesi 0 0 0 0 0 0 0 0 0 0 0 0 0 0 030 Maluku 0 0 0 0 0 0 0 0 0 0 0 0 0 0 031 North Maluku 0 0 0 0 0 0 0 0 0 0 0 0 0 0 032 West Papua 0 0 0 0 0 0 0 0 0 0 0 0 0 0 033 Papua 0 0 0 0 0 0<strong>Indonesia</strong>15 14 1 74 69 5 20 20 0 17 15 2 31 28 1Source: DG of Disease Control and Environmental <strong>Health</strong>, MoH RI, 2011
Annex 3.41NUMBER OF AVIAN INFLUENZA CASES, DEATHS, AND CASE FATALITY RATE (%)BY PROVINCE IN 2005 - <strong>2010</strong>2005 2006 20072008 2009<strong>2010</strong> Total Cumulative (2005-<strong>2010</strong>)No.ProvincesC D CFR C D CFR C D CFR C D CFR C D CFR C D CFR C D CFR(1) (2) (3) (4) (5) (6) (7) (8) (9) (10) (11) (12) (13) (14) (15) (16) (17) (18) (19) (20) (21) (22) (23)1 Aceh 0 0 0.0 0 0 0.0 0 0 0.0 0 0 0.0 0 0 0.0 0 0 0.0 0 0 0.02 North Sumatera 0 0 0.0 7 6 85.7 1 1 100.0 0 0 0.0 - - - - - - 8 7 87.53 West Sumatera 0 0 0.0 2 0 0.0 1 1 100.0 1 0 0.0 - - - - - - 4 1 25.04 Riau 0 0 0.0 0 0 0.0 6 5 83.3 1 0 0.0 1 1 100.0 1 1 100.0 9 7 77.85 Jambi 0 0 0.0 0 0 0.0 0 0 0.0 0 0 0.0 0 0 0.0 0 0 0.0 0 0 0.06 South Sumatera 0 0 0.0 0 0 0.0 1 1 100.0 0 0 0.0 - - - - - - 1 1 100.07 Bengkulu 0 0 0.0 0 0 0.0 0 0 0.0 0 0 0.0 0 0 0.0 0 0 0.0 0 0 0.08 Lampung 3 0 0.0 0 0 0.0 0 0 0.0 0 0 0.0 - - - - - - 3 0 0.09 Bangka Belitung Islands 0 0 0.0 0 0 0.0 0 0 0.0 0 0 0.0 0 0 0.0 0 0 0.0 0 0 0.010 Riau Islands 0 0 0.0 0 0 0.0 0 0 0.0 0 0 0.0 0 0 0.0 0 0 0.0 0 0 0.011 DKI Jakarta 8 7 87.5 11 10 90.9 8 7 87.5 7 5 71.4 10 8 80.0 3 3 100.0 47 40 85.112 West Java 3 2 66.7 22 18 81.8 5 4 80.0 4 4 100.0 6 6 100.0 2 1 50.0 42 35 83.313 Central Java 1 0 0.0 3 3 100.0 5 5 100.0 2 2 100.0 1 1 100.0 1 1 100.0 13 12 92.314 DI Yogyakarta 0 0 0.0 0 0 0.0 0 0 0.0 0 0 0.0 1 1 100.0 - - - 1 1 100.015 East Java 0 0 0.0 5 3 60.0 2 2 100.0 0 0 0.0 1 1 100.0 1 0 0.0 9 6 66.716 Banten 5 4 80.0 4 4 100.0 11 9 81.8 9 9 100.0 1 1 100.0 1 1 100.0 31 28 90.317 Bali 0 0 0.0 0 0 0.0 2 2 100.0 0 0 0.0 - - - - - - 2 2 100.018 West Nusa Tenggara 0 0 0.0 0 0 0.0 0 0 0.0 0 0 0.0 0 0 0.0 0 0 0.0 0 0 0.019 East Nusa Tenggara 0 0 0.0 0 0 0.0 0 0 0.0 0 0 0.0 0 0 0.0 0 0 0.0 0 0 0.020 West Kalimantan 0 0 0.0 0 0 0.0 0 0 0.0 0 0 0.0 0 0 0.0 0 0 0.0 0 0 0.021 Central Kalimantan 0 0 0.0 0 0 0.0 0 0 0.0 0 0 0.0 0 0 0.0 0 0 0.0 0 0 0.022 South Kalimantan 0 0 0.0 0 0 0.0 0 0 0.0 0 0 0.0 0 0 0.0 0 0 0.0 0 0 0.023 East Kalimantan 0 0 0.0 0 0 0.0 0 0 0.0 0 0 0.0 0 0 0.0 0 0 0.0 0 0 0.024 North Sulawesi 0 0 0.0 0 0 0.0 0 0 0.0 0 0 0.0 0 0 0.0 0 0 0.0 0 0 0.025 Central Sulawesi 0 0 0.0 0 0 0.0 0 0 0.0 0 0 0.0 0 0 0.0 0 0 0.0 0 0 0.026 South Sulawesi 0 0 0.0 1 1 100.0 0 0 0.0 0 0 0.0 - - - - - - 1 1 100.027 Southeast Sulawesi 0 0 0.0 0 0 0.0 0 0 0.0 0 0 0.0 0 0 0.0 0 0 0.0 0 0 0.028 Gorontalo 0 0 0.0 0 0 0.0 0 0 0.0 0 0 0.0 0 0 0.0 0 0 0.0 0 0 0.029 West Sulawesi 0 0 0.0 0 0 0.0 0 0 0.0 0 0 0.0 0 0 0.0 0 0 0.0 0 0 0.030 Maluku 0 0 0.0 0 0 0.0 0 0 0.0 0 0 0.0 0 0 0.0 0 0 0.0 0 0 0.031 North Maluku 0 0 0.0 0 0 0.0 0 0 0.0 0 0 0.0 0 0 0.0 0 0 0.0 0 0 0.032 West Papua 0 0 0.0 0 0 0.0 0 0 0.0 0 0 0.0 0 0 0.0 0 0 0.0 0 0 0.033 Papua 0 0 0.0 0 0 0.0 0 0 0.0 0 0 0.0 0 0 0.0 0 0 0.0 0 0 0.0<strong>Indonesia</strong>20 13 65.0 55 45 81.8 42 37 88.1 24 20 83.3 21 19 90.5 9 7 77.8 171 141 82.5Source: DG of Disease Control and Environmental <strong>Health</strong>, MoH RI, 2011Note : C= Cases, D= Deaths
Lampiran 4.1COVERAGE OF 1 st AND 4 th VISITS OF PREGNANT WOMEN AND DELIVERY ATTENDED BY SKILLED HEALTH PERSONNELBY PROVINCE, <strong>2010</strong>Pregnant WomenDelivering MothersPostpartum MothersNoProvincesTotal 1 st Visit %1 st Visit 4 th Visit %4 th Visit TotalAttended by healthpersonnel% Attended byhealth personnelPostpartumvisit (3x)% postpartumvisits (3x)(1) (2) (3) (4) (5) (6) (7) (8) (9) (10) (9) (10)1 Aceh 113,584 104,208 91.75 94,347 83.06 100,499 83,318 82.90 77,511 77.132 North Sumatera 323,082 305,330 94.51 285,328 88.31 307,891 259,853 84.40 160,217 52.043 West Sumatera 114,090 107,729 94.42 103,005 90.28 108,902 97,445 89.48 55,464 50.934 Riau 137,524 136,399 99.18 125,373 91.16 119,687 109,410 91.41 87,400 73.025 Jambi 76,957 73,560 95.59 67,802 88.10 73,132 63,464 86.78 55,713 76.186 South Sumatera 191,287 179,252 93.71 167,217 87.42 190,243 156,237 82.12 146,829 77.187 Bengkulu 48,051 44,136 91.85 40,944 85.21 45,839 36,509 79.65 32,144 70.128 Lampung 188,374 171,785 91.19 159,060 84.44 179,811 143,048 79.55 142,488 79.249 Bangka Belitung Island 28,191 27,832 98.73 25,825 91.61 26,931 24,532 91.09 23,018 85.4710 Riau Island 42,935 31,572 73.53 29,758 69.31 41,277 26,670 64.61 21,317 51.6411 DKI Jakarta 159,281 160,888 101.01 149,735 94.01 152,041 139,289 91.61 110,533 72.7012 West Java 1,039,072 1,002,470 96.48 906,651 87.26 991,842 824,386 83.12 789,834 79.6313 Central Java 632,226 609,315 96.38 568,850 89.98 590,303 542,478 91.90 422,464 71.5714 DI Yogyakarta 47,928 47,548 99.21 39,663 82.76 42,640 36,911 86.56 37,971 89.0515 East Java 654,382 642,717 98.22 576,297 88.07 600,949 571,133 95.04 575,828 95.8216 Banten 231,382 232,271 100.38 195,349 84.43 220,944 171,992 77.84 124,451 56.3317 Bali 68,193 67,873 99.53 62,895 92.23 65,066 64,286 98.80 62,909 96.6818 West Nusa Tenggara 116,343 115,661 99.41 102,883 88.43 112,399 94,427 84.01 96,949 86.2519 East Nusa Tenggara 128,179 103,096 80.43 72,285 56.39 122,330 84,316 68.93 67,443 55.1320 West Kalimantan 108,650 101,629 93.54 91,717 84.42 103,654 79,825 77.01 70,632 68.1421 Central Kalimantan 52,186 48,033 92.04 42,216 80.90 49,492 39,571 79.95 30,257 61.1422 South Kalimantan 78,372 76,407 97.49 68,341 87.20 74,251 65,928 88.79 65,016 87.5623 East Kalimantan 85,215 82,366 96.66 70,125 82.29 82,103 64,257 78.26 53,946 65.7124 North Sulawesi 42,874 39,052 91.09 35,218 82.14 41,077 33,593 81.78 29,189 71.0625 Central Sulawesi 54,169 52,139 96.25 47,389 87.48 51,709 43,874 84.85 10,093 19.5226 South Sulawesi 179,374 177,395 98.90 157,146 87.61 171,221 149,353 87.23 118,065 68.9527 Southeast Sulawesi 47,529 45,475 95.68 40,746 85.73 42,813 36,878 86.14 36,022 84.1428 Gorontalo 29,265 27,856 95.19 24,452 83.55 26,296 21,903 83.29 19,972 75.9529 West Sulawesi 27,502 27,119 98.61 20,490 74.50 26,251 19,033 72.50 18,927 72.1030 Maluku 39,662 35,029 88.32 29,115 73.41 37,891 26,529 70.01 26,573 70.1331 North Maluku 25,469 21,320 83.71 19,652 77.16 24,409 16,821 68.91 16,193 66.3432 West Papua 18,703 14,872 79.52 8,983 48.03 17,853 11,778 65.97 6,388 35.7833 Papua 61,083 32,712 53.55 12,766 20.90 57,260 14,428 25.20 8,139 14.21<strong>Indonesia</strong>5,191,116 4,945,046 95.26 4,441,623 85.56 4,899,006 4,153,475 84.78 3,599,895 73.48Source : DG of Nutrition and Maternal and Chilren <strong>Health</strong> Care, MoH RI
Annex 4.2PERCENTAGE OF WOMEN AGE 10-59 YEARS BY PREGNANT WOMEN CARE COVERAGE(K1 AND K4 ) BY LAST PREGNANCY PER PROVINCE, RISKESDAS <strong>2010</strong>Pregnant Women AttendanceNoProvince1 st Visit (K1 ) 4 th Visit (K4 )Access/K11 st quarter period Quarter period (1,1,2)(1) (2) (3) (4) (5)1 Aceh 94.1 78.4 62.12 North Sumatera 88.0 71.1 51.53 West Sumatera 94.1 64.1 54.74 Riau 88.4 68.3 52.25 Jambi 78.6 50.2 40.56 South Sumatera 90.1 64.9 49.47 Bengkulu 92.1 68.0 55.88 Lampung 94.2 76.0 59.79 Bangka Belitung Island 94.6 76.9 67.410 Riau Island 98.4 85.8 77.111 DKI Jakarta 97.9 89.2 84.312 West Java 95.5 75.5 67.213 Central Java 98.1 83.1 74.414 DI Yogyakarta 100.0 91.5 89.015 East Java 96.7 81.5 74.616 Banten 89.8 64.5 54.517 Bali 96.4 85.9 77.818 West Nusa Tenggara 93.0 66.2 53.419 East Nusa Tenggara 85.9 55.4 44.420 West Kalimantan 78.3 63.4 46.721 Central Kalimantan 77.2 47.3 35.522 South Kalimantan 95.0 62.2 48.423 East Kalimantan 91.9 71.1 58.424 North Sulawesi 91.1 62.0 53.025 Central Sulawesi 79.9 48.8 30.126 South Sulawesi 93.1 62.7 44.527 Southeast Sulawesi 82.1 36.5 21.328 Gorontalo 78.1 25.9 19.729 West Sulawesi 87.9 40.7 24.630 Maluku 85.3 52.7 35.131 North Maluku 81.4 41.5 32.532 West Papua 71.3 45.5 34.733 Papua 76.8 54.1 40.1<strong>Indonesia</strong> 92.7 72.3 61.4Source: National Board of <strong>Health</strong> Research and Development, MoH RI, Riskesdas <strong>2010</strong>
Annex 4.3NoProvincesObstetricianPERCENTAGE OF WOMEN AGE 10-59 YEARS FOR LAST CHILD PREGNANCYBY PERSONNEL HEALTH AND PROVINCE, RISKESDAS <strong>2010</strong>Pre Natal Examination by <strong>Health</strong> PersonnelPhysicianMidwifehealth personnel(1) (2) (3) (4) (5) (6) (7) (8) (9) (10)1 Aceh 31.7 1.1 61.4 0.5 94.7 0.2 3.1 2.12 North Sumatera 12.5 1.6 74.0 0.7 88.8 0.0 4.9 6.43 West Sumatera 23.1 3.6 67.5 0.4 94.6 0.0 2.3 3.24 Riau 21.6 1.2 65.6 1.5 89.9 0.0 5.6 4.55 Jambi 15.5 1.1 61.9 3.4 81.9 0.0 13.2 4.96 South Sumatera 13.9 2.7 73.5 1.0 91.1 0.0 4.1 4.87 Bengkulu 7.1 0.9 84.1 0.0 92.1 0.0 2.8 5.18 Lampung 7.7 1.2 85.3 0.5 94.7 0.0 3.5 1.99 Bangka Belitung Island 20.3 1.2 73.1 0.0 94.6 0.4 3.5 1.510 Riau Island 49.5 1.4 47.6 0.7 99.2 0.0 0.4 0.511 DKI Jakarta 37.4 1.7 58.7 0.1 97.9 0.7 0.4 0.912 West Java 18.9 1.3 75.3 0.3 95.8 0.3 2.4 1.613 Central Java 20.7 1.0 76.4 0.2 98.3 0.2 0.4 1.114 DI Yogyakarta 34.7 2.1 63.2 0.0 100.0 0.0 0.0 0.015 East Java 21.7 1.1 73.8 0.5 97.1 0.3 1.2 1.416 Banten 17.4 1.4 71.0 0.0 89.8 0.2 6.9 3.117 Bali 38.8 1.9 55.8 0.5 97.0 1.0 0.6 1.518 West Nusa Tenggara 8.8 2.9 81.2 1.5 94.4 0.0 2.3 3.219 East Nusa Tenggara 9.8 3.7 72.5 0.7 86.7 0.3 7.5 5.520 West Kalimantan 12.1 0.8 65.3 3.5 81.7 0.3 8.4 9.521 Central Kalimantan 9.3 1.9 65.9 4.0 81.1 0.0 12.3 6.522 South Kalimantan 16.2 2.8 75.9 0.2 95.1 0.3 2.9 1.623 East Kalimantan 32.4 3.6 55.8 1.4 93.2 0.0 3.2 3.524 North Sulawesi 32.6 4.8 53.7 4.7 95.8 0.4 0.8 2.925 Central Sulawesi 7.6 4.1 68.2 5.7 85.6 1.0 5.8 7.526 South Sulawesi 18.2 2.0 73.0 1.7 94.9 0.2 1.3 3.727 Southeast Sulawesi 9.4 2.3 70.4 1.1 83.2 0.0 11.8 5.028 Gorontalo 14.1 2.9 61.1 1.3 79.4 0.7 9.0 11.029 West Sulawesi 9.5 3.7 74.7 0.6 88.5 0.6 6.0 5.030 Maluku 16.6 2.4 66.3 0.5 85.8 0.0 8.8 5.531 North Maluku 13.3 1.4 66.8 0.6 82.1 0.6 8.4 9.032 West Papua 22.8 3.5 45.0 3.9 75.2 0.0 7.6 17.333 Papua 20.1 2.4 54.3 1.4 78.2 0.9 6.3 14.7<strong>Indonesia</strong> 19.7 1.7 71.4 0.8 93.6 0.2 3.2 3.0Source: National Board of <strong>Health</strong> Research and Development, MoH RI, Riskesdas <strong>2010</strong>Nurse/mantriPre natalexamination byOthersHealerNever Check
Annex 4.4PERCENTAGE OF WOMEN AGE 10-59 YEARS HAD CESARIAN SECTION FOR LAST CHILDIN LAST FIVE YEARS PERIOD BY PROVINCE, RISKESDAS <strong>2010</strong>NoProvincesCesarian SectionYesNo(1) (2) (3) (4)1 Aceh 13.8 86.22 North Sumatera 13.5 86.53 West Sumatera 23.1 76.94 Riau 13.6 86.45 Jambi 11.7 88.36 South Sumatera 10.3 89.77 Bengkulu 11.9 88.18 Lampung 11.3 88.79 Bangka Belitung Island 18.3 81.710 Riau Island 24.7 75.311 DKI Jakarta 27.2 72.812 West Java 15.1 84.913 Central Java 16.6 83.414 DI Yogyakarta 20.8 79.215 East Java 17.0 83.016 Banten 16.8 83.217 Bali 18.3 81.718 West Nusa Tenggara 10.2 89.819 East Nusa Tenggara 12.6 87.420 West Kalimantan 9.3 90.721 Central Kalimantan 8.4 91.622 South Kalimantan 13.4 86.623 East Kalimantan 17.0 83.024 North Sulawesi 18.2 81.825 Central Sulawesi 8.0 92.026 South Sulawesi 14.8 85.227 Southeast Sulawesi 5.5 94.528 Gorontalo 8.3 91.729 West Sulawesi 7.6 92.430 Maluku 15.6 84.431 North Maluku 12.2 87.832 West Papua 10.0 90.033 Papua 9.5 90.5<strong>Indonesia</strong>15.3 84.7Source: National Board of <strong>Health</strong> Research and Development, MoH RI, Riskesdas <strong>2010</strong>
Annex 4.5COVERAGE OF NEW FAMILY PLANNING AND ACTIVE FAMILY PLANNING ACCEPTORSBY PROVINCE, <strong>2010</strong>NoProvincesCouples of New Family Planning Acceptors Active Family Planning Acceptorschildbearing ageTotal % Total %(1) (2) (3) (4) (5) (6) (7)1 Aceh 776,140 197,755 25.48 593,025 76.412 North Sumatera 2,117,695 405,961 19.17 1,429,414 67.503 West Sumatera 803,493 146,703 18.26 593,887 73.914 Riau 700,926 177,053 25.26 465,378 66.395 Jambi 615,826 133,206 21.63 493,416 80.126 South Sumatera 1,567,427 459,294 29.30 1,226,532 78.257 Bengkulu 376,420 106,515 28.30 338,370 89.898 Lampung 1,533,422 501,819 32.73 1,083,224 70.649 Bangka Belitung Island 222,837 51,971 23.32 178,546 80.1210 Riau Island 320,147 61,761 19.29 204,804 63.9711 DKI Jakarta 1,225,738 439,797 35.88 1,009,579 82.3612 West Java 8,908,312 1,612,950 18.11 6,758,379 75.8713 Central Java 6,511,254 997,425 15.32 5,155,761 79.1814 DI Yogyakarta 544,057 53,376 9.81 430,231 79.0815 East Java 7,846,174 1,171,619 14.93 5,975,675 76.1616 Banten 1,927,397 374,253 19.42 1,343,713 69.7217 Bali 659,546 71,075 10.78 562,484 85.2818 West Nusa Tenggara 951,998 182,691 19.19 686,176 72.0819 East Nusa Tenggara 651,940 107,497 16.49 471,059 72.2520 West Kalimantan 852,929 163,184 19.13 587,963 68.9321 Central Kalimantan 422,894 79,577 18.82 330,831 78.2322 South Kalimantan 738,697 152,608 20.66 566,773 76.7323 East Kalimantan 606,704 99,580 16.41 430,646 70.9824 North Sulawesi 472,167 102,380 21.68 393,892 83.4225 Central Sulawesi 489,295 98,211 20.07 380,481 77.7626 South Sulawesi 1,324,031 342,745 25.89 932,461 70.4327 Southeast Sulawesi 404,076 75,191 18.61 290,980 72.0128 Gorontalo 205,877 50,545 24.55 176,261 85.6129 West Sulawesi 176,491 48,022 27.21 139,241 78.8930 Maluku 266,194 66,870 25.12 197,589 74.2331 North Maluku 189,414 38,345 20.24 110,235 58.2032 West Papua 55,051 26,565 48.26 43,700 79.3833 Papua 273,809 50,480 18.44 132,409 48.36<strong>Indonesia</strong>44,738,378 8,647,024 19.33 33,713,115 75.36Source: National Family Planning Coordinating Board
Annex 4.6PERCENTAGE OF NEW FAMILY PLANNING ACCEPTORSBY CONTRACEPTION METHOD AND PROVINCE, <strong>2010</strong>C o n t r a c e p t i o n M e t h o dNo ProvincesIUD MOW MOP CondomImplant Injection PillTotalTotal % Total % Total % Total % Total % Total % Total %(1) (2) (3) (4) (5) (6) (7) (8) (9) (10) (11) (12) (13) (14) (15) (16) (17)1 Aceh 2,438 1.23 644 0.33 22 0.01 33,691 17.04 3,496 1.77 83,222 42.08 74,242 37.54 197,7552 North Sumatera 23,674 5.83 8,612 2.12 2,088 0.51 80,042 19.72 30,279 7.46 124,377 30.64 136,889 33.72 405,9613 West Sumatera 7,391 5.04 1,004 0.68 217 0.15 24,226 16.51 15,532 10.59 65,355 44.55 32,978 22.48 146,7034 Riau 4,205 2.37 1,278 0.72 182 0.10 9,655 5.45 10,503 5.93 91,615 51.74 59,615 33.67 177,0535 Jambi 4,497 3.38 364 0.27 132 0.10 4,364 3.28 10,738 8.06 63,894 47.97 49,217 36.95 133,2066 South Sumatera 8,164 1.78 1,797 0.39 805 0.18 41,560 9.05 39,733 8.65 206,860 45.04 160,375 34.92 459,2947 Bengkulu 3,529 3.31 698 0.66 148 0.14 8,768 8.23 9,902 9.30 50,336 47.26 33,134 31.11 106,5158 Lampung 25,581 5.10 1,252 0.25 1,663 0.33 57,654 11.49 24,913 4.96 200,615 39.98 190,141 37.89 501,8199 Bangka Belitung Island 1,301 2.50 182 0.35 49 0.09 6,167 11.87 2,705 5.20 24,941 47.99 16,626 31.99 51,97110 Riau Island 1,675 2.71 258 0.42 79 0.13 14,364 23.26 2,472 4.00 23,533 38.10 19,380 31.38 61,76111 DKI Jakarta 47,504 10.80 3,112 0.71 785 0.18 28,493 6.48 14,306 3.25 221,235 50.30 124,362 28.28 439,79712 West Java 120,051 7.44 17,553 1.09 3,645 0.23 54,951 3.41 86,925 5.39 844,636 52.37 485,189 30.08 1,612,95013 Central Java 59,702 5.99 18,290 1.83 3,925 0.39 52,228 5.24 89,436 8.97 579,761 58.13 194,083 19.46 997,42514 DI Yogyakarta 9,261 17.35 1,342 2.51 487 0.91 5,472 10.25 4,525 8.48 27,001 50.59 5,288 9.91 53,37615 East Java 99,981 8.53 16,136 1.38 4,131 0.35 45,112 3.85 63,378 5.41 662,092 56.51 280,789 23.97 1,171,61916 Banten 17,110 4.57 2,137 0.57 696 0.19 21,076 5.63 23,562 6.30 190,647 50.94 119,025 31.80 374,25317 Bali 17,664 24.85 2,150 3.02 274 0.39 5,999 8.44 2,621 3.69 34,595 48.67 7,772 10.93 71,07518 West Nusa Tenggara 15,368 8.41 1,336 0.73 320 0.18 11,003 6.02 16,955 9.28 99,658 54.55 38,051 20.83 182,69119 East Nusa Tenggara 6,990 6.50 3,190 2.97 414 0.39 6,669 6.20 15,525 14.44 59,582 55.43 15,127 14.07 107,49720 West Kalimantan 5,533 3.39 1,068 0.65 121 0.07 24,016 14.72 8,145 4.99 71,143 43.60 53,158 32.58 163,18421 Central Kalimantan 1,248 1.57 389 0.49 114 0.14 5,243 6.59 5,866 7.37 34,899 43.86 31,818 39.98 79,57722 South Kalimantan 2,041 1.34 806 0.53 223 0.15 7,470 4.89 8,110 5.31 63,054 41.32 70,904 46.46 152,60823 East Kalimantan 3,803 3.82 1,130 1.13 178 0.18 12,777 12.83 3,508 3.52 49,904 50.11 28,280 28.40 99,58024 North Sulawesi 5,404 5.28 711 0.69 556 0.54 11,895 11.62 11,019 10.76 47,584 46.48 25,211 24.62 102,38025 Central Sulawesi 3,898 3.97 702 0.71 271 0.28 9,860 10.04 6,626 6.75 39,597 40.32 37,257 37.94 98,21126 South Sulawesi 8,012 2.34 2,163 0.63 432 0.13 49,469 14.43 19,426 5.67 144,488 42.16 118,755 34.65 342,74527 Southeast Sulawesi 1,254 1.67 432 0.57 282 0.38 9,305 12.38 6,952 9.25 29,229 38.87 27,737 36.89 75,19128 Gorontalo 4,180 8.27 394 0.78 224 0.44 4,170 8.25 6,690 13.24 17,459 34.54 17,428 34.48 50,54529 West Sulawesi 1,134 2.36 189 0.39 129 0.27 11,307 23.55 2,292 4.77 12,788 26.63 20,183 42.03 48,02230 Maluku 1,727 2.58 475 0.71 155 0.23 11,378 17.02 4,649 6.95 26,534 39.68 21,952 32.83 66,87031 North Maluku 844 2.20 253 0.66 126 0.33 3,473 9.06 6,693 17.45 16,651 43.42 10,305 26.87 38,34532 West Papua 144 0.54 144 0.54 75 0.28 6,732 25.34 2,003 7.54 10,165 38.26 7,302 27.49 26,56533 Papua 971 1.92 849 1.68 47 0.09 11,576 22.93 2,856 5.66 22,729 45.03 11,452 22.69 50,480<strong>Indonesia</strong>516,279 5.97 91,040 1.05 22,995 0.27 690,165 7.98 562,341 6.50 4,240,179 49.04 2,524,025 29.19 8,647,024Source: National Family Planning Coordinating BoardNotes:MOW: Women Operation MethodMOP: Men Operation Method
Annex 4.7Family Planning ClinicPrivate Practice byNo ProvincesGovernmentPrivatePhysicianPrivate Practice by MidwifeTotalParticipants % Participants % Participants % Participants % Participants %(1) (2) (3) (4) (5) (6) (7) (8) (9) (10) (11) (12)1 Aceh 123,020 62.21 4,814 2.43 4,088 2.07 65,833 33.29 197,755 100.002 North Sumatera 296,175 72.96 35,814 8.82 13,076 3.22 60,896 15.00 405,961 100.003 West Sumatera 99,831 68.05 851 0.58 1,808 1.23 44,213 30.14 146,703 100.004 Riau 102,339 57.80 3,824 2.16 9,146 5.17 61,744 34.87 177,053 100.005 Jambi 89,426 67.13 1,035 0.78 3,669 2.75 39,076 29.34 133,206 100.006 South Sumatera 311,433 67.81 26,870 5.85 9,685 2.11 111,306 24.23 459,294 100.007 Bengkulu 70,624 66.30 540 0.51 2,836 2.66 32,515 30.53 106,515 100.008 Lampung 332,449 66.25 11,443 2.28 8,554 1.70 149,373 29.77 501,819 100.009 Bangka Belitung Island 34,471 66.33 249 0.48 751 1.45 16,500 31.75 51,971 100.0010 Riau Island 33,670 54.52 10,572 17.12 1,709 2.77 15,810 25.60 61,761 100.0011 DKI Jakarta 163,015 37.07 15,951 3.63 53,138 12.08 207,693 47.22 439,797 100.0012 West Java 925,127 57.36 105,599 6.55 40,896 2.54 541,328 33.56 1,612,950 100.0013 Central Java 506,270 50.76 42,590 4.27 34,286 3.44 414,279 41.53 997,425 100.0014 DI Yogyakarta 20,769 38.91 9,984 18.71 827 1.55 21,796 40.83 53,376 100.0015 East Java 680,181 58.05 32,752 2.80 28,870 2.46 429,816 36.69 1,171,619 100.0016 Banten 224,679 60.03 26,924 7.19 10,040 2.68 112,610 30.09 374,253 100.0017 Bali 27,206 38.28 2,600 3.66 3,021 4.25 38,248 53.81 71,075 100.0018 West Nusa Tenggara 165,625 90.66 2,707 1.48 1,249 0.68 13,110 7.18 182,691 100.0019 East Nusa Tenggara 105,266 97.92 250 0.23 448 0.42 1,533 1.43 107,497 100.0020 West Kalimantan 100,372 61.51 15,007 9.20 6,164 3.78 41,641 25.52 163,184 100.0021 Central Kalimantan 61,053 76.72 3,934 4.94 1,075 1.35 13,515 16.98 79,577 100.0022 South Kalimantan 98,881 64.79 2,390 1.57 3,923 2.57 47,414 31.07 152,608 100.0023 East Kalimantan 51,437 51.65 6,096 6.12 2,540 2.55 39,507 39.67 99,580 100.0024 North Sulawesi 72,153 70.48 11,571 11.30 4,661 4.55 13,995 13.67 102,380 100.0025 Central Sulawesi 86,751 88.33 3,767 3.84 1,215 1.24 6,478 6.60 98,211 100.0026 South Sulawesi 285,298 83.24 7,017 2.05 4,846 1.41 45,584 13.30 342,745 100.0027 Southeast Sulawesi 67,089 89.22 325 0.43 1,378 1.83 6,399 8.51 75,191 100.0028 Gorontalo 35,490 70.21 1,525 3.02 477 0.94 13,053 25.82 50,545 100.0029 West Sulawesi 44,401 92.46 161 0.34 96 0.20 3,364 7.01 48,022 100.0030 Maluku 57,459 85.93 2,906 4.35 849 1.27 5,656 8.46 66,870 100.0031 North Maluku 34,249 89.32 2,063 5.38 329 0.86 1,704 4.44 38,345 100.0032 West Papua 23,759 89.44 2,033 7.65 3 0.01 770 2.90 26,565 100.0033 Papua 44,744 88.64 2,968 5.88 1,579 3.13 1,189 2.36 50,480 100.00<strong>Indonesia</strong>5,374,712 62.16 397,132 4.59 257,232 2.97 2,617,948 30.28 8,647,024 100.00Source: National Family Planning Coordinating BoardPROPORTION OF NEW FAMILY PLANNING ACCEPTORS BY PRACTICE PLACE<strong>2010</strong>
Annex 4.8PERCENTAGE OF ACTIVE FAMILY PLANNING ACCEPTORSBY CONTRACEPTION METHOD AND PROVINCE, <strong>2010</strong>Couples of Active FamilyC o n t r a c e p t i o n M e t h o dNo Provinces childbearing Planning AcceptorsIUD MOW MOPImplantCondomInjectionPillage Total % Total % Total % Total % Total % Total % Total % Total %(1) (2) (3) (4) (5) (6) (7) (8) (9) (10) (11) (12) (13) (14) (15) (16) (17) (18) (19)1 Aceh 776,140 593,025 76.41 11,993 2.02 4,479 0.76 187 0.03 11,746 1.98 51,698 8.72 267,195 45.06 245,727 41.442 North Sumatera 2,117,695 1,429,414 67.50 146,107 10.22 110,156 7.71 4,746 0.33 127,308 8.91 87,125 6.10 478,007 33.44 475,965 33.303 West Sumatera 803,493 593,887 73.91 57,195 9.63 16,657 2.80 575 0.10 77,207 13.00 22,960 3.87 305,672 51.47 113,621 19.134 Riau 700,926 465,378 66.39 31,619 6.79 5,364 1.15 1,715 0.37 42,945 9.23 19,152 4.12 208,985 44.91 155,598 33.435 Jambi 615,826 493,416 80.12 30,720 6.23 4,000 0.81 1,064 0.22 64,344 13.04 8,235 1.67 203,111 41.16 181,942 36.876 South Sumatera 1,567,427 1,226,532 78.25 48,334 3.94 40,930 3.34 4,772 0.39 209,583 17.09 62,590 5.10 505,758 41.23 354,565 28.917 Bengkulu 376,420 338,370 89.89 21,344 6.31 6,834 2.02 1,156 0.34 49,052 14.50 10,508 3.11 148,658 43.93 100,818 29.808 Lampung 1,533,422 1,083,224 70.64 127,761 11.79 14,535 1.34 13,233 1.22 146,563 13.53 20,729 1.91 394,415 36.41 365,988 33.799 Bangka Belitung Island 222,837 178,546 80.12 6,343 3.55 5,027 2.82 144 0.08 15,220 8.52 5,660 3.17 80,858 45.29 65,294 36.5710 Riau Island 320,147 204,804 63.97 12,325 6.02 2,171 1.06 295 0.14 9,997 4.88 10,338 5.05 96,758 47.24 72,920 35.6011 DKI Jakarta 1,225,738 1,009,579 82.36 215,333 21.33 36,179 3.58 11,598 1.15 73,590 7.29 29,784 2.95 381,360 37.77 261,735 25.9312 West Java 8,908,312 6,758,379 75.87 785,631 11.62 160,779 2.38 65,463 0.97 290,891 4.30 76,843 1.14 3,459,360 51.19 1,919,412 28.4013 Central Java 6,511,254 5,155,761 79.18 427,226 8.29 287,570 5.58 60,062 1.16 487,002 9.45 95,704 1.86 2,935,640 56.94 862,557 16.7314 DI Yogyakarta 544,057 430,231 79.08 105,690 24.57 21,545 5.01 2,846 0.66 24,666 5.73 25,172 5.85 195,750 45.50 54,562 12.6815 East Java 7,846,174 5,975,675 76.16 857,569 14.35 304,206 5.09 24,510 0.41 464,560 7.77 75,909 1.27 2,913,591 48.76 1,335,330 22.3516 Banten 1,927,397 1,343,713 69.72 191,604 14.26 33,492 2.49 15,475 1.15 117,650 8.76 19,300 1.44 621,726 46.27 344,466 25.6417 Bali 659,546 562,484 85.28 266,299 47.34 21,151 3.76 2,791 0.50 8,392 1.49 15,486 2.75 201,116 35.75 47,249 8.4018 West Nusa Tenggara 951,998 686,176 72.08 80,004 11.66 15,478 2.26 2,577 0.38 88,653 12.92 12,481 1.82 336,566 49.05 150,417 21.9219 East Nusa Tenggara 651,940 471,059 72.25 49,589 10.53 19,021 4.04 4,050 0.86 48,676 10.33 10,426 2.21 262,951 55.82 76,346 16.2120 West Kalimantan 852,929 587,963 68.93 35,997 6.12 8,985 1.53 4,106 0.70 33,493 5.70 19,130 3.25 238,784 40.61 247,468 42.0921 Central Kalimantan 422,894 330,831 78.23 6,129 1.85 3,280 0.99 456 0.14 30,822 9.32 7,274 2.20 148,937 45.02 133,933 40.4822 South Kalimantan 738,697 566,773 76.73 10,092 1.78 6,852 1.21 701 0.12 51,795 9.14 12,264 2.16 199,002 35.11 286,067 50.4723 East Kalimantan 606,704 430,646 70.98 44,090 10.24 9,687 2.25 1,121 0.26 20,677 4.80 9,965 2.31 167,644 38.93 177,462 41.2124 North Sulawesi 472,167 393,892 83.42 39,295 9.98 8,111 2.06 931 0.24 52,226 13.26 7,354 1.87 141,933 36.03 144,042 36.5725 Central Sulawesi 489,295 380,481 77.76 20,868 5.48 8,033 2.11 605 0.16 34,425 9.05 9,697 2.55 153,269 40.28 153,584 40.3726 South Sulawesi 1,324,031 932,461 70.43 41,450 4.45 15,040 1.61 872 0.09 85,631 9.18 56,002 6.01 410,834 44.06 322,632 34.6027 Southeast Sulawesi 404,076 290,980 72.01 7,266 2.50 5,661 1.95 997 0.34 38,670 13.29 13,237 4.55 114,052 39.20 111,097 38.1828 Gorontalo 205,877 176,261 85.61 20,853 11.83 2,508 1.42 553 0.31 23,794 13.50 2,920 1.66 65,354 37.08 60,279 34.2029 West Sulawesi 176,491 139,241 78.89 4,208 3.02 1,154 0.83 198 0.14 8,942 6.42 9,964 7.16 48,850 35.08 65,925 47.3530 Maluku 266,194 197,589 74.23 6,736 3.41 4,122 2.09 1,030 0.52 19,988 10.12 12,345 6.25 88,660 44.87 64,708 32.7531 North Maluku 189,414 110,235 58.20 1,755 1.59 2,086 1.89 519 0.47 15,085 13.68 5,988 5.43 43,901 39.82 40,901 37.1032 West Papua 55,051 43,700 79.38 2,120 4.85 1,410 3.23 85 0.19 1,494 3.42 3,934 9.00 21,799 49.88 12,858 29.4233 Papua 273,809 132,409 48.36 3,519 2.66 4,608 3.48 313 0.24 9,562 7.22 12,722 9.61 67,869 51.26 33,816 25.54<strong>Indonesia</strong>44,738,378 33,713,115 75.36 3,717,064 11.03 1,191,111 3.53 229,746 0.68 2,784,649 8.26 842,896 2.50 15,908,365 47.19 9,039,284 26.81Source: National Family Planning Coordinating Board
Annex 4.9PERCENTAGE OF WOMEN THAT MARRIED IN AGE 10-49 YEARSBY FAMILY PLANNING USING STATUS, RISKESDAS <strong>2010</strong>No Provinces Using Have/had been Never(1) (2) (3) (4) (5)1 Aceh 43.8 26.5 29.82 North Sumatera 37.9 24.6 37.43 West Sumatera 50.4 28.0 21.64 Riau 48.0 27.9 24.15 Jambi 63.4 20.4 16.16 South Sumatera 60.9 22.3 16.87 Bengkulu 60.5 26.3 13.38 Lampung 62.1 22.0 15.99 Bangka Belitung Island 65.3 23.0 11.710 Riau Island 53.6 25.8 20.711 DKI Jakarta 51.2 28.5 20.312 West Java 59.8 28.4 11.813 Central Java 59.4 25.2 15.414 DI Yogyakarta 55.3 27.1 17.615 East Java 59.4 22.9 17.716 Banten 56.8 28.8 14.517 Bali 65.4 18.0 16.618 West Nusa Tenggara 53.6 31.1 15.319 East Nusa Tenggara 38.1 22.9 39.020 West Kalimantan 59.9 23.8 16.321 Central Kalimantan 65.7 23.6 10.722 South Kalimantan 62.6 26.6 10.823 East Kalimantan 56.3 28.2 15.524 North Sulawesi 62.4 28.1 9.525 Central Sulawesi 51.4 26.9 21.626 South Sulawesi 45.6 28.1 26.327 Southeast Sulawesi 40.5 30.6 28.928 Gorontalo 63.1 21.6 15.329 West Sulawesi 39.9 20.3 39.830 Maluku 36.4 22.2 41.431 North Maluku 43.3 30.8 25.932 West Papua 32.1 26.4 41.533 Papua 32.8 25.6 41.6<strong>Indonesia</strong>55.8 25.7 18.4Source: National Board of <strong>Health</strong> Research and Development, MoH RI, Riskesdas <strong>2010</strong>
Lampiran 4.10NoProvincesCoverage of Complication NeonatesComplicationComplication Coverage of Complication Obstetric CareCareNeonatesObstetricTotal % Total %(1) (2) (3) (4) (5) (6) (7) (8)1 Aceh 14,570 4,109 28.20 22,717 14,124 62.172 North Sumatera 43,954 892 2.03 64,616 33,093 51.213 West Sumatera 15,886 1,662 10.46 22,818 19,260 84.414 Riau 19,578 3,524 18.00 27,505 10,739 39.045 Jambi 10,400 2,569 24.70 15,391 9,051 58.816 South Sumatera 26,254 3,623 13.80 38,257 21,989 57.487 Bengkulu 6,611 721 10.90 9,610 7,221 75.148 Lampung 25,057 3,443 13.74 37,675 15,292 40.599 Bangka Belitung Island 3,867 247 6.40 5,638 3,230 57.2910 Riau Island 6,049 2,008 33.20 8,587 4,909 57.1711 DKI Jakarta 25,557 7,233 28.30 31,856 22,148 69.5212 West Java 141,692 27,389 19.33 207,814 122,558 58.9713 Central Java 86,924 48,782 56.12 126,445 71,762 56.7514 DI Yogyakarta 6,468 5,323 82.29 9,586 7,923 82.6615 East Java 89,321 58,523 65.52 130,876 93,943 71.7816 Banten 31,734 7,312 23.04 46,276 18,893 40.8317 Bali 9,301 4,915 52.85 13,639 10,032 73.5618 West Nusa Tenggara 16,218 5,157 31.80 23,269 19,352 83.1719 East Nusa Tenggara 17,577 1,874 10.66 25,636 14,676 57.2520 West Kalimantan 15,216 2,535 16.66 21,730 10,920 50.2521 Central Kalimantan 6,832 204 2.98 10,437 3,856 36.9422 South Kalimantan 10,644 2,909 27.33 15,674 10,532 67.1923 East Kalimantan 11,748 8,889 75.67 17,043 8,704 51.0724 North Sulawesi 10,188 2,917 28.63 8,575 4,672 54.4925 Central Sulawesi 7,387 2,279 30.85 10,834 7,102 65.5526 South Sulawesi 26,647 293 1.10 35,875 21,500 59.9327 Southeast Sulawesi 6,850 1,961 28.63 9,506 4,093 43.0628 Gorontalo 4,010 407 10.16 5,853 3,945 67.4029 West Sulawesi 3,329 1,227 36.85 5,500 3,405 61.9030 Maluku 5,183 882 17.01 7,932 2,866 36.1331 North Maluku 3,498 364 10.40 5,094 2,323 45.6032 West Papua 2,510 203 8.10 3,741 1,541 41.2033 Papua 6,457 452 7.00 12,217 5,030 41.17<strong>Indonesia</strong>717,516 214,827 25.23 1,038,223 610,684 58.82Source : DG of Nutrition and Maternal and Chilren <strong>Health</strong> Care, MoH RICOVERAGE OF NEONATES CARE WITH COMPLICATION AND OBSTETRIC CARE WITH COMPLICATIONBY PROVINCE, <strong>2010</strong>
Lampiran 4.11COVERAGE OF NEONATES VISITS BY PROVINCE<strong>2010</strong>NoProvincesNumber of Infants(1) (2) (3) (3) (4) (5) (6)1 Aceh 97,132 89,264 91.90 84,893 87.402 North Sumatera 293,028 256,400 87.50 161,752 55.203 West Sumatera 105,906 95,580 90.25 89,363 84.384 Riau 130,519 117,728 90.20 95,279 73.005 Jambi 69,335 62,367 89.95 56,785 81.906 South Sumatera 175,026 153,498 87.70 144,747 82.707 Bengkulu 44,076 39,188 88.91 31,250 70.908 Lampung 167,047 147,502 88.30 107,444 64.329 Bangka Belitung Island 25,779 23,730 92.05 24,567 95.3010 Riau Island 40,324 38,913 96.50 21,533 53.4011 DKI Jakarta 170,378 160,155 94.00 148,910 87.4012 West Java 944,611 870,931 92.20 732,074 77.5013 Central Java 579,494 567,904 98.00 527,340 91.0014 DI Yogyakarta 43,121 39,671 92.00 35,713 82.8215 East Java 595,476 577,612 97.00 565,702 95.0016 Banten 211,561 191,886 90.70 146,527 69.2617 Bali 62,005 61,528 99.23 60,833 98.1118 West Nusa Tenggara 108,118 97,955 90.60 80,224 74.2019 East Nusa Tenggara 117,178 89,758 76.60 64,706 55.2220 West Kalimantan 101,438 86,324 85.10 63,865 62.9621 Central Kalimantan 45,546 37,894 83.20 20,906 45.9022 South Kalimantan 70,958 62,159 87.60 53,382 75.2323 East Kalimantan 78,318 67,902 86.70 72,421 92.4724 North Sulawesi 67,922 63,473 93.45 52,402 77.1525 Central Sulawesi 49,245 39,908 81.04 39,583 80.3826 South Sulawesi 177,645 152,242 85.70 44,589 25.1027 Southeast Sulawesi 45,668 39,366 86.20 35,233 77.1528 Gorontalo 26,734 21,548 80.60 21,558 80.6429 West Sulawesi 22,195 17,379 78.30 12,391 55.8330 Maluku 34,550 24,358 70.50 24,185 70.0031 North Maluku 23,322 10,565 45.30 15,941 68.3532 West Papua 16,734 7,129 42.60 5,188 31.0033 Papua 43,048 14,004 32.53 16,444 38.20<strong>Indonesia</strong>4,783,437 4,325,819 84.01 3,657,729 71.50Source : DG of Nutrition and Maternal and Chilren <strong>Health</strong> Care, MoH RI1 st Neonates Visits % 1 st Neonates VisitsNeonates VisitsComplete NeonatesVisits (KN)% CompleteNeonates Visits
Annex 4.12PERCENTAGE OF NEONATES VISIT IN UNDERFIVE AGE BY PROVINCE, RISKESDAS <strong>2010</strong>NoProvincesNeonates Visits6-48 Hours 3-7 Days 8-28 Days(1) (2) (3) (4) (5)1 Aceh 73.2 69.6 28.82 North Sumatera 76.1 68.1 23.93 West Sumatera 75.4 54.6 35.84 Riau 70.1 50.5 14.75 Jambi 77.9 60.0 22.36 South Sumatera 70.3 50.7 26.67 Bengkulu 74.7 56.2 26.38 Lampung 72.4 58.6 35.49 Bangka Belitung Island 76.4 50.3 29.910 Riau Island 78.8 61.5 31.611 DKI Jakarta 84.7 72.8 59.212 West Java 67.6 65.6 45.613 Central Java 82.6 71.0 48.014 DI Yogyakarta 96.2 83.7 77.115 East Java 77.7 74.3 49.016 Banten 61.8 55.7 37.117 Bali 86.7 66.7 58.218 West Nusa Tenggara 74.3 50.4 41.619 East Nusa Tenggara 43.3 30.9 22.520 West Kalimantan 53.7 44.2 19.321 Central Kalimantan 55.6 49.4 13.422 South Kalimantan 77.3 65.7 20.223 East Kalimantan 74.3 58.4 42.324 North Sulawesi 80.7 65.9 40.225 Central Sulawesi 57.0 37.3 17.226 South Sulawesi 70.1 48.9 26.027 Southeast Sulawesi 54.2 44.6 23.028 Gorontalo 47.4 28.4 21.129 West Sulawesi 61.3 45.1 9.230 Maluku 44.4 40.4 20.331 North Maluku 37.5 25.9 15.432 West Papua 41.2 27.0 21.233 Papua 52.9 40.2 28.4<strong>Indonesia</strong> 71.4 61.3 38.0Source: National Board of <strong>Health</strong> Research and Development, MoH RI, Riskesdas <strong>2010</strong>
Annex 4.13PERCENTAGE OF COMPLETE NEONATES VISIT (KN1, KN2, KN3 ) IN UNDERFIVE AGEBY PROVINCE, RISKESDAS <strong>2010</strong>NoProvincesCategory of Neonates VisitComplete Neonates Visit Incomplete Neonates Visit No Neonates Visit(1) (2) (3) (4) (5)1 Aceh 25.8 56.3 17.92 North Sumatera 22.3 56.2 21.53 West Sumatera 27.4 53.3 19.34 Riau 11.8 65.0 23.25 Jambi 19.0 63.5 17.56 South Sumatera 24.5 48.7 26.87 Bengkulu 23.0 58.6 18.48 Lampung 31.8 45.7 22.49 Bangka Belitung Island 25.7 56.1 18.210 Riau Island 23.3 66.5 10.211 DKI Jakarta 52.8 35.6 11.612 West Java 37.8 41.5 20.713 Central Java 40.2 49.7 10.114 DI Yogyakarta 71.2 27.5 1.315 East Java 41.6 47.7 10.716 Banten 30.4 41.8 27.817 Bali 48.8 41.3 9.918 West Nusa Tenggara 31.5 48.3 20.219 East Nusa Tenggara 12.5 43.2 44.320 West Kalimantan 14.1 47.0 38.921 Central Kalimantan 8.4 56.3 35.322 South Kalimantan 18.1 64.0 17.823 East Kalimantan 35.5 44.7 19.824 North Sulawesi 34.7 50.9 14.525 Central Sulawesi 13.3 45.8 40.926 South Sulawesi 20.5 54.5 25.027 Southeast Sulawesi 20.5 38.0 41.528 Gorontalo 11.6 47.4 41.129 West Sulawesi 6.8 58.5 34.730 Maluku 17.1 37.3 45.631 North Maluku 10.4 37.8 51.932 West Papua 15.2 30.3 54.533 Papua 23.7 32.8 43.5<strong>Indonesia</strong>31.8 47.4 20.8Source: National Board of <strong>Health</strong> Research and Development, MoH RI, Riskesdas <strong>2010</strong>
Annex 4.14COVERAGE OF INFANT AND UNDERFIVE HEALTH CAREBY PROVINCE, <strong>2010</strong>NoProvincesCoverage of Infant <strong>Health</strong> Care Coverage of Underfive Age <strong>Health</strong> CareTotal % Total %(1) (2) (3) (4) (5) (6)1 Aceh 86,739 89.30 428,679 81.042 North Sumatera 252,004 86.00 1,045,442 91.813 West Sumatera 102,549 96.83 339,970 86.434 Riau 116,175 89.01 425,468 71.905 Jambi 64,204 92.60 202,097 83.726 South Sumatera 150,873 86.20 402,010 71.207 Bengkulu 39,316 89.20 121,778 72.008 Lampung 151,645 90.78 690,523 77.309 Bangka Belitung Island 23,021 89.30 99,739 88.8010 Riau Island 34,719 86.10 140,396 76.9011 DKI Jakarta 155,385 91.20 699,316 89.7712 West Java 850,622 90.05 2,985,831 83.3013 Central Java 560,487 96.72 1,982,945 89.3314 DI Yogyakarta 39,973 92.70 199,662 97.6915 East Java 569,871 95.70 2,101,364 86.4016 Banten 194,192 91.79 729,127 79.2017 Bali 60,145 97.00 300,549 85.1018 West Nusa Tenggara 101,177 93.58 398,640 83.3019 East Nusa Tenggara 88,118 75.20 16,459 57.7020 West Kalimantan 85,208 84.00 291,130 62.8021 Central Kalimantan 37,439 82.20 168,234 71.9022 South Kalimantan 62,188 87.64 279,403 79.1023 East Kalimantan 66,962 85.50 336,024 89.0324 North Sulawesi 62,556 92.10 106,430 82.3025 Central Sulawesi 39,135 79.47 141,883 68.2026 South Sulawesi 149,915 84.39 516,555 80.6127 Southeast Sulawesi 38,694 84.73 167,000 72.7028 Gorontalo 23,793 89.00 100,071 82.0529 West Sulawesi 18,866 85.00 37,598 87.6430 Maluku 24,140 69.87 54,431 66.1031 North Maluku 13,037 55.90 68,318 64.6032 West Papua 7,028 42.00 53,080 64.0033 Papua 13,948 32.40 119,432 53.62<strong>Indonesia</strong>4,284,121 84.04 15,749,585 78.11Source : DG of Nutrition and Maternal and Chilren <strong>Health</strong> Care, MoH RI
Annex 4.15COVERAGE OF PRIMARY SCHOOL PERFORMING FOR EMBRACING 1 ST CLASS STUDENTSBY PROVINCE, <strong>2010</strong>No Provinces Number of Primary SchoolCoverage of Primary School Performing forEmbracing 1 st Class StudentsTotal %(1) (2) (3) (4) (5)1 Aceh 3,821 1,253 32.792 North Sumatera 4,027 3,016 74.893 West Sumatera 4,444 3,894 87.634 Riau 2,679 2,276 84.965 Jambi 2,790 1,638 58.716 South Sumatera 4,537 2,494 54.977 Bengkulu 1,310 1,034 78.938 Lampung 6,095 619 10.169 Bangka Belitung Island 813 762 93.7310 Riau Island 697 380 54.5611 DKI Jakarta 2,987 2,489 83.3312 West Java 18,747 16,831 89.7813 Central Java 22,687 15,954 70.3214 DI Yogyakarta 1,786 1,786 100.0015 East Java 24,468 24,468 100.0016 Banten 4,177 3,450 82.6017 Bali 2,460 2,395 97.3618 West Nusa Tenggara 3,544 2,768 78.1019 East Nusa Tenggara 3,693 2,393 64.8020 West Kalimantan 2,959 1,565 52.9021 Central Kalimantan 2,493 1,129 45.3022 South Kalimantan 3,472 1,959 56.4223 East Kalimantan 3,589 1,054 29.3724 North Sulawesi 43,195 27,174 62.9125 Central Sulawesi 1,836 236 12.8326 South Sulawesi 5,839 4,504 77.1327 Southeast Sulawesi 2,244 487 21.7028 Gorontalo 956 729 76.3029 West Sulawesi 1,379 303 22.0030 Maluku 1,799 491 27.2831 North Maluku 692 250 36.0632 West Papua 472 - -33 Papua 2,140 261 12.20<strong>Indonesia</strong>188,827 130,043 58.49Source : DG of Nutrition and Maternal and Chilren <strong>Health</strong> Care, MoH RI
Annex 4.16COVERAGE OF UNDERFIVE WEIGHTEDBY PROVINCE, <strong>2010</strong>No Provinces Number of UnderfiveTotal %(1) (2) (3) (4) (5)1 Aceh 402,420 298,348 74.142 North Sumatera 1,088,274 780,890 71.753 West Sumatera 501,470 343,203 68.444 Riau 734,400 457,451 62.295 Jambi 310,367 222,238 71.606 South Sumatera 750,935 474,756 63.227 Bengkulu 169,710 89,095 52.508 Lampung 906,837 594,730 65.589 Bangka Belitung Island 145,512 66,683 45.8310 Riau Island 220,935 115,174 52.1311 DKI Jakarta 779,009 332,890 42.7312 West Java 3,584,431 2,668,055 74.4313 Central Java 2,546,259 2,101,759 82.5414 DI Yogyakarta 236,104 175,146 74.1815 East Java 3,041,160 2,363,111 77.7016 Banten 1,180,053 596,304 50.5317 Bali 256,148 194,490 75.9318 West Nusa Tenggara 507,694 374,995 73.8619 East Nusa Tenggara 520,415 401,942 77.2320 West Kalimantan 420,263 218,561 52.0121 Central Kalimantan 227,600 113,970 50.0722 South Kalimantan 376,569 240,648 63.9123 East Kalimantan 498,296 179,186 35.9624 North Sulawesi 158,462 134,518 84.8925 Central Sulawesi 316,431 136,375 43.1026 South Sulawesi 755,893 514,034 68.0027 Southeast Sulawesi 278,962 186,013 66.6828 Gorontalo 126,533 83,085 65.6629 West Sulawesi 123,752 68,353 55.2330 Maluku 197,366 114,154 57.8431 North Maluku 122,403 57,401 46.9032 West Papua 82,865 27,538 33.2333 Papua 237,480 73,607 31.00<strong>Indonesia</strong>21,805,008 14,798,703 67.87Source : DG of Nutrition and Maternal and Chilren <strong>Health</strong> Care, MoH RINumber of Underfive Weighted (D/S)
Annex 4.17PERCENTAGE OF WEIGHING FREQUENCY OF CHILDREN AGE 6-59 MONTHS DURING LAST SIX MONTHSBY PROVINCE, RISKESDAS <strong>2010</strong>NoProvincesWeighing Frequency≥ 4 times 1–3 times Never(1) (2) (3) (4) (5)1 Aceh 32.7 39.5 27.82 North Sumatera 23.3 32.6 44.13 West Sumatera 49.1 30.4 20.44 Riau 34.9 31.0 34.15 Jambi 21.2 41.6 37.26 South Sumatera 25.3 26.5 48.17 Bengkulu 32.8 20.7 46.68 Lampung 37.0 30.8 32.29 Bangka Belitung Island 42.1 28.6 29.410 Riau Island 40.4 38.2 21.311 DKI Jakarta 53.7 32.2 14.112 West Java 61.4 25.4 13.113 Central Java 66.3 20.9 12.814 DI Yogyakarta 86.8 10.8 2.515 East Java 61.8 23.8 14.416 Banten 45.9 33.3 20.917 Bali 58.3 23.8 17.918 West Nusa Tenggara 52.5 28.8 18.819 East Nusa Tenggara 62.1 17.3 20.620 West Kalimantan 30.9 17.3 51.921 Central Kalimantan 26.7 27.6 45.722 South Kalimantan 38.9 31.1 30.123 East Kalimantan 38.0 30.5 31.524 North Sulawesi 43.8 32.2 24.025 Central Sulawesi 23.6 27.4 48.926 South Sulawesi 35.8 29.4 34.827 Southeast Sulawesi 22.0 22.0 56.128 Gorontalo 43.8 26.0 30.129 West Sulawesi 23.3 32.2 44.430 Maluku 30.4 29.7 39.931 North Maluku 36.0 26.3 37.732 West Papua 46.9 24.7 28.433 Papua 31.3 28.0 40.7<strong>Indonesia</strong>49.4 26.9 23.8Source: National Board of <strong>Health</strong> Research and Development, MoH RI, Riskesdas <strong>2010</strong>
Annex 4.18COVERAGE OF EXCLUSIVE BREAST FEEDING FOR INFANT AGE 0-5 MONTHSBY PROVINCE, 2009NoProvincesCoverage of Exclusive Breast Feeding forInfant 0-5 Months(1) (2) (3)1 Aceh 52.22 North Sumatera 55.13 West Sumatera 71.24 Riau 57.35 Jambi 63.56 South Sumatera 64.47 Bengkulu 75.88 Lampung 55.19 Bangka Belitung Island 62.010 Riau Island 56.811 DKI Jakarta 58.712 West Java 64.113 Central Java 52.214 DI Yogyakarta 63.415 East Java 48.816 Banten 58.617 Bali 54.318 West Nusa Tenggara 78.319 East Nusa Tenggara 75.220 West Kalimantan 52.721 Central Kalimantan 63.222 South Kalimantan 65.123 East Kalimantan 66.324 North Sulawesi 54.825 Central Sulawesi 62.526 South Sulawesi 70.227 Southeast Sulawesi 62.528 Gorontalo 57.529 West Sulawesi 73.430 Maluku 68.431 North Maluku 61.732 West Papua 59.833 Papua 67.2<strong>Indonesia</strong>61.3Sumber : BPS-Statistics <strong>Indonesia</strong>, National Survey of Social and Economic 2009
Annex 4.19PERCENTAGE OF CHILDREN AGE 0-23 MONTHS WHO HAVE/HAD BEEN BREASTFEEDINGBY PROVINCE, RISKESDAS <strong>2010</strong>NoProvincesChildren Age 0-23 MonthsHad been breastfedStill breastfed(1) (2) (3) (4)1 Aceh 87,8 82,12 North Sumatera 88,9 74,93 West Sumatera 95,4 84,04 Riau 85,5 76,65 Jambi 93,3 78,46 South Sumatera 90,5 75,37 Bengkulu 90,0 81,58 Lampung 95,7 80,69 Bangka Belitung Island 89,1 65,310 Riau Island 86,4 64,311 DKI Jakarta 85,4 70,312 West Java 91,1 84,513 Central Java 93,9 85,014 DI Yogyakarta 94,0 72,615 East Java 88,8 79,816 Banten 89,0 80,417 Bali 92,0 76,018 West Nusa Tenggara 91,4 82,819 East Nusa Tenggara 86,9 82,020 West Kalimantan 89,3 80,721 Central Kalimantan 91,6 79,222 South Kalimantan 88,3 78,823 East Kalimantan 90,3 72,724 North Sulawesi 89,4 71,225 Central Sulawesi 91,9 78,826 South Sulawesi 90,0 81,827 Southeast Sulawesi 92,7 84,228 Gorontalo 87,8 83,829 West Sulawesi 89,4 78,630 Maluku 94,7 64,831 North Maluku 83,0 84,132 West Papua 89,4 73,833 Papua 84,8 75,8<strong>Indonesia</strong>90,3 80,1Source : DG of Nutrition and Maternal and Chilren <strong>Health</strong> Care, MoH RI
Annex 4.20TargetVitamin A CoverageNo Provinces UnderfivesPostpartum Infants 6-11 monthsUnderfives 12-59 monthsPostpartum Mothers6-11 months 12 - 59 months Mothers Total % Total % Total %(1) (2) (3) (4) (5) (6) (7) (8) (9) (10) (11)1 Aceh 135,671 409,244 100,486 74,167 54.67 291,239 71.17 68,735 68.402 North Sumatera 727,918 1,620,800 307,891 532,046 73.09 1,230,983 75.95 17,193 5.583 West Sumatera 129,740 393,346 103,720 107,880 83.15 346,431 88.07 76,919 74.164 Riau 213,570 601,743 119,660 145,411 68.09 441,888 73.43 102,703 85.835 Jambi 73,532 234,518 73,132 66,488 90.42 201,774 86.04 62,924 86.046 South Sumatera 217,528 626,707 191,863 180,656 83.05 527,967 84.24 154,854 80.717 Bengkulu 63,364 131,093 45,815 42,274 66.72 103,765 79.15 34,816 75.998 Lampung 213,127 732,026 - 150,167 70.46 466,109 63.67 - -9 Bangka Belitung Island 26,890 102,052 26,931 24,986 92.92 86,476 84.74 24,707 91.7410 Riau Island 41,851 171,663 41,091 36,883 88.13 107,855 62.83 20,296 49.3911 DKI Jakarta 331,239 608,631 144,802 136,951 41.35 367,004 60.30 130,380 90.0412 West Java 962,858 3,117,605 991,842 875,327 90.91 2,742,248 87.96 776,766 78.3213 Central Java 641,850 2,031,953 591,438 636,538 99.17 1,999,216 98.39 542,461 91.7214 DI Yogyakarta 57,271 190,167 44,323 52,200 91.15 177,218 93.19 38,474 86.8015 East Java 901,992 2,404,679 - 869,637 96.41 2,011,505 83.65 - -16 Banten 229,186 839,593 221,436 213,402 93.11 714,581 85.11 138,665 62.6217 Bali 67,848 207,635 65,066 60,227 88.77 201,852 97.21 59,497 91.4418 West Nusa Tenggara 116,950 397,814 - 101,430 86.73 356,198 89.54 - -19 East Nusa Tenggara 128,134 413,647 122,330 102,707 80.16 332,610 80.41 74,857 61.1920 West Kalimantan 172,107 401,488 103,651 107,923 62.71 295,268 73.54 79,314 76.5221 Central Kalimantan 69,556 198,220 49,492 48,193 69.29 140,441 70.85 40,091 81.0122 South Kalimantan 81,916 295,620 74,251 72,902 89.00 256,972 86.93 58,671 79.0223 East Kalimantan 104,680 351,927 82,045 76,618 73.19 238,141 67.67 57,443 70.0124 North Sulawesi 73,539 265,419 40,440 61,998 84.31 231,041 87.05 31,436 77.7325 Central Sulawesi 74,358 211,436 51,709 63,612 85.55 180,230 85.24 26,145 50.5626 South Sulawesi 205,182 604,395 171,221 191,596 93.38 522,209 86.40 147,995 86.4427 Southeast Sulawesi 62,206 200,463 42,786 38,574 62.01 130,994 65.35 34,673 81.0428 Gorontalo 21,494 89,690 26,296 16,658 77.50 71,111 79.29 21,964 83.5329 West Sulawesi 36,479 103,581 26,251 33,365 91.46 85,482 82.53 18,981 72.3130 Maluku 70,408 180,861 37,891 32,689 46.43 68,330 37.78 26,134 68.9731 North Maluku 34,788 110,867 24,409 20,608 59.24 58,104 52.41 14,599 59.8132 West Papua 14,424 53,660 17,853 10,319 71.54 18,207 33.93 7,104 39.7933 Papua 92,430 212,515 57,260 41,004 44.36 65,330 30.74 7,848 13.71<strong>Indonesia</strong>6,394,086 18,515,058 3,997,381 5,225,436 81.72 15,068,779 81.39 2,896,645 72.46Source : DG of Nutrition and Maternal and Chilren <strong>Health</strong> Care, MoH RICOVERAGE OF VITAMIN A CAPSULE DISTRIBUTION FOR UNDERFIVE AND POSTPARTUM MOTHERSBY PROVINCE, <strong>2010</strong>
Annex 4.21COVERAGE OF 90 IRON TABLET DISTRIBUTION (Fe 3) FOR PREGNANT WOMENBY PROVINCE, <strong>2010</strong>Number of PregnantWomenPregnant Women got Fe3No ProvincesTotal %(1) (2) (3) (4) (5)1 Aceh 109,510 92,198 84.192 North Sumatera 684,701 486,146 71.003 West Sumatera 113,882 88,557 77.764 Riau 140,049 128,713 91.915 Jambi 82,100 59,421 72.386 South Sumatera 188,839 119,603 63.347 Bengkulu 48,834 37,694 77.198 Lampung 166,002 129,713 78.149 Bangka Belitung Island 27,571 25,944 94.1010 Riau Island 44,803 30,084 67.1511 DKI Jakarta 159,281 128,151 80.4612 West Java 1,054,741 865,560 82.0613 Central Java 536,228 421,632 78.6314 DI Yogyakarta 45,751 39,096 85.4515 East Java 665,150 325,848 48.9916 Banten 231,382 183,658 79.3717 Bali 68,193 61,375 90.0018 West Nusa Tenggara 117,285 98,393 83.8919 East Nusa Tenggara 126,510 83,458 65.9720 West Kalimantan 103,782 82,025 79.0421 Central Kalimantan 53,752 23,050 42.8822 South Kalimantan 77,336 66,842 86.4323 East Kalimantan 84,273 58,631 69.5724 North Sulawesi 42,730 35,445 82.9525 Central Sulawesi 58,513 39,586 67.6526 South Sulawesi 184,312 64,509 35.0027 Southeast Sulawesi 58,736 40,469 68.9028 Gorontalo 27,099 14,683 54.1829 West Sulawesi 27,342 17,152 62.7330 Maluku 39,587 19,687 49.7331 North Maluku 25,704 8,312 32.3432 West Papua 18,265 5,096 27.9033 Papua 60,176 13,583 22.57<strong>Indonesia</strong>5,472,419 3,894,314 71.16Source : DG of Nutrition and Maternal and Chilren <strong>Health</strong> Care, MoH RI
Annex 4.22PERCENTAGE OF CHILDREN AGE 6-59 MONTHS HAVING VITAMIN A CAPSULEDURING LAST SIX MONTHS BY PROVINCE, RISKESDAS <strong>2010</strong>No Provinces Had Vitamin A Capsule(1) (2) (3)1 Aceh 66.22 North Sumatera 53.73 West Sumatera 71.64 Riau 58.95 Jambi 63.76 South Sumatera 55.77 Bengkulu 65.48 Lampung 65.59 Bangka Belitung Island 81.410 Riau Island 67.311 DKI Jakarta 72.912 West Java 75.713 Central Java 78.614 DI Yogyakarta 91.115 East Java 78.716 Banten 69.317 Bali 58.518 West Nusa Tenggara 70.719 East Nusa Tenggara 62.320 West Kalimantan 50.921 Central Kalimantan 59.722 South Kalimantan 70.123 East Kalimantan 72.724 North Sulawesi 74.325 Central Sulawesi 53.526 South Sulawesi 69.927 Southeast Sulawesi 61.328 Gorontalo 68.929 West Sulawesi 53.530 Maluku 50.431 North Maluku 49.632 West Papua 49.333 Papua<strong>Indonesia</strong>5569.8Source: National Board of <strong>Health</strong> Research and Development, MoH RI, Riskesdas <strong>2010</strong>
Annex 4.23PERCENTAGE OF POPULATION BY ENERGY SUFFICIENCY AND PROTEIN CONSUMPTIONRISKESDAS <strong>2010</strong>NoProvincesEnergy SufficiencyProtein ConsumptionAverage SD < 70% Average SD < 80%(1) (2) (3) (4) (5) (6) (7) (8)1 Aceh 83.4 28.3 39.6 120.2 62.6 25.62 North Sumatera 83.2 30.1 43.4 129.6 74.0 21.43 West Sumatera 90.6 31.8 31.0 114.5 56.0 28.54 Riau 83.9 28.8 39.3 116.5 64.1 30.85 Jambi 90.0 32.6 33.9 121.6 65.2 25.86 South Sumatera 80.2 26.7 45.4 97.6 48.2 42.47 Bengkulu 82.5 29.0 42.3 101.1 46.9 36.58 Lampung 82.6 28.9 43.3 96.3 49.6 44.79 Bangka Belitung Island 84.8 28.0 37.1 131.2 62.2 18.010 Riau Island 88.8 31.7 32.2 121.7 59.0 23.511 DKI Jakarta 84.9 30.2 39.9 112.8 68.3 30.712 West Java 80.7 26.9 44.3 98.5 48.7 41.913 Central Java 81.3 28.1 44.3 95.6 47.8 44.514 DI Yogyakarta 81.7 26.9 40.9 95.2 45.6 43.715 East Java 87.5 31.7 36.8 104.9 57.5 37.516 Banten 88.2 30.6 34.2 111.7 58.2 31.617 Bali 91.2 31.2 30.9 121.9 70.7 27.418 West Nusa Tenggara 80.7 27.9 46.7 103.6 52.4 36.619 East Nusa Tenggara 87.1 32.7 38.4 89.1 57.7 56.020 West Kalimantan 83.1 30.3 43.7 102.7 56.3 41.221 Central Kalimantan 87.4 32.5 39.0 108.1 53.2 33.722 South Kalimantan 85.1 30.5 39.3 116.4 60.8 28.023 East Kalimantan 84.0 30.0 41.3 114.9 57.1 30.224 North Sulawesi 90.9 34.4 35.7 115.8 58.6 30.725 Central Sulawesi 86.5 32.7 40.6 104.1 61.6 42.326 South Sulawesi 83.3 29.9 43.4 121.9 66.4 27.227 Southeast Sulawesi 84.8 32.9 45.5 114.2 70.8 31.928 Gorontalo 86.6 32.8 40.4 113.6 59.5 27.729 West Sulawesi 82.3 30.1 46.7 110.4 57.1 32.530 Maluku 84.7 29.2 38.4 91.8 46.0 47.831 North Maluku 85.4 32.1 41.9 91.4 52.4 49.032 West Papua 82.9 29.5 42.8 110.2 72.4 36.333 Papua 83.6 28.9 39.7 96.3 52.8 46.1<strong>Indonesia</strong>84.2 29.7 40.7 105.8 57.4 37.0Source: National Board of <strong>Health</strong> Research and Development, MoH RI, Riskesdas <strong>2010</strong>• Energy consumption under minimal need (< 70% based on Nutrition Sufficiency 2004 for <strong>Indonesia</strong> people)• Protein consumption under minimal need (< 80% based on Nutrition Sufficiency 2004 for <strong>Indonesia</strong> people)• SD = Standard Deviation
Annex 4.24COVERAGE OF UNIVERSAL CHILD IMMUNIZATION (UCI) VILLAGE BY PROVINCE2008 - <strong>2010</strong>2008 2009 <strong>2010</strong>No ProvincesNumber ofNumber ofNumber ofUCI Village %UCI Village %VillageVillageVillageUCI Village %(1) (2) (3) (4) (5) (6) (7) (8) (9) (10) (11)1 Aceh 6,483 1,841 28.40 6,436 2,444 37.97 6,471 3,408 52.672 North Sumatera 5,772 4,079 70.67 5,978 4,150 69.42 5,771 3,997 69.263 West Sumatera 3,380 2,297 67.96 3,437 3,284 95.55 3,437 3,335 97.034 Riau 1,559 1,171 75.11 1,642 935 56.94 1,642 925 56.335 Jambi 1,271 1,095 86.15 1,329 1,116 83.97 1,363 1,215 89.146 South Sumatera 251 235 93.63 3,103 2,559 82.47 3,108 2,637 84.857 Bengkulu 1,325 1,054 79.55 1,461 1,114 76.25 1,463 1,143 78.138 Lampung 2,310 1,511 65.41 2,247 1,008 44.86 2,401 2,048 85.309 Bangka Belitung Island 36 31 82.98 346 311 89.88 359 329 91.6410 Riau Island 317 222 65.55 333 222 66.67 351 223 63.5311 DKI Jakarta 282 234 86.83 267 267 100.00 267 265 99.2512 West Java 6,000 3,933 94.52 5,877 4,754 80.89 5,880 4,858 82.6213 Central Java 8,560 7,433 75.05 8,559 7,886 92.14 8,287 7,791 94.0114 DI Yogyakarta 438 414 69.54 438 432 98.63 438 438 100.0015 East Java 1,407 1,056 71.77 8,505 6,842 80.45 8,507 6,453 75.8616 Banten 1,504 875 72.21 1,454 986 67.81 1,510 1,238 81.9917 Bali 707 705 76.95 715 712 99.58 716 714 99.7218 West Nusa Tenggara 885 793 76.38 897 823 91.75 911 844 92.6519 East Nusa Tenggara 2,813 1,968 74.72 2,813 2,194 78.00 2,817 1,916 68.0220 West Kalimantan 1,520 1,057 81.78 1,858 1,161 62.49 1,873 1,134 60.5421 Central Kalimantan 1,456 1,045 65.86 1,479 1,012 68.42 1,492 1,160 77.7522 South Kalimantan 1,965 1,419 99.72 1,958 1,377 70.33 1,983 1,382 69.6923 East Kalimantan 1,410 1,085 89.60 1,417 828 58.43 1,417 895 63.1624 North Sulawesi 1,435 1,096 69.96 1,546 1,097 70.96 1,395 898 64.3725 Central Sulawesi 1,634 1,221 53.51 1,710 1,189 69.53 1,778 1,063 59.7926 South Sulawesi 2,898 2,370 21.30 2,941 2,459 83.61 2,947 2,420 82.1227 Southeast Sulawesi 1,939 1,277 58.18 1,989 768 38.61 2,028 1,422 70.1228 Gorontalo 601 371 49.22 606 399 65.84 622 382 61.4129 West Sulawesi 543 196 61.73 558 235 42.11 604 396 65.5630 Maluku 1,069 572 86.11 893 579 64.84 953 696 73.0331 North Maluku 967 476 14.35 967 499 51.60 1,033 523 50.6332 West Papua 683 98 70.03 1,253 265 21.15 1,106 443 40.0533 Papua 2,361 503 36.10 3,380 782 23.14 1,060 635 59.91<strong>Indonesia</strong>65,781 43,733 66.48 78,392 54,689 69.76 75,990 57,226 75.31Source: DG of Disease Control and Environmental <strong>Health</strong>, MoH RI
Annex 4.25COVERAGE OF INFANTS BASIC IMMUNIZATIONBY PROVINCE, <strong>2010</strong>Immunization in InfantsNo Provinces TargetBCGHB0 DPT/HB(1) DPT/HB(3) POLIO4 MeaslesTotal % Total % Total % Total % Total % Total %(1) (2) (3) (4) (5) (6) (7) (8) (9) (10) (11) (12) (13) (14) (15)1 Aceh 105,179 93,664 89.05 59,632 56.70 92,694 88.13 86,627 82.36 89,359 84.96 85,442 81.232 North Sumatera 318,459 303,553 95.32 203,697 63.96 307,235 96.48 292,467 91.84 296,251 93.03 297,046 93.283 West Sumatera 105,391 90,753 86.11 63,821 60.56 91,809 87.11 85,987 81.59 84,243 79.93 82,529 78.314 Riau 133,569 124,549 93.25 79,821 59.76 126,276 94.54 123,246 92.27 121,645 91.07 121,565 91.015 Jambi 72,531 74,217 102.32 58,543 80.71 75,286 103.80 73,748 101.68 73,893 101.88 75,281 103.796 South Sumatera 175,904 173,409 98.58 117,888 67.02 177,104 100.68 173,739 98.77 172,289 97.94 171,987 97.777 Bengkulu 41,010 40,154 97.91 27,341 66.67 40,788 99.46 39,014 95.13 38,437 93.73 40,437 98.608 Lampung 167,091 156,940 93.92 112,440 67.29 159,590 95.51 158,485 94.85 152,308 91.15 156,548 93.699 Bangka Belitung Island 22,520 24,857 110.38 22,657 100.61 25,027 111.13 24,094 106.99 23,893 106.10 24,662 109.5110 Riau Island 39,936 37,320 93.45 29,560 74.02 39,631 99.24 38,934 97.49 37,511 93.93 38,479 96.3511 DKI Jakarta 166,834 177,467 106.37 123,448 73.99 179,255 107.45 175,952 105.47 177,050 106.12 165,314 99.0912 West Java 939,420 946,038 100.70 783,953 83.45 941,049 100.17 917,853 97.70 883,117 94.01 892,652 95.0213 Central Java 579,053 581,099 100.35 546,932 94.45 579,205 100.03 568,389 98.16 550,622 95.09 557,971 96.3614 DI Yogyakarta 43,625 44,801 102.70 41,785 95.78 43,859 100.54 43,059 98.70 42,779 98.06 43,662 100.0815 East Java 595,104 608,000 102.17 537,270 90.28 609,766 102.46 595,019 99.99 590,937 99.30 580,727 97.5816 Banten 209,167 203,130 97.11 164,852 78.81 208,732 99.79 199,881 95.56 201,122 96.15 201,338 96.2617 Bali 62,006 62,120 100.18 59,338 95.70 63,632 102.62 61,407 99.03 61,458 99.12 61,787 99.6518 West Nusa Tenggara 105,250 109,449 103.99 101,844 96.76 113,920 108.24 111,832 106.25 111,754 106.18 109,061 103.6219 East Nusa Tenggara 128,907 103,083 79.97 59,188 45.92 105,257 81.65 100,131 77.68 100,165 77.70 102,613 79.6020 West Kalimantan 101,397 91,280 90.02 51,390 50.68 92,410 91.14 87,810 86.60 85,818 84.64 86,394 85.2021 Central Kalimantan 46,459 46,419 99.91 20,640 44.43 46,050 99.12 44,182 95.10 43,390 93.39 44,254 95.2522 South Kalimantan 70,725 65,503 92.62 40,414 57.14 64,999 91.90 61,241 86.59 60,886 86.09 60,013 84.8523 East Kalimantan 76,422 71,411 93.44 49,306 64.52 72,981 95.50 69,814 91.35 67,880 88.82 68,743 89.9524 North Sulawesi 46,587 43,094 92.50 24,633 52.88 41,914 89.97 39,381 84.53 41,013 88.04 39,554 84.9025 Central Sulawesi 53,890 50,175 93.11 28,223 52.37 49,667 92.16 46,741 86.73 47,236 87.65 45,972 85.3126 South Sulawesi 166,454 161,026 96.74 132,135 79.38 163,040 97.95 157,507 94.62 157,844 94.83 155,115 93.1927 Southeast Sulawesi 52,338 51,100 97.63 18,047 34.48 49,186 93.98 43,866 83.81 43,546 83.20 43,711 83.5228 Gorontalo 26,465 25,310 95.64 19,073 72.07 24,996 94.45 24,764 93.57 24,977 94.38 23,822 90.0129 West Sulawesi 24,766 22,845 92.24 12,283 49.60 23,160 93.52 21,754 87.84 22,412 90.50 22,694 91.6330 Maluku 38,106 32,679 85.76 14,944 39.22 34,097 89.48 31,403 82.41 31,286 82.10 31,996 83.9731 North Maluku 23,581 20,667 87.64 9,239 39.18 21,848 92.65 20,445 86.70 20,432 86.65 19,959 84.6432 West Papua 18,943 13,862 73.18 6,121 32.31 14,646 77.32 12,760 67.36 12,189 64.35 12,945 68.3433 Papua 50,454 37,260 73.85 16,775 33.25 39,926 79.13 32,723 64.86 31,245 61.93 36,183 71.71<strong>Indonesia</strong>4,807,543 4,687,234 97.50 3,637,233 75.66 4,719,035 98.16 4,564,255 94.94 4,498,987 93.58 4,500,456 93.61Source: DG of Disease Control and Environmental <strong>Health</strong>, MoH RI
Annex 4.26PERCENTAGE OF CHILDREN AGE 12-23 MONTHS GETTING BASIC IMMUNIZATION BY PROVINCE,RISKESDAS <strong>2010</strong>No ProvincesBasic ImmunizationBCG Polio 4 DPT-HB3 Measles(1) (2) (3) (4) (5) (6)1 Aceh 57.3 52.4 40.2 62.22 North Sumatera 56.9 49.6 43.5 58.13 West Sumatera 71.8 63.5 51.0 66.34 Riau 63.3 53.9 50.0 61.75 Jambi 78.6 72.9 65.7 72.56 South Sumatera 72.1 57.4 53.9 73.67 Bengkulu 74.2 62.1 51.6 73.38 Lampung 80.6 77.4 72.9 83.59 Bangka Belitung Island 87.1 77.4 72.4 76.710 Riau Island 89.7 84.6 79.5 92.111 DKI Jakarta 89.3 68.6 62.5 76.712 West Java 80.9 67.2 61.4 72.813 Central Java 90.1 80.2 77.5 86.214 DI Yogyakarta 100.0 96.4 96.4 96.415 East Java 83.0 77.3 74.2 81.616 Banten 76.3 64.5 57.7 69.317 Bali 83.6 78.6 72.7 83.618 West Nusa Tenggara 90.1 70.3 69.2 87.019 East Nusa Tenggara 75.2 45.3 41.9 76.120 West Kalimantan 63.9 58.3 57.7 60.421 Central Kalimantan 81.0 64.3 62.8 83.322 South Kalimantan 76.3 67.1 60.0 70.023 East Kalimantan 83.3 73.1 70.5 80.824 North Sulawesi 86.7 73.3 70.0 90.025 Central Sulawesi 60.0 49.2 44.6 62.126 South Sulawesi 77.6 65.2 57.8 77.027 Southeast Sulawesi 65.3 50.0 44.9 66.728 Gorontalo 72.7 56.5 52.2 68.229 West Sulawesi 60.7 46.4 35.7 57.130 Maluku 76.7 58.6 56.7 63.331 North Maluku 64.3 55.2 57.1 65.532 West Papua 65.2 50.0 45.5 73.933 Papua 53.6 40.5 36.5 47.1<strong>Indonesia</strong>77.9 66.7 61.9 74.4Source: National Board of <strong>Health</strong> Research and Development, MoH RI, Riskesdas <strong>2010</strong>
Annex 4.27PERCENTAGE OF CHILDREN AGE 12-23 MONTHS GETTING COMPLETE BASIC IMMUNIZATIONBY PROVINCE, RISKESDAS <strong>2010</strong>No ProvincesCompleteness of Basic ImmunizationComplete Incomplete No Immunization(1) (2) (3) (4) (5)1 Aceh 37.0 42.0 21.02 North Sumatera 33.3 43.1 23.63 West Sumatera 48.1 32.7 19.24 Riau 37.5 37.5 25.05 Jambi 60.9 20.3 18.86 South Sumatera 44.7 39.7 15.67 Bengkulu 46.7 36.7 16.78 Lampung 65.4 25.6 9.09 Bangka Belitung Island 60.0 26.7 13.310 Riau Island 74.4 20.5 5.111 DKI Jakarta 53.2 41.1 5.712 West Java 52.3 37.2 10.413 Central Java 69.0 27.3 3.814 DI Yogyakarta 91.1 8.9 0.015 East Java 66.0 25.8 8.216 Banten 48.8 38.6 12.617 Bali 66.1 28.6 5.418 West Nusa Tenggara 62.6 34.1 3.319 East Nusa Tenggara 33.3 53.0 13.720 West Kalimantan 52.1 19.8 28.121 Central Kalimantan 54.8 33.3 11.922 South Kalimantan 52.5 27.5 20.023 East Kalimantan 64.1 25.6 10.324 North Sulawesi 65.5 31.0 3.425 Central Sulawesi 35.4 38.5 26.226 South Sulawesi 50.9 38.5 10.627 Southeast Sulawesi 37.5 41.7 20.828 Gorontalo 54.5 22.7 22.729 West Sulawesi 32.1 39.3 28.630 Maluku 46.7 36.7 16.731 North Maluku 44.8 27.6 27.632 West Papua 39.1 43.5 17.433 Papua 28.2 36.5 35.3<strong>Indonesia</strong>53.8 33.5 12.7Source: National Board of <strong>Health</strong> Research and Development, MoH RI, Riskesdas <strong>2010</strong>
Annex 4.28DROP OUT RATE OF IMMUNIZATION COVERAGE DPT-HB1 - MEASLES IN INFANTS BY PROVINCE2007 - <strong>2010</strong>YearNoProvinces<strong>2010</strong>2007 2008 2009DPT-HB1-Measles DPT-HB1 - DPT-HB3(1) (2) (3) (4) (5) (6) (7)1 Aceh 21.6 13.2 6.7 7.8 6.52 North Sumatera 1.3 4.4 5.3 3.3 4.83 West Sumatera 15.0 7.8 8.9 10.1 6.34 Riau 7.2 6.8 7.8 3.7 2.45 Jambi 7.8 5.5 3.6 0.0 2.06 South Sumatera 6.9 4.7 5.8 2.9 1.97 Bengkulu 17.8 4.9 3.0 0.9 4.38 Lampung (1.1) 2.7 9.1 1.9 0.79 Bangka Belitung Island 4.0 7.3 3.9 1.5 3.710 Riau Island 10.7 9.6 5.5 2.9 1.811 DKI Jakarta 0.6 8.2 6.9 7.8 1.812 West Java 5.7 4.7 4.3 5.1 2.513 Central Java 4.3 3.2 4.2 3.7 1.914 DI Yogyakarta (0.8) (0.8) (1.0) 0.4 1.815 East Java 5.9 4.3 4.3 4.8 2.416 Banten 1.4 5.4 6.2 3.5 4.217 Bali 4.5 10.8 2.1 2.9 3.518 West Nusa Tenggara 4.0 3.1 4.0 4.3 1.819 East Nusa Tenggara 22.7 11.6 1.2 2.5 4.920 West Kalimantan 13.1 5.1 8.3 6.5 5.021 Central Kalimantan 3.3 5.4 5.5 3.9 4.122 South Kalimantan 7.0 6.1 5.7 7.7 5.823 East Kalimantan 4.3 7.8 7.3 5.8 4.324 North Sulawesi 10.6 4.5 4.3 5.6 6.025 Central Sulawesi 11.0 8.2 7.0 7.4 5.926 South Sulawesi 4.2 5.4 4.1 4.9 3.427 Southeast Sulawesi 5.8 6.4 9.5 11.1 10.828 Gorontalo 6.8 7.1 2.8 4.7 0.929 West Sulawesi (1.5) 9.8 12.2 2.0 6.130 Maluku 3.4 8.6 15.8 6.2 7.931 North Maluku 7.2 13.9 3.3 8.6 6.432 West Papua 19.8 19.9 6.3 11.6 12.933 Papua 21.6 13.8 3.8 9.4 18.0<strong>Indonesia</strong>6.1 5.4 5.2 4.6 3.3Source: DG of Disease Control and Environmental <strong>Health</strong>, MoH RI
Annex 4.29COVERAGE OF STUDENTS IMMUNIZATIONBY PROVINCE, <strong>2010</strong>Target Measless (1 st Class) DT (1 st Class) TT (2 nd Class) TT (3 rd Class) TT (2 nd + 3 rd Class)No Districts/Municipalities1 st Class 2 nd Class 3 rd 2 nd + 3 rdClassClassTotal % Total % Total % Total % Total %(1) (2) (3) (4) (5) (6) (7) (8) (9) (10) (11) (12) (13) (14) (15) (16)1 Aceh 105,472 104,126 105,230 209,356 79,515 75.4 91,427 86.7 92,291 88.6 96,062 91.3 188,353 90.02 North Sumatera 330,560 310,253 301,857 612,110 258,895 78.3 321,870 97.4 302,964 97.7 295,826 98.0 598,790 97.83 West Sumatera 121,345 120,994 114,132 235,126 107,656 88.7 111,825 93.0 120,121 99.3 104,292 91.4 224,413 95.44 Riau 151,637 142,224 137,546 417,147 127,561 84.1 132,204 87.2 129,052 90.7 122,314 88.9 242,144 58.05 Jambi 78,754 74,144 70,967 145,111 75,430 95.8 75,441 95.8 71,487 96.4 69,263 97.6 140,750 97.06 South Sumatera 190,466 175,603 167,207 342,810 183,965 96.6 178,769 93.9 171,308 97.6 163,046 97.5 74,563 21.87 Bengkulu 44,066 40,132 38,882 79,014 37,306 84.7 37,003 84.5 34,717 86.5 33,191 85.4 67,908 85.98 Lampung 177,332 172,917 171,076 343,993 170,193 96.0 165,573 93.4 161,593 93.5 160,160 93.6 321,753 93.59 Bangka Belitung Island 29,243 25,536 25,375 50,911 28,152 96.3 25,776 88.1 24,499 95.9 24,150 95.2 48,649 95.610 Riau Island 37,895 34,395 33,281 67,676 33,424 88.2 34,676 91.5 31,185 90.7 30,045 90.3 61,230 90.511 DKI Jakarta 166,546 - - - 152,050 91.3 - - - - - - - -12 West Java 865,838 810,923 781,846 1,592,769 802,171 92.6 790,536 92.8 625,771 77.2 597,550 76.4 1,223,322 76.813 Central Java 599,206 - - 1,230,909 590,448 98.5 603,500 98.4 - - - - 1,233,092 100.214 DI Yogyakarta 51,293 51,906 53,458 105,364 49,912 97.3 51,103 99.6 52,873 101.9 52,461 98.1 105,334 100.015 East Java 676,896 662,714 658,368 1,321,082 626,598 92.6 627,924 92.8 618,040 93.3 608,268 92.4 1,226,308 92.816 Banten 238,340 210,970 206,348 417,318 221,417 92.9 222,335 93.3 191,987 91.0 214,143 103.8 406,130 97.317 Bali 73,671 74,552 73,993 148,545 73,258 99.4 74,548 101.2 73,974 99.2 73,347 99.1 147,321 99.218 West Nusa Tenggara 112,601 104,961 104,497 209,458 107,940 95.9 108,652 96.5 101,225 96.4 100,705 96.4 201,930 96.419 East Nusa Tenggara 247,956 - - 460,491 178,535 72.0 204,496 82.5 - - - - 276,366 60.020 West Kalimantan 133,614 118,127 111,717 229,844 123,282 92.3 115,560 86.5 111,618 94.5 105,063 94.0 216,681 94.321 Central Kalimantan 25,226 23,710 22,586 46,296 18,438 73.1 24,070 93.7 22,537 95.1 21,374 94.6 43,911 94.822 South Kalimantan 89,771 - - - 85,679 95.4 - - - - - - - -23 East Kalimantan 81,700 75,175 73,460 148,635 74,019 90.6 75,828 92.8 70,581 93.9 68,367 93.1 138,948 93.524 North Sulawesi 28,901 27,930 28,248 56,178 26,894 93.1 26,571 91.9 26,013 93.1 26,111 92.4 52,124 92.825 Central Sulawesi 53,821 48,572 47,622 96,194 44,982 83.6 49,979 92.9 39,033 80.4 43,266 90.9 82,299 85.626 South Sulawesi 185,490 186,342 179,417 365,759 161,088 86.8 171,245 92.3 172,178 92.4 165,829 92.4 324,997 88.927 Southeast Sulawesi 67,487 44,738 42,496 87,234 67,608 100.2 67,715 100.3 44,672 99.9 43,500 102.4 88,172 101.128 Gorontalo 16,963 17,539 19,173 36,712 7,854 46.3 14,595 86.0 15,628 89.1 17,707 92.4 33,335 90.829 West Sulawesi 35,474 33,513 68,987 - - 29,211 79.6 28,349 79.9 26,621 79.4 54,970 79.730 Maluku 27,199 16,468 16,734 33,202 16,412 60.3 25,028 92.0 15,444 93.8 15,657 93.6 31,101 93.731 North Maluku 22,458 18,781 18,138 36,919 18,989 84.6 18,468 82.2 16,195 86.2 15,553 85.7 31,748 86.032 West Papua - - - - - - - - - - - - - -33 Papua - - - - - - - - - - - - - -<strong>Indonesia</strong>5,031,747 3,729,206 3,637,167 9,195,150 4,549,671 90.4 3,995,588 83.7 2,910,451 78.0 2,844,043 78.2 6,981,930 75.9Source: DG of Disease Control and Environmental <strong>Health</strong>, MoH RI
Annex 4.30NoProvincesNumber ofPregnantWomenCOVERAGE OF TETANUS TOXOID IMMUNIZATION IN PREGNANT WOMENBY PROVINCE, <strong>2010</strong>Immunization in Pregnant WomenTT1TT2 TT3 TT4 TT5 TT2+Total % Total % Total % Total % Total % Total %(1) (2) (3) (4) (5) (6) (7) (8) (9) (10) (11) (12) (13) (14) (15)1 Aceh 113,107 48,074 42.50 45,264 40.02 19,079 16.87 12,908 11.41 11,986 10.60 89,237 78.902 North Sumatera 349,352 101,542 29.07 100,267 28.70 47,379 13.56 33,792 9.67 27,350 7.83 208,788 59.763 West Sumatera 113,857 37,277 32.74 35,661 31.32 16,920 14.86 14,841 13.03 10,587 9.30 78,009 68.514 Riau 149,188 37,210 24.94 38,417 25.75 28,703 19.24 26,897 18.03 24,705 16.56 118,722 79.585 Jambi 79,735 55,492 69.60 47,783 59.93 10,292 12.91 2,283 2.86 1,007 1.26 61,365 76.966 South Sumatera 190,512 161,730 84.89 153,454 80.55 0 0.00 0 0.00 0 0.00 153,454 80.557 Bengkulu 41,316 33,966 82.21 32,140 77.79 470 1.14 341 0.83 426 1.03 33,377 80.788 Lampung 180,530 54,863 30.39 54,620 30.26 22,954 12.71 19,858 11.00 16,487 9.13 113,919 63.109 Bangka Belitung Island 28,109 8,740 31.09 8,521 30.31 4,734 16.84 3,265 11.62 2,319 8.25 18,839 67.0210 Riau Island 49,096 18,894 38.48 15,771 32.12 5,100 10.39 3,688 7.51 3,458 7.04 28,017 57.0711 DKI Jakarta 95,858 39,239 40.93 35,370 36.90 732 0.76 0 0.00 0 0.00 36,102 37.6612 West Java 1,033,362 828,546 80.18 757,088 73.26 82,853 8.02 50,115 4.85 40,769 3.95 930,825 90.0813 Central Java 721,796 208,188 28.84 208,540 28.89 127,151 17.62 105,279 14.59 87,001 12.05 527,971 73.1514 DI Yogyakarta 47,909 12,465 26.02 12,087 25.23 9,242 19.29 6,192 12.92 4,359 9.10 31,880 66.5415 East Java 653,446 25,089 3.84 25,697 3.93 33,954 5.20 54,773 8.38 66,189 10.13 180,614 27.6416 Banten 230,637 142,342 61.72 128,151 55.56 35,561 15.42 23,525 10.20 19,650 8.52 206,887 89.7017 Bali 68,119 2,375 3.49 2,030 2.98 4,015 5.89 20,912 30.70 43,503 63.86 70,460 103.4418 West Nusa Tenggara 115,775 104,091 89.91 99,175 85.66 0 0.00 0 0.00 0 0.00 99,175 85.6619 East Nusa Tenggara 136,088 59,717 43.88 43,715 32.12 31,947 23.48 21,950 16.13 17,921 13.17 115,533 84.9020 West Kalimantan 106,277 40,014 37.65 37,907 35.67 12,022 11.31 8,463 7.96 7,878 7.41 66,270 62.3621 Central Kalimantan 51,178 40,599 79.33 36,840 71.98 2,171 4.24 720 1.41 356 0.70 40,087 78.3322 South Kalimantan 78,362 47,086 60.09 42,796 54.61 4,965 6.34 3,845 4.91 2,790 3.56 54,396 69.4223 East Kalimantan 84,059 24,897 29.62 21,843 25.99 11,179 13.30 7,394 8.80 6,277 7.47 46,693 55.5524 North Sulawesi 49,584 20,000 40.34 17,327 34.94 1,186 2.39 450 0.91 74 0.15 19,037 38.3925 Central Sulawesi 59,764 38,291 64.07 35,571 59.52 403 0.67 183 0.31 112 0.19 36,269 60.6926 South Sulawesi 184,137 120,133 65.24 105,818 57.47 24,524 13.32 14,005 7.61 8,858 4.81 153,205 83.2027 Southeast Sulawesi 58,691 19,864 33.84 22,311 38.02 8,704 14.83 7,033 11.98 6,287 10.71 44,335 75.5428 Gorontalo 28,762 20,810 72.35 17,570 61.09 3,308 11.50 2,216 7.70 1,500 5.22 24,594 85.5129 West Sulawesi 26,688 19,718 73.88 15,749 59.01 2,013 7.54 1,052 3.94 941 3.53 19,755 74.0230 Maluku 40,269 18,512 45.97 15,976 39.67 3,677 9.13 2,051 5.09 1,928 4.79 23,632 58.6931 North Maluku 24,173 14,560 60.23 12,878 53.27 2,682 11.10 1,693 7.00 1,697 7.02 18,950 78.3932 West Papua 20,395 4,577 22.44 3,540 17.36 2,101 10.30 1,230 6.03 1,016 4.98 7,886 38.6733 Papua 55,081 18,506 33.60 16,617 30.17 4,832 8.77 5,212 9.46 1,765 3.20 28,426 51.61<strong>Indonesia</strong>5,265,212 2,427,406 46.10 2,246,494 42.67 564,853 10.73 456,166 8.66 419,196 7.96 3,686,709 70.02Source: DG of Disease Control and Environmental <strong>Health</strong>, MoH RI
Annex 4.31PERCENTAGE OF MOTHER GETTING TETANUS TOXOID INJECTION DURING LAST CHILDREN PREGNANCYBY PROVINCE, RISKESDAS <strong>2010</strong>NoProvincesInjection of Tetanus Toxoid (TT) during pregnancy1 time 2 times/more No immunization Unknown(1) (2) (3) (4) (5) (6)1 Aceh 18.3 45.8 31.8 4.12 North Sumatera 13.5 32.2 43.6 10.73 West Sumatera 22.7 45.3 27.2 4.74 Riau 21.4 42.0 31.6 5.05 Jambi 21.5 54.9 20.0 3.66 South Sumatera 15.5 47.2 32.4 4.97 Bengkulu 13.3 62.3 19.2 5.38 Lampung 20.4 56.6 15.3 7.79 Bangka Belitung Island 19.3 54.9 24.0 1.810 Riau Island 28.0 29.5 38.6 3.811 DKI Jakarta 26.2 38.3 29.7 5.912 West Java 20.0 55.9 19.9 4.313 Central Java 30.4 47.4 17.8 4.414 DI Yogyakarta 38.7 46.6 13.0 1.715 East Java 38.6 22.8 33.9 4.716 Banten 23.9 47.5 24.8 3.817 Bali 30.1 60.9 7.8 1.218 West Nusa Tenggara 16.3 68.8 13.9 1.019 East Nusa Tenggara 26.4 53.3 16.4 3.920 West Kalimantan 22.1 45.0 28.4 4.521 Central Kalimantan 13.9 70.4 14.9 0.922 South Kalimantan 23.6 54.1 16.6 5.623 East Kalimantan 30.8 46.7 20.3 2.124 North Sulawesi 15.3 71.4 9.5 3.825 Central Sulawesi 22.2 55.2 18.3 4.326 South Sulawesi 21.6 60.8 15.3 2.327 Southeast Sulawesi 17.7 64.0 14.0 4.228 Gorontalo 23.1 54.1 14.7 8.129 West Sulawesi 15.4 59.6 21.2 3.830 Maluku 14.3 70.4 14.2 1.131 North Maluku 15.9 60.5 22.0 1.532 West Papua 12.5 62.1 20.8 4.633 Papua 25.2 55.6 13.4 5.8<strong>Indonesia</strong>24.7 47.2 23.6 4.6Source: National Board of <strong>Health</strong> Research and Development, MoH RI, Riskesdas <strong>2010</strong>
Annex 4.32NoProvincesNumber ofFertile AgeWomenCOVERAGE OF TETANUS TOXOID IMMUNIZATION IN PRODUCTIVE AGE WOMENBY PROVINCE, <strong>2010</strong>Productive Age Women which were ImmunizedTT1 TT2 TT3 TT4 TT5Total % Total % Total % Total % Total %(1) (2) (3) (4) (5) (6) (7) (8) (9) (10) (11) (12) (13)1 Aceh 1,029,686 63,874 6.20 56,760 5.51 43,343 4.21 32,461 3.15 27,280 2.652 North Sumatera 2,548,620 55,419 2.17 53,094 2.08 38,886 1.53 38,870 1.53 52,060 2.043 West Sumatera 879,158 12,055 1.37 7,961 0.91 9,788 1.11 6,227 0.71 9,278 1.064 Riau 1,155,427 9,411 0.81 8,165 0.71 7,892 0.68 4,601 0.40 3,749 0.325 Jambi 659,278 18,364 2.79 12,966 1.97 695 0.11 395 0.06 386 0.066 South Sumatera - - - - - - - - - - -7 Bengkulu 343,528 1,172 0.34 470 0.14 417 0.12 881 0.26 1,173 0.348 Lampung 1,753,547 9,564 0.55 10,185 0.58 8,341 0.48 7,757 0.44 6,896 0.399 Bangka Belitung Island 249,081 1,423 0.57 1,195 0.48 1,053 0.42 508 0.20 317 0.1310 Riau Island 371,356 8,818 2.37 5,748 1.55 2,206 0.59 2,009 0.54 1,778 0.4811 DKI Jakarta 144,343 16,130 11.17 5,132 3.56 9,828 6.81 35,851 24.84 42,478 29.4312 West Java - - - - - - - - - - -13 Central Java 5,190,053 200,970 3.87 172,078 3.32 273,552 5.27 325,600 6.27 574,762 11.0714 DI Yogyakarta - 8,649 - 3,062 - 1,410 - 701 - 122 -15 East Java 7,961,408 42,173 0.53 51,003 0.64 114,701 1.44 163,438 2.05 265,119 3.3316 Banten 1,981,063 23,564 1.19 23,637 1.19 28,189 1.42 25,587 1.29 30,015 1.5217 Bali 625,466 123 0.02 244 0.04 1,584 0.25 6,208 0.99 10,162 1.6218 West Nusa Tenggara - - - - - - - - - - -19 East Nusa Tenggara - - - - - - - - - - -20 West Kalimantan 855,215 20,467 2.39 20,760 2.43 20,520 2.40 21,527 2.52 25,206 2.9521 Central Kalimantan 425,665 5,973 1.40 3,634 0.85 1,053 0.25 944 0.22 1,070 0.2522 South Kalimantan 657,888 37,187 5.65 25,315 3.85 2,179 0.33 1,625 0.25 1,084 0.1623 East Kalimantan 691,492 11,579 1.67 10,372 1.50 10,068 1.46 7,700 1.11 7,275 1.0524 North Sulawesi 443,497 1,529 0.34 545 0.12 143 0.03 41 0.01 16 0.0025 Central Sulawesi 538,665 3,778 0.70 3,441 0.64 4,293 0.80 4,977 0.92 9,119 1.6926 South Sulawesi 1,534,561 12,385 0.81 6,122 0.40 5,418 0.35 3,749 0.24 2,484 0.1627 Southeast Sulawesi - - - - - - - - - - -28 Gorontalo 218,952 5,641 2.58 4,154 1.90 3,354 1.53 2,116 0.97 1,789 0.8229 West Sulawesi 214,771 356 0.17 584 0.27 224 0.10 141 0.07 90 0.0430 Maluku 321,544 8,549 2.66 7,094 2.21 4,912 1.53 3,540 1.10 3,318 1.0331 North Maluku 217,520 7,883 3.62 3,776 1.74 4,794 2.20 3,643 1.67 2,567 1.1832 West Papua 124,700 1,269 1.02 1,111 0.89 1,065 0.85 1,572 1.26 676 0.5433 Papua 583,594 2,786 0.48 1,510 0.26 912 0.16 554 0.09 435 0.07<strong>Indonesia</strong>31,720,078 591,091 1.84 500,118 1.57 600,820 1.89 703,224 2.21 1,080,704 3.41Source: DG of Disease Control and Environmental <strong>Health</strong>, MoH RI
Annex 4.33No.All Cases AFB+ Total % Total % Treatments(1) (2) (3) (4) (5) (6) (7) (8) (9) (10)1 Aceh 3,966 3,065 2,681 87.47 172 5.61 2,853 93.082 North Sumatera 16,815 13,897 12,984 93.43 367 2.64 13,351 96.073 West Sumatera 5,482 3,732 2,950 79.05 351 9.41 3,301 88.454 Riau 4,325 2,880 1,840 63.89 572 19.86 2,412 83.755 Jambi 3,291 2,745 2,458 89.54 127 4.63 2,585 94.176 South Sumatera 7,779 5,181 4,641 89.58 284 5.48 4,925 95.067 Bengkulu 1,941 1,588 1,371 86.34 135 8.50 1,506 94.848 Lampung 7,266 4,943 4,284 86.67 323 6.53 4,607 93.209 Bangka Belitung Island 1,229 951 837 88.01 20 2.10 857 90.1210 Riau Island 1,695 784 471 60.08 172 21.94 643 82.0211 DKI Jakarta 25,074 7,989 5,749 71.96 1,108 13.87 6,857 85.8312 West Java 61,964 31,433 27,153 86.38 1,813 5.77 28,966 92.1513 Central Java 34,671 16,906 14,365 84.97 926 5.48 15,291 90.4514 DI Yogyakarta 2,345 1,155 893 77.32 79 6.84 972 84.1615 East Java 38,010 22,598 19,165 84.81 1,293 5.72 20,458 90.5316 Banten 15,629 8,134 7,031 86.44 560 6.88 7,591 93.3217 Bali 3,227 1,517 1,154 76.07 186 12.26 1,340 88.3318 West Nusa Tenggara 5,346 3,089 2,436 78.86 472 15.28 2,908 94.1419 East Nusa Tenggara 5,302 3,369 2,634 78.18 467 13.86 3,101 92.0520 West Kalimantan 5,499 4,156 3,733 89.82 128 3.08 3,861 92.9021 Central Kalimantan 2,090 1,339 1,116 83.35 153 11.43 1,269 94.7722 South Kalimantan 4,609 2,891 2,587 89.48 127 4.39 2,714 93.8823 East Kalimantan 3,694 2,065 1,407 68.14 355 17.19 1,762 85.3324 North Sulawesi 4,989 3,988 3,596 90.17 237 5.94 3,833 96.1125 Central Sulawesi 2,397 1,918 1,689 88.06 111 5.79 1,800 93.8526 South Sulawesi 8,223 6,428 5,615 87.35 163 2.54 5,778 89.8927 Southeast Sulawesi 2,663 2,296 1,920 83.62 246 10.71 2,166 94.3428 Gorontalo 1,620 1,370 1,117 81.53 191 13.94 1,308 95.4729 West Sulawesi 1,179 942 809 85.88 61 6.48 870 92.3630 Maluku 2,702 2,014 1,530 75.97 421 20.90 1,951 96.8731 North Maluku 1,096 708 392 55.37 207 29.24 599 84.6032 West Papua 1,559 638 224 35.11 84 13.17 308 48.2833 Papua 7,054 2,504 1,146 45.77 405 16.17 1,551 61.94<strong>Indonesia</strong>294,731 169,213 141,978 83.90 12,316 7.28 154,294 91.18Source: DG of Disease Control and Environmental <strong>Health</strong>, MoH RINotes:AFB =Acid Flacid BaccileProvincesCOVERAGE OF PULMONARY TB AFB POSITIVE, HEALED, COMPLETE MEDICATIONAND SUCCES RATE (AFTER TB MEDICATION YEAR 2009) BY PROVINCE, <strong>2010</strong>Coverage of TB <strong>2010</strong>Recovered Complete Treatments Recovered& CompleteSuccessRate (%)
Annex 4.34PERCENTAGE OF TUBERCULOSIS PATIENT HAD FINISHED TREATMENTS WITH ANTI TUBERCULOSIS DRUG BY PROVINCE,RISKESDAS <strong>2010</strong>Taking medicationNo. ProvincesNot finished < 5Finished > 6 months In treatmentmonthsNot took treatments(1) (2) (3) (4) (5) (6)1 Aceh 52.8 23.0 18.2 5.92 North Sumatera 61.7 31.3 7.1 0.03 West Sumatera 63.1 14.1 17.8 5.04 Riau 67.4 25.9 6.6 0.05 Jambi 24.9 37.1 32.8 5.26 South Sumatera 50.6 27.5 21.9 0.07 Bengkulu 62.5 15.0 22.6 0.08 Lampung 66.7 12.8 20.5 0.09 Bangka Belitung Island 88.3 0.0 11.7 0.010 Riau Island 73.8 17.8 0.0 8.511 DKI Jakarta 62.9 19.8 17.3 0.012 West Java 57.1 19.0 23.3 0.613 Central Java 52.5 16.5 26.2 4.814 DI Yogyakarta 100 0.0 0.0 0.015 East Java 62.2 16.5 17.1 4.316 Banten 54.9 21.2 19.3 4.517 Bali 69.9 18.9 11.2 0.018 West Nusa Tenggara 63.5 9.3 24.1 3.119 East Nusa Tenggara 80.9 6.4 0.0 12.720 West Kalimantan 46.9 14.9 35.2 3.021 Central Kalimantan 48.3 23.8 13.9 13.922 South Kalimantan 89.9 4.7 5.4 0.023 East Kalimantan 57.4 42.6 0.0 0.024 North Sulawesi 68.0 17.8 14.2 0.025 Central Sulawesi 66.7 11.5 21.9 0.026 South Sulawesi 47.5 28.6 20.9 3.027 Southeast Sulawesi 84.6 15.4 0.0 0.028 Gorontalo 51.2 29.4 19.4 0.029 West Sulawesi 75.0 12.5 0.0 12.530 Maluku 46.7 14.8 38.5 0.031 North Maluku 82.8 0.0 17.2 0.032 West Papua 51.3 14.0 34.6 0.033 Papua 61.3 31.1 7.6 0.0<strong>Indonesia</strong>59.0 19.1 19.3 2.6Source: National Board of <strong>Health</strong> Research and Development, MoH RI, Riskesdas <strong>2010</strong>Notes: * Anti Tuberculosis Drug
Annex 4.35No.ProvincesUnderfive Populationin <strong>Health</strong> Center AreaNUMBER OF UNDERFIVES PNEUMONIA CASESBY PROVINCE, <strong>2010</strong>Target of PneumoniaUnderfives DetectionRealization of Underfive Patients of PneumoniaProgram(10%)< 1 Year 1 - 4 Years Total %(1) (2) (3) (4) (5) (6) (7) (8)1 Aceh 470,901 47,090 484 1,178 1,662 3.532 North Sumatera 1,446,302 144,630 19,236 18,483 37,719 26.083 West Sumatera 501,300 50,130 2,649 7,895 10,544 21.034 Riau 611,901 61,190 2,363 7,321 9,684 15.835 Jambi 285,900 28,590 1,186 2,994 4,180 14.626 South Sumatera 727,901 72,790 8,448 12,377 20,825 28.617 Bengkulu 168,101 16,810 88 194 282 1.688 Lampung 727,600 72,760 4,396 6,725 11,121 15.289 Bangka Belitung Island 110,600 11,060 1,096 3,336 4,432 40.0710 Riau Island 187,501 18,750 135 223 358 1.9111 DKI Jakarta 794,400 79,440 4,800 10,454 15,254 19.2012 West Java 3,987,200 398,720 67,346 126,634 193,980 48.6513 Central Java 2,758,101 275,810 8,097 22,143 30,240 10.9614 DI Yogyakarta 347,920 34,792 476 1,234 1,710 4.9115 East Java 2,632,300 263,230 17,282 35,492 52,774 20.0516 Banten 992,002 99,200 4,063 7,344 11,407 11.5017 Bali 259,800 25,980 1,367 2,372 3,739 14.3918 West Nusa Tenggara 508,299 50,830 13,263 19,515 32,778 64.4919 East Nusa Tenggara 562,300 56,230 1,349 1,765 3,114 5.5420 West Kalimantan 472,899 47,290 995 2,260 3,255 6.8821 Central Kalimantan 211,599 21,160 309 769 1,078 5.0922 South Kalimantan 335,599 33,560 5,006 11,640 16,646 49.6023 East Kalimantan 315,598 31,560 1,059 2,530 3,589 11.3724 North Sulawesi 177,101 17,710 2,803 1,470 4,273 24.1325 Central Sulawesi 256,999 25,700 2,412 5,294 7,706 29.9826 South Sulawesi 810,201 81,020 2,212 4,896 7,108 8.7727 Southeast Sulawesi 256,002 25,600 288 821 1,109 4.3328 Gorontalo 95,001 9,500 304 574 878 9.2429 West Sulawesi 104,901 10,490 1,341 2,879 4,220 40.2330 Maluku 152,699 15,270 924 1,490 2,414 15.8131 North Maluku 110,101 11,010 382 798 1,180 10.7232 West Papua 85,599 8,560 0 0 0 0.0033 Papua 239,601 23,960 0 0 0 0.00<strong>Indonesia</strong>21,704,229 2,170,423 176,159 323,100 499,259 23.00Source: DG of Disease Control and Environmental <strong>Health</strong>, MoH RI
Annex 4.36NUMBER OF INPATIENT VISIT IN HOSPITALBY PROVINCE <strong>2010</strong>No ProvincesRecoveredDead discharge patientspatients
Annex 4.37INDICATOR OF GENERAL HOSPITAL CARE OF MoH AND LOCAL GOVERNMENTBY PROVINCE, 2008 - <strong>2010</strong>NoProvincesBed Occupancy Rate(BOR)Length of Stay (LOS) Bed Turn Over (BTO)Turn Over Interval(TOI)Gross Death Rate (GDR)Net Death Rate (NDR)2008 2009 2008 2009 2008 2009 2008 2009 2008 2009 <strong>2010</strong> 2008 2009 <strong>2010</strong>(1) (2) (3) (4) (5) (6) (7) (8) (9) (10) (11) (12) (13) (14) (14)1 Aceh 92.8 69.0 4 4,7 66 29.4 2 4.4 36 39.5 36.8 18 19.6 19.02 North Sumatera 64.5 47.9 6 4,8 26 11.9 5 18.0 54 52.0 36.1 30 28.5 17.13 West Sumatera 57.1 48.0 4 4,5 30 21.4 3 8.0 36 48.5 58.1 16 24.5 31.84 Riau 68.7 59.9 3 3,8 40 18.9 4 10.0 38 31.4 45.1 18 11.2 20.65 Jambi 77.4 67.9 3 3,4 58 43.4 2 2.6 35 25.3 30.5 11 8.6 10.56 South Sumatera 55.3 63.9 4 4,7 44 32.6 1 3.7 48 42.9 37.5 15 18.4 15.67 Bengkulu 45.0 58.8 3 3,9 50 26.9 2 5.6 3 37.2 36.9 12.7 15.58 Lampung 74.7 62.9 4 3,8 34 35.8 5 3.6 46 41.7 41.2 20 18.9 19.09 Bangka Belitung Island 91.0 82.6 3 3,1 26 17.1 1 12.6 42 35.9 27.9 15 13.6 11.010 Riau Island - 53.3 - 3,3 - 31.8 - 5.0 - 27.5 29.4 - 13.6 13.911 DKI Jakarta 69.7 53.7 5 4,4 34 28.1 3 4.9 44 29.5 31.2 26 18.0 20.012 West Java 85.7 63.9 4 4,2 41 28.8 2 5.0 39 29.2 28.2 18 15.8 15.713 Central Java 69.5 62.2 4 4,4 39 29.9 2 4.7 45 37.8 36.8 22 18.6 17.714 DI Yogyakarta 79.6 49.6 5 5,1 45 19.2 2 9.0 42 39.1 46.0 21 23.4 31.715 East Java 96.0 67.9 5 4,9 44 20.7 1 8.6 58 49.8 44.6 28 24.5 21.216 Banten 97.3 61.0 4 4,1 47 16.6 1 11.8 46 27.1 13.3 22 13.9 7.317 Bali 80.1 58.6 5 3,6 50 45.7 2 2.0 45 35.9 41.4 24 19.8 28.518 West Nusa Tenggara 50.3 66.3 4 3,6 32 32.4 1 4.6 40 43.0 37.1 19 18.8 20.419 East Nusa Tenggara 59.7 57.8 4 3,9 31 28.1 2 5.7 31 30.9 32.3 14 14.9 17.420 West Kalimantan 73.2 70.1 4 5,6 51 28.3 5 3.1 51 35.0 41.5 15 16.4 19.721 Central Kalimantan 47.0 52.1 4 3,5 20 14.8 4 14.8 26 28.0 38.6 11 12.4 15.822 South Kalimantan 76.8 69.3 4 3,7 38 21.7 2 8.3 44 41.5 42.2 18 15.7 16.423 East Kalimantan 99.5 75.9 4 4,2 51 25.8 2 5.0 26 21.3 26.9 13 9.6 15.524 North Sulawesi 83.0 52.4 6 3,6 37 21.8 5 7.7 30 30.6 21.4 13 12.6 9.025 Central Sulawesi 83.3 42.7 4 3,6 45 14.8 2 14.7 31 32.0 39.0 11 13.6 17.226 South Sulawesi 92.2 63.8 4 4,2 43 34.7 1 3.5 30 31.0 48.9 12 14.1 28.027 Southeast Sulawesi 71.5 61.6 5 3,9 39 22.4 8 7.2 32 40.6 44.4 16 18.7 16.328 Gorontalo - - - - - - - - - - - - - -29 West Sulawesi - 60.6 - 3,9 - 92.0 - 24.8 - 48.2 62.0 - 12.4 24.130 Maluku 36.0 34.5 4 4,7 22 11.0 8 19.8 40 33.2 48.2 29 12.9 27.931 North Maluku - - - - - - - - - - 28.2 - - 17.632 West Papua 74.0 67.9 6 3,4 27 11.0 1 21.0 17 19.7 29.2 9 10.4 19.533 Papua 51.0 59.1 5 4,1 16 66.0 6 36.9 48 36.2 32.7 35 18.8 17.0<strong>Indonesia</strong>79.8 58.7 4 4,3 42 25.0 3 6.3 42 36.5 38.8 19 18.3 19.9Source: DG of <strong>Health</strong> Effort, MoH RI
Annex 4.38EXAMINATION OF DENTAL AND ORAL HEALTH IN LOCAL GOVERNMENT AND MINISTRY OF HEALTH PUBLIC HOSPITAL SERVICESBY PROVINCE, <strong>2010</strong>NoProvincesPermanentToothFillingThird MolarToothFillingPulpaTreatment/NotpermanentFillingPermanentToothExtractingThird MolarToothExtractingPeriodontalTreatmentAbscessTreatmentCarriesCleansing(Scalling)CompleteDentureRemovableDentureFixedDentureOrthodontic(1) (2) (3) (4) (5) (6) (7) (8) (9) (10) (11) (12) (13) (14) (15)1 Aceh 3,249 920 7,323 5,648 2,205 2,812 1,413 3,729 10 - 37 - 442 North Sumatera 472 115 349 710 419 458 353 243 1 6 30 - -3 West Sumatera 3,438 748 4,103 2,581 771 2,317 890 2,068 - - - - 44 Riau 1,175 58 1,833 730 226 375 126 448 81 3 - 1 -5 Jambi 1,451 1,064 1,227 1,441 626 1,427 549 1,908 1 26 - - -6 South Sumatera 1,853 425 2,140 2,617 1,473 1,395 879 673 10 68 8 - 187 Bengkulu 1,310 215 257 967 209 65 233 80 1 14 - - 958 Lampung 1,736 119 1,614 2,553 730 1,261 615 580 17 275 11 1 49 Bangka Belitung Island 388 53 362 579 324 235 213 221 37 - - 59 -10 Riau Island 1,683 200 2,037 920 497 1,199 488 706 14 79 36 3 15811 DKI Jakarta 11,835 2,172 11,290 4,567 2,619 4,295 2,091 4,350 134 506 541 1 10312 West Java 17,282 2,453 23,303 8,219 4,391 3,453 4,381 6,180 389 492 884 52 413 Central Java 12,984 1,174 11,852 8,723 3,300 5,205 2,847 3,903 246 221 55 191 55114 DI Yogyakarta 1,616 504 4,440 3,007 923 2,116 529 1,358 81 425 208 10 21215 East Java 35,169 2,712 52,688 19,943 13,989 35,326 10,600 14,102 534 2,940 671 - 2316 Banten 1,382 164 792 241 181 109 75 304 15 9 62 430 11917 Bali 3,207 332 4,194 2,968 1,525 1,083 778 1,045 13 142 24 492 95418 West Nusa Tenggara 262 54 335 247 144 214 525 84 - 9 - 601 1,20419 East Nusa Tenggara 685 43 2,125 1,324 382 2,094 604 406 15 122 - 63 5120 West Kalimantan 3,794 133 2,393 3,847 767 735 918 731 2 40 16 27 30321 Central Kalimantan 832 133 1,942 915 547 971 336 461 1 11 1 85 24022 South Kalimantan 1,802 117 2,984 1,719 1,013 867 384 223 - - - 70 9523 East Kalimantan 1,266 257 1,883 1,223 852 411 321 477 35 6 - - -24 North Sulawesi 214 1 309 621 166 248 83 77 - 4 - 499 71125 Central Sulawesi 141 20 126 220 70 43 66 11 - - - 137 35826 South Sulawesi 7,196 216 4,216 3,412 1,639 1,276 1,269 1,427 33 121 - - 1,18327 Southeast Sulawesi 2,171 273 5,411 1,743 862 1,088 464 307 - 48 - 103 33128 Gorontalo - - - - - - - - - - - - -29 West Sulawesi 50 0 40 70 20 67 2 - - - - - 1,18630 Maluku 498 9 642 776 176 258 76 45 3 - - 3,492 2,01031 North Maluku 991 74 683 660 126 608 48 7 - - - 904 3,06932 West Papua 302 70 308 240 92 136 131 32 - - - 1,536 2,70933 Papua 29 4 155 4 4 76 50 30 - - - 689 3,363<strong>Indonesia</strong>120,463 14,832 153,356 83,435 41,268 72,223 32,337 46,216 1,673 5,567 2,584 9,446 19,102Source: DG of <strong>Health</strong> Effort, MoH RIOralSurgery
Annex 4.39JAMKESMAS (COMMUNITY HEALTH INSURANCE) PARTICIPANT VISITS IN HEALTH CENTER<strong>2010</strong>No Provinces RJTP RITP Referrals4 th Pregnant WomenVisits (K4 )2nd Neonates Visits(KN2 )Delivering by<strong>Health</strong> Personnel(1) (2) (3) (4) (5) (6) (7) (8)1 Aceh 2,532,687 41,269 155,463 52,584 43,252 40,9202 North Sumatera 393,151 1,592 12,314 8,706 6,683 6,0393 West Sumatera 226,185 321 20,286 3,560 2,230 1,4124 Riau 524,666 4,335 16,218 15,697 10,641 8,9465 Jambi 97,822 1,199 3,451 3,078 2,098 1,8376 South Sumatera 100,825 1,541 4,356 4,466 3,657 2,9167 Bengkulu 185,674 8,403 3,806 7,648 4,882 4,6048 Lampung 995,398 40,738 56,880 23,242 16,253 13,9819 Bangka Belitung Island 13,982 505 1,178 138 44 4910 Riau Island 143,486 2,673 13,055 2,808 1,296 1,14711 DKI Jakarta12 West Java 7,005,403 63,777 367,661 118,929 90,478 72,08913 Central Java 6,082,862 180,914 448,110 84,221 62,983 57,32014 DI Yogyakarta 561,896 7,908 40,788 6,923 4,332 4,58715 East Java 5,037,208 128,939 297,363 78,946 65,712 53,52916 Banten 1,432,517 202,725 68,614 20,207 20,873 18,40717 Bali 424,555 1,676 18,175 3,797 2,832 2,74018 West Nusa Tenggara 953,850 51,977 20,750 49,952 39,774 33,72319 East Nusa Tenggara 1,883,324 13,554 20,703 22,261 23,798 21,34220 West Kalimantan 416,790 4,356 22,018 11,560 6,352 4,93821 Central Kalimantan 209,375 29,527 5,217 5,445 3,791 3,32222 South Kalimantan 524,467 15,558 28,739 10,879 7,425 5,89523 East Kalimantan 506,636 23,859 28,065 8,034 4,713 3,51224 North Sulawesi 86,164 5,199 5,410 1,417 299 30925 Central Sulawesi 46,874 297 592 1,491 1,435 94926 South Sulawesi 327,897 3,273 13,454 9,829 6,262 5,83027 Southeast Sulawesi 17,666 3 752 509 315 31728 Gorontalo 337,584 3,057 16,263 7,240 5,814 5,56929 West Sulawesi 254,910 25,882 4,017 2,499 3,543 3,28730 Maluku 56,172 5,936 76 4,819 1,635 1,27731 North Maluku 85,859 24,813 1,725 1,186 1,265 96132 West Papua 24,660 14,159 110 278 268 35233 Papua 343 1 1 1 2 2<strong>Indonesia</strong>31,490,888 909,966 1,695,610 572,350 444,937 382,108Source: Center of Managed Care MoH RINotes: RJTP = First Level InpatientRITP = First Level InpatientDKI Jakarta use Provincial Budget for Community <strong>Health</strong> Insurance
Annex 4.43PERCENTAGE OF DRUG AND VACCINE AVAILABILITY IN INDONESIAJUNE 2011No Name of Drug PackingRequirement AvailabilityRequirement Availability% Availability No Name of Drug Packing2011 on May 1, 20112011 on May 1, 2011% Availability1 2 3 4 5 6 1 2 3 4 5 61 Allopurinol tablet 100 mg 100 tabletss/strip/blister, box 8,551,907 1,584,976 32 37 Ethacridine solution 0,1% Bottle 300 ml 2,216,258 308,483 182 Aminophylin tablet 200 mg 100 tablets / bottle 6,785,351 1,837,410 27 38 Phenytoin Sodium Injection 50 mg/ml ampoules @ 2 ml 1,257,334 353,723 393 Aminophylin injection 24 mg/ml 30 ampoules / box 270,250 61,535 25 39 Phenobarbital Injection I.m/I.v 50 mg/ml 30 ampoules / box 890,196 195,113 484 Amitriptilin coated tablet 25 mg (HCL) 100 tablets/strip/blister, box 1,160,835 261,903 27 40 Phenobarbital tablet 30 mg 1000 tablets / bottle 6,766,624 2,458,623 525 Amoxicillin capsule 250 mg 120 capsule/strip/blister, box 28,591,389 6,000,475 20 41 Phenoxymethylpenicillin (penicillin V) tablet 250 mg 100 tablets / box 623,494 104,341 286 Amoxicillin caplet 500 mg 100 caplet/strip, box 134,802,623 24,282,556 19 42 Phenoxymethylpenicillin (penicillin V) tablet 500 mg 100 tablets / box 606,940 170,134 197 Amoxicillin dry syrup 125 mg/ 5 mg Bottle 60 ml 53,920,312 6,864,679 16 43 Phenol Glycerol ear drops 10% 24 btl @ 5 ml / box 653,147 129,452 368 Metampyron tablet 500 mg 1,000 tablets / bottle 47,147,417 10,246,867 19 44 Phytomenadion (Vit. K1) injection 10 mg/ml 30 ampoules / box 846,200 163,014 349 Metampyron injection 250 mg 30 ampoules / box 2,734,559 616,561 20 45 Phytomenadion (Vit. K1)sugar coated tablet 10 mg 100 tablets / bottle 3,281,298 938,140 2410 Antacids DOEN I chewable tablet, btl 1,000 tablets 55,806,774 16,961,945 23 46 Furosemid tablet 40 mg box 20 x 10 tablets 3,145,964 1,011,150 2911 Anti Bacterial DOEN ointment combination: 25 tube @ 5 g / box 2,055,339 476,868 19 47 Gameksan lotion 1 % Bottle 30 ml 891,672 147,018 1412 Antihemoroid DOEN combination : Bismuth 10 supp / box 885,077 124,402 22 48 Rehydration Salts I powder combination : Sodium 100 kantong/kotak tahan 8,739,343 2,118,613 2113 Antifungi DOEN Combination : Benzoic Acid 6% + 24 pot @ 30 g / box 2,744,440 276,475 28 49 Gentian Violet Larutan 1 % Bottle 10 ml 4,344,808 665,011 3314 Antimigrain : Ergotamin tartrat 1 mg + Coffein 50 100 tablets / bottle 1,289,585 278,391 21 50 Glibenclamide tablet 5 mg 100 tablets / box 8,336,364 1,729,727 2715 Antiparkinson DOEN tablet combination : Carbidopa box 10 x 10 tablets 538,462 127,795 51 51 Glyseryl Guaiakolat tablet 100 mg 1,000 tablets / bottle 56,616,996 17,576,071 2416 Aqua Pro Injection Sterile, pyrogen free 10 vial @20 ml / box 1,138,976 243,416 24 52 Glyserin btl 100 ml 162,582 37,503 3017 Ascorbic Acid (vitamin C) tablet 50 mg 1,000 tablets / bottle 40,693,688 12,448,100 28 53 Glucose infusion solutions 5% btl 500 ml 7,187,881 1,638,316 2318 Acetilsalicylac Acid tablet 100 mg (Acetosal) box 10 x 10 tablets 505,007 127,374 19 54 Glucose infusion solutions 10% btl 500 ml 1,505,774 361,058 2819 Acetilsalicylac Acid tablet 500 mg (Acetosal) box 10 x 10 tablets 1,984,709 464,770 20 55 Glucose infusion solutions 40% steril (produk lokal) 10 amp @ 25 ml, box 267,963 62,828 5320 Athropin sulfat tablet 0,5 mg 500 tablets / bottle 1,649,999 404,876 30 56 Griseofulvin tablet 125 mg, micronized box 10 x 10 tablets 9,273,467 1,090,355 1521 Atropine eye drops 0,5% 24 btl @ 5 ml / box 271,608 71,612 27 57 Haloperidol tablet 0,5 mg box 10 x 10 tablets 411,875 95,498 4622 Atropine injection l.m/lv/s.k. 0,25 mg/mL - 1 mL 30 ampoules / box 3,135,847 770,372 39 58 Haloperidol tablet 1,5 mg box 10 x 10 tablets 881,990 221,068 3523 Betamethasone cream 0,1 % 25 tube @ 5 g / box 1,467,643 293,502 25 59 Haloperidol tablet 5 mg box 10 x 10 tablets 331,976 118,975 4224 Dexamethasone injection I.v. 5 mg/ml 100 ampoules / box 1,657,432 389,870 34 60 Hydrochlorothiazide tablet 25 mg 1,000 tablets / bottle 10,906,392 2,520,724 3825 Dexamethasone tablet 0,5 mg 1,000 tablets / bottle 92,741,669 19,829,814 26 61 Hydrocortison cream 2,5% 24 tube @ 5 g / box 3,666,430 650,910 1926 Dextran 70-sterile infusion solution 6% Bottle 500 ml 385,421 85,480 41 62 Ibuprofen tablet 200 mg 100 tablets / bottle 11,899,307 1,936,670 2427 Dextrometorphan syrup 10 mg/5 ml (HBr) Bottle 60 ml 23,717,274 3,463,916 19 63 Ibuprofen tablet 400 mg box 10 x 10 tablets 24,954,922 1,970,784 2928 Dextrometorphan tablet 15 mg (HBr) 1,000 tablets / bottle 36,455,819 10,461,632 35 64 Isosorbid Dinitrat sublingual tablet 5 mg box 10 x 10 tablets 2,774,797 524,656 2629 Diazepam Injection 5mg/ml 30 ampoules / box 301,653 54,730 41 65 Calcium Lactate (Kalk) tablet 500 mg 1000 tablets / bottle 48,978,656 10,744,929 2130 Diazepam tablet 2 mg 1,000 tablets / bottle 25,271,795 3,748,851 29 66 Captopril tablet 12,5 mg box 10 x 10 tablets 8,360,181 1,819,635 2531 Diazepam tablet 5 mg 250 tablets / bottle 1,544,883 277,725 36 67 Captopril tablet 25 mg box 10 x 10 tablets 24,777,046 3,699,382 2232 Diphenhydramine injection I.M. 10 mg/ml (HCL) 30 ampoules / box 2,374,355 490,618 22 68 Carbamazepim tablet 200 mg box 10 x 10 tablets 1,081,286 222,467 2133 Digoxin tablet 0,25 mg 100 tablets / box 2,493,712 531,456 23 69 Ketamin Injection 10 mg/ml 10 vial @ 20 ml, box 202,461 44,414 5334 Ephedrin tablet 25 mg (HCL) 1,000 tablets / bottle 14,113,236 3,495,316 32 70 Klofazimin capsule 100 mg microzine 100 capsule / bottle 1,461,402 202,700 2535 Atropa belladona extract tablet 10 mg 1,000 tablets / bottle 7,298,904 1,343,455 17 71 Chloramphenicol capsule 250 mg 250 capsule / bottle 27,637,611 3,728,042 2536 Epinephrine (Adrenaline) injection 0,1% (as HCL) 30 ampoules /box 661,976 141,995 31 72 Chloramphenicol ear drops 3 % 24 bottle @ 5 ml / box 2,597,998 244,210 17Source: DG of Phamaceutical and Medical Device, MoH RI
Annex 4.40NoProvincesAdvance Level Outpatient CareMales Females Males + Females(1) (2) (3) (4) (5)1 Aceh 142,230 191,923 334,1532 North Sumatera 124,538 135,565 260,1033 West Sumatera 71,095 89,686 160,7814 Riau 19,334 26,151 45,4855 Jambi 13,451 16,043 29,4946 South Sumatera 66,849 78,665 145,5147 Bengkulu 12,912 14,519 27,4318 Lampung 42,554 47,536 90,0909 Bangka Belitung Island 3,766 4,560 8,32610 Riau Island 9,353 11,018 20,37111 DKI Jakarta 38,135 46,326 84,46112 West Java 306,987 391,337 698,32413 Central Java 411,547 525,926 937,47314 DI Yogyakarta 64,325 81,400 145,72515 East Java 278,660 365,694 644,35416 Banten 54,557 59,939 114,49617 Bali 47,663 35,123 82,78618 West Nusa Tenggara 43,395 44,288 87,68319 East Nusa Tenggara 45,662 50,518 96,18020 West Kalimantan 41,365 45,155 86,52021 Central Kalimantan 10,162 10,994 21,15622 South Kalimantan 21,187 21,281 42,46823 East Kalimantan 41,569 30,230 71,79924 North Sulawesi 15,644 19,079 34,72325 Central Sulawesi 13,079 15,869 28,94826 South Sulawesi 96,816 111,018 207,83427 Southeast Sulawesi 21,376 26,669 48,04528 Gorontalo 7,195 10,577 17,77229 West Sulawesi 5,777 7,676 13,45330 Maluku 8,379 9,120 17,49931 North Maluku 3,153 3,231 6,38432 West Papua 19,820 23,975 43,79533 Papua 41,587 48,378 89,965Total2,144,122 2,599,469 4,743,591Source: Center of Managed Care MoH RINUMBER OF ADVANCE LEVEL OUTPATIENT (RJTL) VISITOF JAMKESMAS PARTICIPANTS, <strong>2010</strong>
Annex 4.41NUMBER OF ADVANCE LEVEL INPATIENT (RITL) CASEOF JAMKESMAS PARTICIPANTS, <strong>2010</strong>NoProvincesAdvance Inpatient CareMales Females Males + Females(1) (2) (3) (4) (5)1 Aceh 26,857 37,061 63,9182 North Sumatera 30,493 38,715 69,2083 West Sumatera 12,626 18,703 31,3294 Riau 4,544 6,932 11,4765 Jambi 4,201 5,777 9,9786 South Sumatera 8,944 12,538 21,4827 Bengkulu 5,334 5,897 11,2318 Lampung 16,540 20,495 37,0359 Bangka Belitung Island 814 1,080 1,89410 Riau Island 1,361 2,334 3,69511 DKI Jakarta 2,450 3,133 5,58312 West Java 54,279 81,464 135,74313 Central Java 108,057 144,305 252,36214 DI Yogyakarta 12,001 16,362 28,36315 East Java 61,585 93,538 155,12316 Banten 13,116 14,468 27,58417 Bali 9,866 10,541 20,40718 West Nusa Tenggara 14,023 20,148 34,17119 East Nusa Tenggara 22,392 34,192 56,58420 West Kalimantan 16,704 16,687 33,39121 Central Kalimantan 3,533 3,744 7,27722 South Kalimantan 5,595 6,893 12,48823 East Kalimantan 10,824 9,029 19,85324 North Sulawesi 4,304 5,555 9,85925 Central Sulawesi 5,497 7,832 13,32926 South Sulawesi 23,478 28,600 52,07827 Southeast Sulawesi 6,201 10,137 16,33828 Gorontalo 4,210 6,061 10,27129 West Sulawesi 1,487 2,305 3,79230 Maluku 3,554 5,048 8,60231 North Maluku 1,498 1,732 3,23032 West Papua 3,709 6,567 10,27633 Papua 4,056 7,879 11,935Total504,133 685,752 1,189,885Source: Center of Managed Care MoH RI
Annex 4.42NoType of DisasterRECAPITULATION OF DISASTER BY TYPE AND NUMBER OF VICTIMS<strong>2010</strong>Number ofProvincesDeathsNumber of VictimsSerious Injured/ Light Injured/Inpatients OutpatientsMissings(1) (2) (3) (4) (5) (6) (7) (8)1 Flood 27 33 59 26,565 12 90,6042 Flash Flood 13 215 181 5,567 151 16,2143 Flood and Landslide 6 19 12 594 3 10,0964 Landslide 16 131 69 131 39 6,3165 Tidal Wave 1 - 1 - - -6 Tropical cyclon (high wind and whirlwind 14 10 38 187 2 1047 Earthquake 7 7 49 269 12 5,0968 Mountain explosion 4 382 2,787 63,286 4 428,1599 Industrial accident 1 8 13 4 0 010 Technology Failure 9 5 25 4 3 0(including gas stove explosion11 Explosion (bomb, gas cylinder, etc 1 - 1 - 0 012 Conflict 16 33 331 184 0 44,34413 Fire 6 29 27 215 0 2,85014 Poisoned/Botulism 5 4 317 319 0 0InternallyDisplaced15 Earthquake & Tsunam 1 509 175 910 21 15,097Total1,385 4,085 98,235 247 618,880Source: Center for Crisis Response, MoH RI, <strong>2010</strong>
Annex 4.44PERCENTAGE OF DRUG AND VACCINE AVAILABILITY IN INDONESIAJUNE 2011Requirement AvailabilityRequirement AvailabilityNo Name of Drug Packing% Availability No Name of Drug Packing% Availability2011 on May 1, 20112011 on May 1, 20111 2 3 4 5 6 1 2 3 4 5 673 Chlorpheniramine maleat (CTM) tablet 4 mg 1,000 tablets / bottle 118,244,020 32,593,219 27 109 Povidone Iodine solution 10 % Bottle 30 ml 3,109,389 391,127 1774 Chlorpromazine injection i.m 5 mg/ml-2ml (HCL) 30 ampoules / box 405,042 86,694 65 110 Povidone Iodine solution 10 % Bottle 300 ml 1,935,411 282,816 2075 Chlorpromazine injection i.m 25 mg/ml (HCL) 30 ampoules / box 163,702 47,775 43 111 Prednisone tablet 5 mg 1,000 tablets / bottle 63,117,211 10,029,513 2576 Chlorpromazine coated tablet 25 mg (HCL) 1,000 tablets / bottle 702,320 189,932 33 112 Primaquine tablet 15 mg 1,000 tablets / bottle 1,897,705 595,454 5177 Chlorpromazine HCl coated tablet 100 mg (HCL) 1,000 tablets / bottle 1,855,256 401,878 28 113 Propiltiouracil tablet 100 mg 100 tablets / bottle 1,311,239 309,369 3178Anti Malaria DOEN combination Pirimetamin 25 mg +Sulfadoxin 500 mg100 tablets / box 1,736,825 324,088 23 114 Propanol tablet 40 mg (HCL) 100 tablets / bottle 2,745,337 738,014 2379Cotrimoxazol Suspension combination:Sulfametoxazol 200 mg + Trimetoprim 40 mg/ 5 mlbottle 60 ml 38,762,772 4,309,447 18 115 Reserpine tablet 0,10 mg 250 tablets / bottle 2,764,159 648,583 5780Cotrimoxazol DOEN I (adult) combination :Sulfametoxazol 400 mg, Trimetoprim 80 mgbox 10 x 10 tablets 37,124,662 7,546,260 17 116 Reserpine tablet 0,25 mg 1,000 tablets /bottle 5,446,174 1,665,516 4481Cotrimoxazol DOEN II (pediatric) combination :Sulfametoxazol 100 mg, Trimetoprim 20 mgbox 10 x 10 tablets 4,466,612 1,764,582 28 117 Ringer Lactate solution btl 500 ml 18,579,917 4,214,549 2182 Quinin tablet 200 mg box 60 tablets 976,507 280,228 27 118Salep 2-4, combination: Salicylic acid 2% +Sulphur precipitate 4%24 pot @ 30 g / box 2,026,650 427,644 2283 Quinin Dihydrochlorida injection 25%-2 ml 30 ampoules / box 193,037 39,731 40 119 Salicyl powder 2% 50 gram / box 12,416,968 1,863,237 1884Lidocain injection 2% (HCL) + Epinephrin 1 : 80.000-2Serum Anti Bisa Ular Polivalen injection 5 ml (ABU30 vial / box 2,734,233 391,139 24 120mlI)10 vial / box 750,723 168,102 2485 Magnesium Sulfat injection (IV) 20%-25 ml 10 vial / box 123,241 42,793 57 121Serum Anti Bisa Ular Polivalen injection 50 ml(ABU II)1 vial / box 26,989,177 9,751,206 7786 Magnesium Sulfat injection (IV) 40%-25 ml 10 vial / box 94,076 31,952 40 122Anti Diphteri Serum injection 20.000 IU/vial(A.D.S.)10 vial / box 2,542,110 541,783 1587 Magnesium Sulfat powder 30 gram 10 sachets @ 30 gr / box 113,839 25,512 24 123Anti Tetanus Serum injection 1.500 IU/ampul(A.T.S.)10 ampoules / box 768,798 123,754 1688 Mebendazol syrup 100 mg / 5 ml Bottle 30 ml 384,662 60,356 25 124Anti Tetanus Serum injection 20.000 IU/vial(A.T.S.)10 vial / box 1,175,676 326,911 2389 Mebendazol tablet 100 mg box 5 x 6 tablets 664,460 132,413 45 125 Cyanocobalamin (Vitamin B12) injection 500 mcg 100 ampoules / box 3,048,868 372,771 2290Metilergometrin Maleat (Metilergometrin) coated tablet0,125 mgbox 10 x 10 tablets 6,276,528 642,144 17 126 Sodium Sulfacetamide eye drops 15 % box 24 btl @ 5 ml 1,421,062 162,232 2091 Metilergometrin Maleat injeksi 0,200 mg -1 ml 30 ampoules / box 915,477 133,153 21 127 Tetracaine HCL eye drops 0,5% box 24 btl @ 5 ml 1,326,662 382,021 2292 Metronidazol tablet 250 mg 100 tablets / box 14,637,739 1,757,800 22 128 Tetracycline capsule 250 mg 1,000 capsule / bottle 23,069,009 3,998,051 2693 Sodium Bicarbonat tablet 500 mg 1,000 tablets / bottle 11,830,517 3,092,641 25 129 Tetracycline capsule 500 mg box 10 x 10 capsule 4,586,525 1,116,482 1694 Sodium Fluorescein eye drops 2 % 24 bottle @ 5 ml / box 955,865 217,853 38 130 Thiamine (vitamin B1) injection 100 mg/ml box 30 amp @ 1 ml 1,591,633 349,963 2695 Sodium Chlorida infusion 0,9 % Bottle / plastic 500 ml 3,180,697 397,650 17 131 Thiamine (vitamin B1) tablet 50 mg (HCL/Nitrat) 1,000 tablets / bottle 64,201,517 13,762,907 2796 Sodium Thiosulfat injection I.v. 25 % box 10 amp @ 10 ml 812,652 205,658 30 132 Tiopental Sodium powder injection 1,000 mg/amp ampoules @ 10 ml 65,554 21,934 3897 Nistatin coated tablet 500.000 IU/g box 10 x 10 coated tablets 521,661 128,033 31 133 Trihexyphenidil tablet 2 mg box 10 x 10 tablets 1,491,918 321,118 5098 Nistatin Vaginal coated tablet 100.000 IU/g box 10 x 10 vaginal tablets 886,078 195,732 29 134 Vaccine Rabies Vero 1 kuur / set 372,106 102,322 1699 Obat Batuk Hitam ( O.B.H.) Bottle 100 ml 28,227,179 4,208,101 18 135 Vitamin B Complex tablet 1,000 tablets / bottle 85,292,284 20,717,522 25100 Oxytetracycline HCL eye ointment 1 % 25 tube @ 3,5 g / box 2,346,931 498,100 19 VACCINE101 Oxytetracycline injection I.m. 50 mg/ml-10 ml 10 vial / box 491,460 69,872 18 136 BCG 2,099,247 680,411 19102 Oxytocin injection 10 UI/ml-1 ml 30 ampoules / box 2,591,294 482,981 19 137 T T 4,524,864 758,556 17103 Paracetamol syrup 120 mg / 5 ml Bottle 60 ml 47,219,120 6,475,166 17 138 D T 1,044,349 125,989 <strong>2010</strong>4 Paracetamol tablet 100 mg 100 tablets / bottle 3,467,807 1,469,499 35 139 CAMPAK 10 Doses 2,453,182 704,796 22105 Paracetamol tablet 500 mg 1,000 tablets / bottle 122,881,960 32,705,240 27 140 POLIO 10 Doses 4,122,780 1,008,969 18106 Pilokarpin eye drops 2 % (HCL/Nitrat) bottle @ 5 ml 914,892 262,425 22 141 DTP-HB 4,136,106 866,415 17107 Pyrantel tablet Score (base) 125 mg box 30 x 2 score 3,743,392 867,727 30 142 HEPATITIS B 0,5 ml ADS 4,545,648 1,192,320 19108 Pyridoxine (Vitamin B6) tablet 10 mg (HCL) 1,000 tablets / bottle 60,545,338 12,126,863 24 143 POLIO 20 Doses 548,251 16,135 10144 CAMPAK 20 Doses 321,972 8,152 16Source: DG of Phamaceutical and Medical Device, MoH RI
Annex 5.1NUMBER OF HEALTH CENTER AND ITS RATIO TO POPULATIONBY PROVINCE, 2006 - <strong>2010</strong>NoProvincesNumber of <strong>Health</strong> CenterRatio of <strong>Health</strong> Centerper 100,000 Population2006 2007 2008 2009 <strong>2010</strong> 2006 2007 2008 2009 <strong>2010</strong>(1) (2) (3) (4) (5) (6) (7) (8) (9) (10) (11) (12)1 Aceh 274 311 301 309 315 6.73 7.36 7.01 7.08 7.012 North Sumatera 445 463 495 500 506 3.52 3.61 3.80 3.77 3.903 West Sumatera 224 228 227 242 246 4.84 4.85 4.77 5.01 5.084 Riau 154 156 183 176 193 2.52 3.08 3.53 3.32 3.485 Jambi 140 148 158 163 169 5.22 5.40 5.67 5.75 5.476 South Sumatera 249 259 278 284 293 3.61 3.69 3.90 3.93 3.937 Bengkulu 126 140 142 167 170 8.04 8.66 8.65 10.02 9.918 Lampung 235 248 253 264 265 3.26 3.40 3.42 3.52 3.489 Bangka Belitung Island 47 51 50 55 58 4.37 4.61 4.45 4.83 4.7410 Riau Island 45 51 59 61 66 3.36 3.66 4.06 4.03 3.9311 DKI Jakarta 342 341 351 339 341 3.82 3.76 3.84 3.68 3.5512 West Java 999 1,002 999 1,008 1,028 2.52 2.48 2.44 2.43 2.3913 Central Java 858 871 842 849 867 2.67 2.69 2.58 2.58 2.6814 DI Yogyakarta 117 117 120 119 121 3.45 3.41 3.46 3.40 3.5015 East Java 930 929 940 944 946 2.54 2.52 2.53 2.53 2.5216 Banten 177 180 194 196 217 1.92 1.91 2.02 2.00 2.0417 Bali 110 112 114 114 114 3.21 3.22 3.24 3.21 2.9318 West Nusa Tenggara 130 134 142 145 150 3.05 3.12 3.25 3.27 3.3319 East Nusa Tenggara 251 253 278 288 309 5.76 5.69 6.13 6.23 6.6020 West Kalimantan 205 211 224 229 231 4.98 5.05 5.27 5.30 5.2521 Central Kalimantan 154 163 169 169 174 7.95 8.04 8.21 8.10 7.8722 South Kalimantan 201 204 214 213 214 6.01 6.01 6.21 6.09 5.9023 East Kalimantan 186 192 205 207 217 6.34 6.35 6.62 6.54 6.1124 North Sulawesi 130 142 144 159 170 6.02 6.49 6.52 7.13 7.4925 Central Sulawesi 144 145 144 165 160 6.13 6.05 5.91 6.65 6.0726 South Sulawesi 362 374 395 395 416 4.20 4.86 5.06 4.99 5.1827 Southeast Sulawesi 159 153 208 223 233 7.94 7.53 10.02 10.53 10.4428 Gorontalo 55 55 73 75 76 5.84 5.73 7.51 7.62 7.3129 West Sulawesi 62 66 70 77 81 6.25 6.49 6.78 7.35 6.9930 Maluku 125 142 153 135 156 9.83 10.91 11.58 10.08 10.1731 North Maluku 62 64 91 96 100 6.75 6.78 9.48 9.85 9.6332 West Papua 81 83 96 105 106 11.77 11.59 13.15 14.12 13.9433 Papua 236 246 236 266 297 8.87 2.05 11.48 12.68 10.48<strong>Indonesia</strong>8,015 8,234 8,548 8,737 9,005 3.50 3.61 3.65 3.74 3.79Source: Center for Data and Information, MoHRI
Annex 5.2NoProvincesNumber of <strong>Health</strong> Center with Bed<strong>Health</strong> CenterNumber of <strong>Health</strong> Center without Bed2006 2007 2008 2009 <strong>2010</strong> PONED <strong>2010</strong> 2006 2007 2008 2009 <strong>2010</strong>(1) (2) (3) (4) (5) (6) (7) (8) (9) (10) (11) (12) (13) (14)1 Aceh 85 125 66 115 116 51 189 186 235 194 199 8812 North Sumatera 145 122 144 129 140 62 300 341 351 371 366 1,8013 West Sumatera 81 84 68 81 85 73 143 144 159 161 161 8574 Riau 46 49 45 51 53 32 108 107 138 125 140 7235 Jambi 41 59 51 56 59 43 99 89 107 107 110 5476 South Sumatera 76 86 77 80 82 49 173 173 201 204 211 9837 Bengkulu 34 35 35 37 39 23 92 105 107 130 131 4668 Lampung 39 80 37 51 58 56 196 168 216 213 207 7669 Bangka Belitung Island 17 19 14 20 18 10 30 32 36 35 40 15510 Riau Island 16 17 24 24 26 18 29 34 35 37 40 20411 DKI Jakarta 50 50 54 51 52 17 292 291 297 288 289 212 West Java 142 150 140 171 237 143 857 852 859 837 791 1,60013 Central Java 241 269 232 234 252 145 617 602 610 615 615 1,75914 DI Yogyakarta 38 38 41 41 42 27 79 79 79 78 79 32115 East Java 336 365 392 365 396 217 594 564 548 579 550 2,25216 Banten 34 34 42 46 50 44 143 146 152 150 167 26717 Bali 22 23 24 27 28 29 88 89 90 87 86 52318 West Nusa Tenggara 44 58 86 80 81 39 86 76 56 65 69 49419 East Nusa Tenggara 124 111 69 93 110 65 127 142 209 195 199 89320 West Kalimantan 71 71 82 94 93 18 134 140 142 135 138 80621 Central Kalimantan 52 54 47 55 69 26 102 109 122 114 105 83422 South Kalimantan 36 40 42 46 48 54 165 164 172 167 166 59323 East Kalimantan 87 82 96 100 93 43 99 110 109 107 124 63324 North Sulawesi 59 65 66 72 84 45 71 77 78 87 86 45725 Central Sulawesi 64 64 67 63 68 54 80 81 77 102 92 65026 South Sulawesi 179 189 168 205 208 64 183 185 227 190 208 1,30027 Southeast Sulawesi 52 48 63 69 70 30 107 105 145 154 163 46228 Gorontalo 17 18 17 22 23 19 38 37 56 53 53 25029 West Sulawesi 22 24 22 31 35 33 40 42 48 46 46 20930 Maluku 54 59 29 48 56 26 71 83 124 87 100 31131 North Maluku 31 30 27 27 27 18 31 34 64 69 73 22632 West Papua 41 33 26 36 36 0 40 50 70 69 70 27133 Papua 121 132 45 84 86 6 115 114 191 182 211 553<strong>Indonesia</strong>2,497 2,683 2,438 2,704 2,920 1,579 5,518 5,551 6,110 6,033 6,085 23,049Source: Center for Data and Information, MoHRIDG <strong>Health</strong> Effort, MoH (column 8 and 14)NUMBER OF HEALTH CENTER WITH BED AND HEALTH CENTER WITHOUT BEDBY PROVINCE, 2006 - <strong>2010</strong>Sub <strong>Health</strong> Center
Annex 5.3NoProvincesMoH/GovernmentNUMBER OF HOSPITAL IN INDONESIABY MANAGEMENT AND PROVINCE, <strong>2010</strong>Army/PoliceOther Ministry/State-OwnedEnterprisesGeneral SpecificGeneral SpecificGeneral SpecificGeneral SpecificGeneral SpecificTotalTotalTotal TotalHospital HospitalHospital HospitalHospital HospitalHospital HospitalHospital HospitalTotal(1) (2) (3) (4) (5) (6) (7) (8) (9) (10) (11) (12) (13) (14) (15) (16) (17)1 Aceh 21 3 24 4 0 4 3 0 3 10 2 12 38 5 432 North Sumatera 31 5 36 8 0 8 17 1 18 78 8 86 134 14 1483 West Sumatera 18 2 20 3 0 3 1 0 1 9 10 19 31 12 434 Riau 14 1 15 4 0 4 4 0 4 13 4 17 35 5 405 Jambi 12 1 13 2 0 2 2 0 2 4 1 5 20 2 226 South Sumatera 18 4 22 2 0 2 5 0 5 7 2 9 32 6 387 Bengkulu 11 1 12 2 0 2 0 0 0 1 0 1 14 1 158 Lampung 11 1 12 2 0 2 0 0 0 16 3 19 29 4 339 Bangka Belitung Island 7 1 8 0 0 0 0 0 0 2 0 2 9 1 1010 Riau Island 8 0 8 2 0 2 2 0 2 7 2 9 19 2 2111 DKI Jakarta 9 7 16 8 1 9 5 1 6 57 42 99 79 51 13012 West Java 34 8 42 13 0 13 6 1 7 89 40 129 142 49 19113 Central Java 47 8 55 11 0 11 3 0 3 92 48 140 153 56 20914 DI Yogyakarta 6 1 7 2 0 2 0 1 1 22 17 39 30 19 4915 East Java 50 8 58 20 1 21 14 2 16 65 24 89 149 35 18416 Banten 6 1 7 2 0 2 1 0 1 16 11 27 25 12 3717 Bali 10 2 12 2 0 2 0 0 0 20 7 27 32 9 4118 West Nusa Tenggara 8 3 11 2 0 2 0 0 0 4 0 4 14 3 1719 East Nusa Tenggara 17 0 17 2 0 2 0 0 0 10 1 11 29 1 3020 West Kalimantan 13 3 16 4 0 4 1 0 1 7 3 10 25 6 3121 Central Kalimantan 14 0 14 1 0 1 0 0 0 0 0 0 15 0 1522 South Kalimantan 14 1 15 4 0 4 2 0 2 4 4 8 24 5 2923 East Kalimantan 16 3 19 4 0 4 2 0 2 9 1 10 31 4 3524 North Sulawesi 12 1 13 3 0 3 0 0 0 15 0 15 30 1 3125 Central Sulawesi 12 1 13 2 0 2 0 0 0 4 4 8 18 5 2326 South Sulawesi 26 8 34 6 0 6 1 1 2 12 9 21 45 18 6327 Southeast Sulawesi 12 1 13 2 0 2 1 0 1 4 1 5 19 2 2128 Gorontalo 6 1 7 0 0 0 0 0 0 1 0 1 7 1 829 West Sulawesi 4 0 4 0 0 0 0 0 0 1 0 1 5 0 530 Maluku 11 1 12 4 0 4 0 0 0 6 1 7 21 2 2331 North Maluku 10 0 10 2 0 2 0 0 0 1 0 1 13 0 1332 West Papua 5 0 5 2 0 2 1 0 1 2 0 2 10 0 1033 Papua 13 2 15 4 0 4 0 0 0 5 0 5 22 2 24<strong>Indonesia</strong>506 79 585 129 2 131 71 7 78 593 245 838 1,299 333 1,632Source: DG <strong>Health</strong> Effort, MoHPrivateTotal Hospital
Annex 5.4NUMBER OF HOSPITAL AND BEDBY MANAGEMENT 2006 - <strong>2010</strong>20062007 2008 2009 <strong>2010</strong>No ManagementTotal Number of Bed Total Number of Bed Total Number of Bed Total Number of Bed Total Number of Bed(1) (2) (3) (4) (5) (6) (7) (8) (9) (10) (11) (12)1 Ministry of <strong>Health</strong> 13 8,784 13 8,777 13 9,044 13 9,131 13 8,8732 Provincial Government 43 12,834 43 13,182 43 13,605 44 14,029 48 13,9553District/MunicipalitiesGovernment334 35,375 345 37,575 375 41,285 416 47,811 445 49,4364 Army/Police 110 10,842 110 10,836 110 10,907 123 11,821 129 11,7715 Other Ministries/State-Owned 71 6,880 71 6,851 71 6,643 71 6,747 71 6,9256 Private 441 43,789 451 45,074 467 47,266 535 52,064 593 52,468Total1,012 118,504 1,033 122,295 1,079 128,750 1,202 141,603 1,299 143,428Source: DG <strong>Health</strong> Effort, MoH
Annex 5.5NoProvincesNUMBER OF GENERAL HOSPITAL AND BED OF MOH/GOVERNMENT OWNERSHIPBY HOSPITAL CLASS AND PROVINCE, <strong>2010</strong>Class A Class B Class C Class DTotal Bed Total Bed Total Bed Total Bed Total Bed(1) (2) (3) (4) (5) (6) (7) (8) (9) (10) (11) (12)1 Aceh 0 0 4 763 12 1,164 5 265 21 2,1922 North Sumatera 1 482 8 1,769 19 1,392 3 133 31 3,7763 West Sumatera 0 0 2 1,056 14 1,313 2 117 18 2,4864 Riau 0 0 1 415 10 974 3 353 14 1,7425 Jambi 0 0 1 321 9 788 2 104 12 1,2136 South Sumatera 1 860 1 73 9 1,058 7 423 18 2,4147 Bengkulu 0 0 1 298 3 228 7 268 11 7948 Lampung 0 0 2 812 7 698 2 147 11 1,6579 Bangka Belitung Island 0 0 0 0 3 347 4 250 7 59710 Riau Island 0 0 0 0 7 514 1 50 8 56411 DKI Jakarta 2 1,601 6 1,624 1 214 0 0 9 3,43912 West Java 1 852 18 3,856 13 1,575 2 92 34 6,37513 Central Java 1 888 20 6,151 20 3,638 6 473 47 11,15014 DI Yogyakarta 1 733 3 496 1 124 0 0 5 1,35315 East Java 1 1,447 19 4,965 23 3,020 7 337 50 9,76916 Banten 0 0 4 1,043 2 136 0 0 6 1,17917 Bali 1 667 4 835 4 427 1 50 10 1,97918 West Nusa Tenggara 0 0 1 322 6 672 1 50 8 1,04419 East Nusa Tenggara 0 0 1 284 5 544 11 790 17 1,61820 West Kalimantan 0 0 2 618 7 581 4 126 13 1,32521 Central Kalimantan 0 0 2 451 5 466 7 253 14 1,17022 South Kalimantan 0 0 2 682 10 850 2 78 14 1,61023 East Kalimantan 0 0 5 1,158 8 613 3 199 16 1,97024 North Sulawesi 0 0 1 735 4 466 7 405 12 1,60625 Central Sulawesi 0 0 2 441 7 532 3 153 12 1,12626 South Sulawesi 1 580 5 901 18 1,630 2 76 26 3,18727 Southeast Sulawesi 0 0 1 212 6 407 5 250 12 86928 Gorontalo 0 0 1 282 1 68 4 200 6 55029 West Sulawesi 0 0 0 0 2 139 2 90 4 22930 Maluku 0 0 1 353 2 147 8 402 11 90231 North Maluku 0 0 1 160 3 118 7 350 11 62832 West Papua 0 0 0 0 4 394 1 50 5 44433 Papua 0 0 1 348 5 561 7 398 13 1,307<strong>Indonesia</strong>10 8,110 120 31,424 250 25,798 126 6,932 506 72,264Source: DG <strong>Health</strong> Effort, MoHTotal
Annex 5.6NUMBER OF SPECIFIC HOSPITAL AND BEDBY TYPE OF HOSPITAL, 2006 - <strong>2010</strong>NoType of Hospital2006 2007 20082009<strong>2010</strong>Hospital Bed Hospital Bed Hospital Bed Hospital Bed Hospital Bed(1) (2) (3) (4) (5) (6) (7) (8) (9) (10) (11) (12)1 RS Jiwa 51 8,630 51 8,726 51 8,781 51 9,206 51 9,1212 RS Kusta 22 2,137 22 2,133 22 2,168 22 2,224 22 2,1703 RS Tuberkulosa Paru 9 718 10 757 11 782 10 731 10 7574 RS Mata 10 459 10 418 10 418 11 423 13 5155 RS Bersalin 57 2,458 57 2,635 57 2,577 61 2,475 65 2,5026 RS Ibu dan Anak 69 3,388 74 3,556 79 3,804 95 4,591 107 5,1307 RS Khusus Lainnya 62 2,157 62 2,187 62 2,258 71 2,427 65 2,665Total280 19,947 286 20,412 292 20,788 321 22,077 333 22,860Source: DG <strong>Health</strong> Effort, MoH
Annex 5.7NUMBER OF BED IN GENERAL HOSPITAL AND SPECIFIC HOSPITALBY BED CLASS AND PROVINCE, 2009Bed ClassV I P Class I Class II Class III Without ClassNoProvincesNumber of BedTotal % Total % Total % Total % Total %(1) (2) (3) (4) (5) (6) (7) (8) (9) (10) (11) (12) (13)1 Aceh 3,351 129 4 241 7 556 17 1,247 37 1,178 352 North Sumatera 13,544 638 5 1,334 10 2,315 17 6,163 46 3,094 233 West Sumatera 4,312 350 8 442 10 1,069 25 1,909 44 542 134 Riau 2,983 266 9 303 10 600 20 1,160 39 654 225 Jambi 1,662 151 9 210 13 300 18 571 34 430 266 South Sumatera 4,727 322 7 588 12 840 18 2,198 46 779 167 Bengkulu 987 55 6 56 6 130 13 210 21 536 548 Lampung 3,091 253 8 251 8 551 18 1,450 47 586 199 Bangka Belitung Island 861 32 4 52 6 211 25 377 44 189 2210 Riau Island 1,588 91 6 166 10 270 17 647 41 414 2611 DKI Jakarta 16,998 1,974 12 2,126 13 3,650 21 5,886 35 3,362 2012 West Java 19,368 1,404 7 2,142 11 4,491 23 7,167 37 4,164 2113 Central Java 23,574 2,294 10 2,936 12 5,265 22 7,523 32 5,556 2414 DI Yogyakarta 4,141 323 8 506 12 911 22 1,432 35 969 2315 East Java 22,268 1,601 7 2,171 10 5,041 23 9,952 45 3,503 1616 Banten 3,319 154 5 411 12 693 21 1,191 36 870 2617 Bali 3,473 392 11 457 13 636 18 1,123 32 865 2518 West Nusa Tenggara 1,602 112 7 167 10 289 18 818 51 216 1319 East Nusa Tenggara 2,448 129 5 273 11 426 17 1,039 42 581 2420 West Kalimantan 3,254 123 4 291 9 563 17 1,547 48 730 2221 Central Kalimantan 1,054 92 9 88 8 150 14 394 37 330 3122 South Kalimantan 2,439 247 10 230 9 464 19 994 41 504 2123 East Kalimantan 3,575 280 8 327 9 702 20 1,458 41 808 2324 North Sulawesi 3,218 85 3 284 9 642 20 1,542 48 665 2125 Central Sulawesi 1,708 73 4 196 11 279 16 712 42 448 2626 South Sulawesi 7,447 473 6 764 10 1,186 16 2,756 37 2,268 3027 Southeast Sulawesi 1,211 57 5 108 9 161 13 479 40 406 3428 Gorontalo 510 35 7 24 5 81 16 204 40 166 3329 West Sulawesi 279 28 10 22 8 58 21 125 45 46 1630 Maluku 1,653 48 3 68 4 192 12 894 54 451 2731 North Maluku 696 20 3 20 3 83 12 214 31 359 5232 West Papua 686 53 8 22 3 66 10 445 65 100 1533 Papua 1,653 21 1 98 6 229 14 824 50 481 29<strong>Indonesia</strong>163,680 12,305 7.5 17,374 10.6 33,100 20.2 64,651 39.5 36,250 22.1Source: DG <strong>Health</strong> Care, MoH
Annex 5.8NUMBER OF PRODUCTION FACILITYIN PHARMACEUTICAL AND MEDICAL DEVICE BY PROVINCE, 2008-<strong>2010</strong>NoProvincesPharmaceutical Industry Traditional Drug Industry Traditional Drug Small Industry Medical Device Production Household and <strong>Health</strong> SupplyCosmetics Industry2008 2009 <strong>2010</strong> 2008 2009 <strong>2010</strong> 2008 2009 <strong>2010</strong> 2008 2009 <strong>2010</strong> 2008 2009 <strong>2010</strong> 2008 2009 <strong>2010</strong>(1) (2) (3) (4) (5) (6) (7) (8) (9) (10) (11) (12) (13) (14) (15) (16) (17) (18) (19) (20)1 Aceh 0 0 0 0 0 0 0 10 19 0 1 0 2 3 1 0 0 52 North Sumatera 10 9 9 3 3 2 78 79 98 9 13 9 26 37 32 41 41 563 West Sumatera 2 2 1 0 0 0 11 13 15 1 1 0 3 3 1 15 13 164 Riau 0 0 0 0 0 0 4 4 0 0 0 0 0 0 0 0 0 05 Jambi 1 1 0 0 0 0 4 4 4 0 0 0 2 2 2 2 2 16 South Sumatera 1 1 1 2 2 0 6 6 0 1 1 1 3 3 3 2 1 27 Bengkulu 0 0 0 0 0 0 0 0 0 0 0 0 0 0 0 0 0 08 Lampung 0 0 0 0 0 0 0 2 2 0 0 0 3 3 3 0 0 19 Bangka Belitung Island 0 0 0 0 0 0 0 0 0 0 2 0 1 1 0 0 0 010 Riau Island 2 2 0 0 0 0 0 0 0 2 1 4 1 1 1 0 0 011 DKI Jakarta 22 23 46 7 7 9 28 116 173 37 46 35 103 120 62 20 70 4612 West Java 77 91 95 32 32 37 184 184 191 63 80 80 162 192 194 108 107 11513 Central Java 31 25 23 0 0 14 36 282 281 14 18 23 50 55 40 45 26 3814 DI Yogyakarta 1 1 1 0 0 0 42 40 61 3 3 6 3 3 5 8 0 015 East Java 54 54 45 17 17 15 411 388 136 17 25 25 64 80 46 150 151 11316 Banten 30 28 30 6 17 20 47 54 57 15 20 19 76 87 86 38 37 10017 Bali 1 1 0 0 0 0 13 12 18 0 0 0 0 0 0 5 24 1218 West Nusa Tenggara 0 0 0 0 0 0 9 9 11 2 3 2 0 0 0 0 0 019 East Nusa Tenggara 0 0 0 0 0 0 1 1 2 0 0 0 0 1 0 0 0 020 West Kalimantan 0 0 0 0 0 0 9 10 13 0 0 0 2 1 0 0 0 121 Central Kalimantan 0 0 0 0 0 0 0 2 0 0 0 0 0 0 0 0 0 022 South Kalimantan 0 0 0 0 0 1 26 29 26 0 0 0 2 3 3 19 20 2023 East Kalimantan 0 0 0 0 0 0 15 15 15 0 0 0 0 0 0 0 0 024 North Sulawesi 0 0 0 0 0 0 9 9 9 0 0 0 3 3 1 0 0 025 Central Sulawesi 0 0 0 0 0 0 0 0 0 0 0 0 0 0 0 0 0 026 South Sulawesi 0 0 0 0 0 0 10 13 9 0 0 0 1 2 1 0 0 027 Southeast Sulawesi 0 0 0 0 0 0 0 0 0 0 0 0 0 0 0 0 0 028 Gorontalo 0 0 0 0 0 0 1 1 1 0 0 0 0 0 0 0 0 029 West Sulawesi 0 0 0 0 0 0 0 0 0 0 0 0 0 0 0 0 0 030 Maluku 0 0 0 0 0 0 1 1 0 0 0 0 0 0 0 0 0 031 North Maluku 0 0 0 0 0 0 6 9 11 0 0 0 0 0 0 0 0 032 West Papua 0 0 0 0 0 0 0 0 0 0 0 0 0 0 0 0 0 033 Papua 0 0 0 0 0 0 0 0 0 0 0 0 0 0 0 0 0 0TOTALSource: DG Pharmaceutical and Medical Supply, MoH232 238 251 67 78 98 951 1,293 1,152 164 214 204 507 600 481 453 492 526
Annex 5.9NUMBER OF DISTRIBUTION FACILITYIN PHARMACEUTICALS AND MEDICAL DEVICE BY PROVINCE, 2008-<strong>2010</strong>NoProvincesWholesaler Pharmacy/Dispensary Drug StoreMedical Device DistributorMedical Device Sub Distributor2008 2009 <strong>2010</strong> 2008 2009 <strong>2010</strong> 2008 2009 <strong>2010</strong> 2008 2009 <strong>2010</strong> 2008 2009 <strong>2010</strong>(1) (2) (3) (4) (5) (6) (7) (8) (9) (10) (11) (12) (13) (14) (15) (16) (17)1 Aceh 51 52 62 170 209 254 576 560 596 0 0 0 99 125 1312 North Sumatera 103 106 107 769 768 971 738 737 805 13 15 36 128 128 1863 West Sumatera 74 81 49 296 295 419 482 478 360 0 0 18 57 89 864 Riau 81 91 89 313 346 452 328 546 434 3 5 0 235 235 2515 Jambi 47 49 54 151 166 206 167 176 161 0 0 0 44 55 486 South Sumatera 95 95 98 225 243 309 95 114 136 5 4 4 106 106 1287 Bengkulu 17 19 20 96 99 140 95 90 76 0 0 0 72 72 848 Lampung 48 53 54 212 225 321 157 113 79 1 1 0 65 65 679 Bangka Belitung Island 10 14 14 62 70 91 79 92 103 2 2 0 30 30 3510 Riau Island 28 33 34 129 160 154 336 377 341 2 2 2 38 55 6311 DKI Jakarta 279 283 357 1,162 1,746 1,862 732 604 549 499 618 564 268 268 48112 West Java 365 393 362 2,256 2,256 2,420 872 872 1,362 58 73 132 244 244 28313 Central Java 329 325 327 522 1,820 2,514 361 361 381 17 23 22 0 0 11414 DI Yogyakarta 42 44 43 355 359 418 52 57 60 4 5 4 96 96 10715 East Java 461 461 492 1,586 1,586 2,418 218 217 298 27 34 47 274 274 34816 Banten 79 81 89 137 401 561 9 9 111 31 37 52 12 20 3717 Bali 81 82 73 383 462 466 159 165 203 3 4 5 109 96 6918 West Nusa Tenggara 38 38 39 162 173 207 102 102 116 0 0 0 92 92 10819 East Nusa Tenggara 27 28 39 103 103 157 183 183 141 0 0 0 153 153 6320 West Kalimantan 69 74 54 130 160 163 270 337 327 0 0 0 97 107 12121 Central Kalimantan 14 15 14 84 126 157 162 141 128 0 0 0 49 50 5022 South Kalimantan 59 61 55 171 199 227 433 460 426 0 0 0 154 159 11823 East Kalimantan 52 47 47 263 349 392 300 336 233 0 0 3 111 152 15224 North Sulawesi 43 43 47 122 139 165 40 73 101 0 0 0 109 143 14825 Central Sulawesi 23 24 25 124 148 178 112 174 161 0 0 0 102 103 9626 South Sulawesi 134 134 118 468 518 319 436 116 366 2 3 0 150 150 20127 Southeast Sulawesi 13 13 16 105 109 150 165 165 106 0 0 0 90 139 3728 Gorontalo 5 6 7 55 61 74 41 40 53 0 0 0 25 18 1129 West Sulawesi 1 1 1 28 45 60 33 44 45 0 0 0 8 8 730 Maluku 6 6 0 34 54 31 25 29 21 0 0 0 64 42 4231 North Maluku 18 19 13 60 59 86 125 125 95 0 0 0 62 77 5232 West Papua 13 13 13 71 75 96 44 46 52 0 0 0 2 3 933 Papua 38 37 43 127 142 165 13 14 21 0 0 0 151 212 67TOTAL2,743 2,821 2,855 10,931 13,671 16,603 7,940 7,953 8,447 667 826 889 3,296 3,566 3,800Source: DG Pharmaceutical and Medical Supply, MoH
Annex 5.10NUMBER OF HEALTH EFFORT COMMUNITY BASED (UKBM ) BY PROVINCE IN INDONESIA, 2009NoProvincesNumber ofVillage/KelurahanDesa / Kelurahan /RW Siaga /PoskesdesKader / TomaTerlatihPosyanduRatio of DesaSiaga/Poskesdes toVillageRatio of Posyanduto Village(1) (2) (3) (4) (5) (6) (7) (8)1 Aceh 6,420 2021 4500 7,039 0.31 1.102 North Sumatera 5,649 3660 3548 13,861 0.65 2.453 West Sumatera 964 2328 - 6,680 2.41 6.934 Riau 1,500 1142 200 4,679 0.76 3.125 Jambi 1,319 854 1950 2,992 0.65 2.276 South Sumatera 2,869 2362 4754 5,775 0.82 2.017 Bengkulu 1,442 1274 1878 1,812 0.88 1.268 Lampung 2,358 1371 4050 7,480 0.58 3.179 Bangka Belitung Island 361 275 714 948 0.76 2.6310 Riau Island 331 192 1059 903 0.58 2.7311 DKI Jakarta 267 1176 990 4,190 4.40 15.6912 West Java 5,827 5378 4500 45,632 0.92 7.8313 Central Java 8,577 7529 3750 47,763 0.88 5.5714 DI Yogyakarta 438 420 714 5,654 0.96 12.9115 East Java 8,502 8446 4086 46,060 0.99 5.4216 Banten 1,530 508 1800 9,548 0.33 6.2417 Bali 698 462 780 4,719 0.66 6.7618 West Nusa Tenggara 913 888 2664 6,133 0.97 6.7219 East Nusa Tenggara 2,775 574 600 5,792 0.21 2.0920 West Kalimantan 1,777 1014 199 4,057 0.57 2.2821 Central Kalimantan 1,439 410 - 2,262 0.28 1.5722 South Kalimantan 1,973 1668 - 3,538 0.85 1.7923 East Kalimantan 1,404 636 515 4,455 0.45 3.1724 North Sulawesi 1,510 984 1770 2,226 0.65 1.4725 Central Sulawesi 1,712 1080 4459 3,015 0.63 1.7626 South Sulawesi 2,874 2610 2520 8,097 0.91 2.8227 Southeast Sulawesi 1,825 1008 1968 2,324 0.55 1.2728 Gorontalo 595 280 612 1,228 0.47 2.0629 West Sulawesi 564 79 660 1,441 0.14 2.5530 Maluku 898 574 1248 1,894 0.64 2.1131 North Maluku 1,041 211 - 1,318 0.20 1.2732 West Papua 1,291 532 360 1,122 0.41 0.8733 Papua 3,583 50 1200 2,190 0.01 0.61<strong>Indonesia</strong>75,226 51,996 58,048 266,827 0.69 3.55Source :DG Community <strong>Health</strong>, MoHCenter for <strong>Health</strong> Promotion, MoH
Annex 5.11NUMBER OF HEALTH POLYTECHNIC INSTITUTION (POLTEKKES )BY PROGRAM AND PROVINCE, <strong>2010</strong>Study ProgramNursery Pharmacy Public <strong>Health</strong> NutritionPhysical TherapyMedical TechnicianNoPoltekkesNurseryMidwiferyDental <strong>Health</strong>PharmacyPharmacy &Food AnalystEnvironmental<strong>Health</strong>NutritionPhysiotherapy(1) (2) (3) (4) (5) (6) (7) (8) (9) (10) (11) (12) (13) (14) (15) (16) (17) (18) (19) (20)1 Banda Aceh 3 3 1 1 0 1 1 0 0 0 0 0 0 0 0 0 0 102 Medan 1 3 1 1 0 1 1 0 0 0 0 1 0 0 0 0 0 93 Padang 2 2 1 0 0 1 1 0 0 0 0 0 0 0 0 0 0 74 Pekanbaru 2 2 0 0 0 1 1 0 0 0 0 0 0 0 0 0 0 65 Jambi 1 1 1 0 0 1 0 0 0 0 0 0 0 0 0 0 0 46 Palembang 4 2 1 2 0 0 2 0 0 0 0 1 0 0 0 0 0 127 Bengkulu 2 2 0 0 0 1 1 0 0 0 0 1 0 0 0 0 0 78 Tanjung Karang 2 2 1 1 0 1 1 0 0 0 0 1 0 0 1 0 0 109 Jakarta I 1 1 1 0 0 0 0 0 0 0 0 0 0 0 0 1 0 410 Jakarta II 0 0 0 1 1 1 1 0 0 0 0 0 1 1 1 0 0 711 Jakarta III 3 2 0 0 0 0 0 0 0 0 0 1 0 0 0 0 0 612 Bandung 3 4 1 0 0 1 1 0 0 0 0 2 0 0 0 0 0 1213 Tasikmalaya 2 2 1 0 0 0 2 0 0 0 0 0 0 0 0 0 1 814 Semarang 5 3 1 0 0 1 1 0 0 0 0 1 0 2 0 0 0 1415 Surakarta 1 1 0 0 0 0 0 1 1 1 1 0 0 0 0 1 0 716 Yogyakarta 1 1 1 0 0 1 1 0 0 0 0 1 0 0 0 0 0 617 Surabaya 4 3 1 0 0 2 0 0 0 0 0 1 1 0 0 0 0 1218 Malang 3 3 0 0 0 0 1 0 0 0 0 0 0 0 0 0 0 719 Denpasar 1 1 1 0 0 1 1 0 0 0 0 1 0 0 0 0 1 720 Mataram 2 1 0 0 0 0 1 0 0 0 0 1 0 0 0 0 0 521 Kupang 3 1 1 1 0 1 1 0 0 0 0 1 0 0 0 0 0 922 Pontianak 1 1 1 0 0 1 1 0 0 0 0 1 0 0 0 0 0 623 Palangkaraya 1 1 0 0 0 0 1 0 0 0 0 0 0 0 0 0 0 324 Banjarmasin 1 1 1 0 0 1 1 0 0 0 0 1 0 0 0 0 0 625 Samarinda 1 2 0 0 0 0 0 0 0 0 0 1 0 0 0 0 0 426 Manado 1 1 1 1 0 1 1 0 0 0 0 1 0 0 0 0 0 727 Palu 2 1 0 0 0 1 0 0 0 0 0 0 0 0 0 0 0 428 Makassar 3 2 1 1 0 2 2 1 0 0 0 1 0 0 0 0 0 1329 Kendari 1 1 0 0 0 0 1 0 0 0 0 0 0 0 0 0 0 330 Gorontalo 1 1 0 0 0 0 1 0 0 0 0 0 0 0 0 0 0 331 Ambon 3 1 0 0 0 1 1 0 0 0 0 0 0 0 0 0 0 632 Ternate 1 1 0 0 0 0 1 0 0 0 0 0 0 0 0 0 0 333 Jayapura 7 2 0 0 0 1 1 0 0 0 0 0 0 0 0 0 0 1134 Sorong 2 2 0 0 0 0 1 0 0 0 0 0 0 0 0 0 0 5TOTAL71 57 18 9 1 23 30 2 1 1 1 18 2 3 2 2 2 243%29.2 23.5 7.4 3.7 0.4 9.5 12.3 0.8 0.4 0.4 0.4 7.4 0.8 1.2 0.8 0.8 0.8 100Source: National Board of <strong>Health</strong> Human Resources Development & Empowerment, MoH RIOccupationTherapySpeechTherapyAcupuncture<strong>Health</strong> AnalystElectromedicTechnicRadiodiagnosticTechnicDental <strong>Health</strong>OrtoticProsteticPerekamInformasiKesehatanTotal
Annex 5.12NUMBER OF NON HEALTH POLYTECHNIC INSTITUTION (NON-POLTEKKES )BY STUDY PROGRAM AND PROVINCE, <strong>2010</strong>NurseryPharmacyPublic <strong>Health</strong>NutritionPhysical TherapyMedical TechnicianNoProvincesSPKSPRGAKPERAKBIDAKGSMFSMKFAKAFARMAAKFARAKL(1) (2) (3) (4) (5) (6) (7) (8) (9) (10) (11) (12) (13) (14) (15) (16) (17) (18) (19) (20) (21) (22) (23) (24) (25) (26)1 Aceh 1 0 14 33 0 0 0 1 1 1 0 2 0 0 0 0 1 1 0 1 1 0 0 572 North Sumatera 1 0 42 55 0 4 0 3 1 1 2 2 0 0 1 0 2 1 1 0 1 0 0 1173 West Sumatera 0 0 13 10 0 1 0 1 3 0 1 1 0 0 0 0 1 0 1 2 0 0 0 344 Riau 0 0 7 20 0 1 0 1 1 0 0 1 0 0 1 0 1 0 0 1 0 0 0 345 Jambi 0 0 7 6 0 0 0 0 1 0 0 0 0 0 0 0 1 0 0 0 0 0 0 156 South Sumatera 0 0 12 16 0 1 0 0 2 2 0 1 0 0 0 0 0 0 0 1 0 0 0 357 Bengkulu 0 0 4 4 0 1 0 0 0 0 0 0 0 0 0 0 0 0 0 0 0 0 0 98 Lampung 0 0 5 10 0 0 0 1 0 0 0 0 0 0 0 0 0 1 0 0 0 0 0 179 Bangka Belitung Island 0 0 2 5 0 0 0 0 0 0 0 0 0 0 0 0 0 0 0 0 0 0 0 710 Riau Island 0 0 2 2 0 0 0 0 0 0 0 0 0 0 0 0 1 0 0 0 0 0 0 511 DKI Jakarta 2 2 33 21 0 9 0 2 3 1 1 2 1 0 2 1 0 1 3 2 1 1 1 8912 West Java 0 0 13 15 0 4 42 0 1 0 0 1 0 0 0 0 2 1 1 1 0 0 0 8113 Central Java 2 0 44 58 0 9 0 3 12 3 2 4 0 0 2 0 4 1 2 6 2 0 0 15414 DI Yogyakarta 0 0 5 2 0 1 0 0 2 0 0 0 0 0 0 0 1 1 0 2 1 1 0 1615 East Java 0 1 42 28 0 7 0 3 2 1 2 2 0 3 2 1 4 0 1 2 0 0 0 10116 Banten 0 0 4 9 0 0 1 0 1 0 0 0 0 0 0 0 0 0 0 0 0 0 0 1517 Bali 1 0 1 3 0 1 0 0 1 0 0 0 0 0 0 0 0 1 0 0 0 0 0 818 West Nusa Tenggara 1 0 4 7 0 0 0 0 2 1 0 0 0 0 0 0 0 0 0 1 0 0 0 1619 East Nusa Tenggara 2 0 3 0 0 0 0 0 0 0 0 0 0 0 0 0 0 0 0 0 0 0 0 520 West Kalimantan 0 0 6 4 0 0 0 0 1 0 0 0 0 0 0 0 0 0 0 0 0 0 0 1121 Central Kalimantan 0 0 3 2 0 0 0 0 1 0 0 0 0 0 0 0 1 0 0 0 0 0 0 722 South Kalimantan 0 0 6 6 0 1 0 0 2 0 0 0 0 0 0 0 0 0 0 0 0 0 0 1523 East Kalimantan 0 0 6 7 0 2 0 0 1 1 0 0 0 0 0 0 0 0 0 0 0 0 0 1724 North Sulawesi 0 0 4 0 0 0 0 0 0 0 0 1 0 0 0 0 0 0 0 0 0 0 0 525 Central Sulawesi 0 0 5 0 0 2 0 0 2 0 0 0 0 0 0 0 0 0 0 0 0 0 0 926 South Sulawesi 23 1 26 22 0 6 0 0 1 1 0 0 0 0 3 0 1 1 0 1 1 0 0 8727 Southeast Sulawesi 0 0 6 2 1 0 0 0 1 1 0 0 0 0 0 0 1 0 0 0 0 0 0 1228 Gorontalo 0 0 2 0 0 0 0 0 0 0 0 0 0 0 0 0 0 0 0 0 0 0 0 229 West Sulawesi 0 0 0 0 0 0 0 0 0 0 0 0 0 0 0 0 0 0 0 0 0 0 0 030 Maluku 0 0 1 0 0 0 0 0 0 0 0 0 0 0 0 0 0 0 0 0 0 0 0 131 North Maluku 0 0 0 2 0 0 0 0 0 0 0 0 0 0 0 0 0 0 0 0 0 0 0 232 West Papua 0 0 0 0 0 0 0 0 0 0 0 0 0 0 0 0 0 0 0 0 0 0 0 033 Papua 0 0 0 0 0 0 0 0 1 0 0 0 0 0 1 0 1 0 0 0 0 0 0 3TOTALSource: National Board of <strong>Health</strong> Human Resources Development & Empowerment, MoH RIAKZIAKFIS33 4 322 349 1 50 43 15 43 13 8 17 1 3 12 2 22 9 9 20 7 2 1 986ATWD-III AKUPUNTURSMAKATGAAKATROAROAPIKESATEMD-I PTTDD-IIIKardiovaskulerTotal
Annex 5.13NUMBER OF ACADEMIC FIELD/STUDY PROGRAM OF HEALTH POLYTECHNIC (POLTEKKES )BY ACCREDITATION AND STRATA, <strong>2010</strong>NoPoltekkesNumber of AcademicField/Study ProgramHave AccreditationS t r a t aA B CNot have Accreditation YetTotal % Total % Total % Total % Total %(1) (2) (3) (4) (5) (6) (7) (8) (9) (10) (11) (12) (13)1 Banda Aceh 10 7 70 1 14 6 86 0 0 3 302 Medan 9 9 100 2 22 7 78 0 0 0 03 Pekanbaru 7 6 86 5 83 1 17 0 0 1 144 Padang 6 2 33 0 0 2 100 0 0 4 675 Jambi 4 4 100 2 50 2 50 0 0 0 06 Bengkulu 12 8 67 2 0 6 75 0 0 4 337 Palembang 7 4 57 2 50 2 50 0 0 3 438 Tanjung Karang 10 8 80 0 0 8 100 0 0 2 209 Jakarta I 4 3 75 2 67 1 33 0 0 1 2510 Jakarta II 7 7 100 4 57 3 43 0 0 0 011 Jakarta III 6 6 100 6 100 0 0 0 0 0 012 Bandung 12 11 92 9 82 2 18 0 0 1 813 Tasikmalaya 8 5 63 5 100 0 0 0 0 3 3814 Yogyakarta 14 6 43 6 100 0 0 0 0 0 015 Semarang 7 11 157 9 82 2 18 0 0 3 4316 Surakarta 6 6 100 3 50 3 50 0 0 1 1717 Surabaya 12 12 100 10 83 2 17 0 0 0 018 Malang 7 7 100 5 71 2 29 0 0 0 019 Denpasar 7 5 71 2 40 3 60 0 0 2 2920 Mataram 5 5 100 4 80 1 20 0 0 0 021 Kupang 9 7 78 0 0 7 100 0 0 2 2222 Pontianak 6 6 100 2 33 4 67 0 0 0 023 Palangkaraya 3 2 67 0 0 2 100 0 0 1 3324 Samarinda 6 6 100 3 50 3 50 0 0 0 025 Banjarmasin 4 2 50 1 50 1 50 0 0 2 5026 Palu 7 6 86 0 0 6 100 0 0 1 1427 Makassar 4 3 75 0 0 0 0 3 0 0 028 Kendari 13 4 31 0 0 4 100 0 0 0 029 Manado 3 8 267 2 25 6 75 0 0 5 16730 Gorontalo 3 3 100 0 0 3 100 0 0 0 031 Ambon 6 6 100 0 0 4 67 2 33 0 032 Ternate 3 2 67 0 0 2 100 0 0 1 3333 Jayapura 11 4 36 0 0 4 100 0 0 7 6434 Sorong 5 1 20 0 0 1 100 0 0 4 80Total243 192 79.01 87 45.3 100 52.1 5 2.6 51 20.99Source: National Board of <strong>Health</strong> Human Resources Development & Empowerment, MoH RI
Annex 5.14NUMBER OF NON POLYTECHNIC INSTITUTION (NON-POLTEKKES )BY ACCREDITATION AND STRATA, <strong>2010</strong>NoProvincesTotal % Total % Total % Total % Total %(1) (2) (3) (4) (5) (6) (7) (8) (9) (10) (11) (12) (13)1 Aceh 57 1 3 23 77 6 20 30 53 27 472 North Sumatera 117 6 7 66 75 16 18 88 75 29 253 West Sumatera 34 2 10 16 76 3 14 21 62 13 384 Riau 34 2 12 15 88 0 0 17 50 17 505 Jambi 15 0 0 9 0 0 0 9 60 6 406 South Sumatera 35 7 28 13 52 5 20 25 71 10 297 Bengkulu 9 1 20 4 80 0 0 5 56 4 448 Lampung 17 0 0 11 92 1 8 12 71 5 299 Bangka Belitung Island 7 0 0 2 100 0 0 2 29 5 7110 Riau Island 5 0 0 0 0 0 0 0 0 5 10011 DKI Jakarta 89 8 10 70 89 1 1 79 89 10 1112 West Java 81 3 15 17 85 0 0 20 25 61 7513 Central Java 154 18 17 85 79 5 5 108 70 46 3014 DI Yogyakarta 16 2 25 6 75 0 0 8 50 8 5015 East Java 101 24 30 56 69 1 1 81 80 20 2016 Banten 15 1 20 4 80 0 0 5 33 10 6717 Bali 8 0 0 3 100 0 0 3 38 5 6318 West Nusa Tenggara 16 1 25 3 75 0 0 4 25 12 7519 East Nusa Tenggara 5 0 0 3 100 0 0 3 60 2 4020 West Kalimantan 11 2 25 6 75 0 0 8 73 3 2721 Central Kalimantan 7 0 0 3 100 0 0 3 43 4 5722 South Kalimantan 15 4 40 6 60 0 0 10 67 5 3323 East Kalimantan 17 2 20 8 80 0 0 10 59 7 4124 North Sulawesi 5 0 0 4 80 1 20 5 100 0 025 Central Sulawesi 7 1 14 5 71 1 14 7 100 0 026 South Sulawesi 88 1 3 23 64 12 33 36 41 52 5927 Southeast Sulawesi 12 0 0 7 100 0 0 7 58 5 4228 Gorontalo 0 0 0 0 0 0 0 0 0 0 029 West Sulawesi 2 0 0 1 0 0 0 1 0 1 030 Maluku 1 0 0 1 100 0 0 1 100 1 10031 North Maluku 2 0 0 0 0 0 0 0 0 2 10032 West Papua 0 0 0 0 0 0 0 0 0 0 033 Papua 4 0 0 1 100 0 0 1 25 3 75TotalNumber ofInstitutionSource: National Board of <strong>Health</strong> Human Resources Development & Empowerment, MoH RIAS t r a t aB986 86 14.1 471 77.3 52 8.5 609 61.76 378 38.34CHave AccreditationNo Accreditation yet
Annex 5.15NUMBER OF HEALTH PERSONNEL INSTITUTION OF NON-HEALTH POLYTECHNIC BY OWNERSHIP, <strong>2010</strong>No.Number of <strong>Health</strong> PersonnelLocal GovernmentArmy/PolicePrivateTotal(1) (2)(3) (4) (5) (6)A NURSERY1 Sekolah Perawat Kesehatan (SPK) 1 4 28 332 Akademi Keperawatan (AKPER) 69 16 237 3223 Akademi Kebidanan (AKBID) 18 1 330 3494 Sekolah Pengatur Rawat Gigi (SPRG) 0 3 1 45 Akademi Kesehatan Gigi (AKG) 0 0 1 1Sub Total88 24 597 709B PHARMACY1 Sekolah Menengah Farmasi (SMF) 0 3 90 932 SMKF 0 0 0 03 Akademi Analis Farmasi dan Makanan (AKAFARMA) 0 0 15 154 Akademi Farmasi (AKFAR) 2 1 40 43Sub Total2 4 145 151C PUBLIC HEALTH1 Akademi Kesehatan Lingkungan (AKL) 1 0 12 13Sub Total1 0 12 13D NUTRITION1 Akademi Gizi (AKZI) 1 0 7 8Sub Total1 0 7 8E PHYSICAL THERAPY1 Akademi Fisioterapi (AKFIS) 0 0 17 172 Akademi Okupasi Terapi (AOT) 0 0 0 03 Akademi Terapi Wicara (ATW) 0 0 1 14 Akademi Akupunktur 0 0 3 3Sub Total0 0 21 21F MEDICAL TECHNICIAN1 Sekolah Menengah Analis Kesehatan (SMAK) 1 1 10 122 Akademi Analis Kesehatan (AAK) 2 0 20 223 Akademi Tekniker Gigi (ATG) 0 1 1 24 D-I Pendidikan Teknik Transfusi Darah (PTTD) 0 0 2 25 Akademi Teknik Radiodiagnostik dan Radioterapi (ATRO) 0 0 9 96 Akademi Perekam Informasi Kesehatan (APIKES) 0 0 20 207 Akademi Teknik Elektromedik (ATEM) 0 1 6 78 Akademi Refraksionis Optisi (ARO) 0 0 9 99 Akademi Teknik Kardiovaskuler 0 0 1 1Sub Total3 3 78 84Total95 31 860 986%9.63 3.14 87.22 100Source: National Board of <strong>Health</strong> Human Resources Development & Empowerment, MoH RI
Annex 5.16RECAPITULATION OF POLTEKKES STUDENT BY TYPE OF HEALTH PERSONNELACADEMIC YEAR <strong>2010</strong>/2011PoltekkesNoType of <strong>Health</strong> PersonnelTotalLevel I Level II Level III(1) (2) (3) (4) (5) (6)A NURSERYAKPER 7,192 7,476 7,476 22,144AKBID 5,443 5,025 5,298 15,766AKG 1,635 1,655 1,530 4,820Sub Total14,270 14,156 14,304 42,730B PHARMACYAKAFARMA 80 125 125 330AKFAR 680 625 625 1,930Sub Total760 750 750 2,260C PUBLIC HEALTHAKL 2,245 2,065 2,065 6,375Sub Total2,245 2,065 2,065 6,375D NUTRITIONAKZI 2,360 2,265 2,353 6,978Sub Total2,360 2,265 2,353 6,978E PHISICAL THERAPYAKFIS 225 190 190 605AOT 50 50 50 150ATW 40 40 40 120AKUPUNKTUR 100 40 40 180Sub Total415 320 320 1,055F MEDICAL TECHNICIANAAK 1,300 1,105 1,105 3,510ATG 120 100 100 320PTTD 0 0 0 0ATRO 295 100 160 555APIKES 0 0 0 0ATEM 245 225 225 695ARO 0 0 0 0AOP 20 20 20 60KARDIOVASKULER 0 0 0 0Sub Total1,980 1,550 1,610 5,140Total22,030 21,106 21,402 64,538Source: National Board of <strong>Health</strong> Human Resources Development & Empowerment, MoH RI
Annex 5.17RECAPITULATION OF NON POLTEKKES STUDENT BY TYPE OF HEALTH PERSONNELACADEMIC YEAR <strong>2010</strong>/2011NoType of <strong>Health</strong> PersonnelNon PoltekkesLevel I Level II Level III(1) (2) (3) (4) (5) (6)A NURSERYSPK 1,360 1,760 1,280 4,400AKPER 33,623 31,980 30,795 96,398AKBID 28,355 28,908 41,016 98,279SPRG 400 400 400 1,200AKG 140 100 40 280Sub Total63,878 63,148 73,531 200,557B PHARMACYSMF 5,820 6,013 4,790 16,623AKAFARMA 1,835 1,655 1,490 4,980AKFAR 3,815 3,780 2,840 10,435Sub Total11,470 11,448 9,120 32,038C PUBLIC HEALTHAKL 1,160 1,100 1,180 3,440Sub Total1,160 1,100 1,180 3,440D NUTRITIONAKZI 575 605 605 1,785Sub Total575 605 605 1,785E PHYSICAL THERAPYAKFIS 1,120 1,320 1,260 3,700AOT 0 0 0 0ATW 100 100 100 300AKUPUNKTUR 220 220 160 600Sub Total1,440 1,640 1,520 4,600F MEDICAL TECHNICIANSMAK 850 950 890 2,690AAK 2,150 1,950 1,890 5,990ATG 200 200 200 600PTTD 160 0 0 160ATRO 680 800 700 2,180APIKES 1,205 1,589 1,669 4,463ATEM 480 640 520 1,640ARO 580 680 680 1,940AOP 0 0 0 0KARDIOVASKULER 60 60 60 180Sub Total6,365 6,869 6,609 19,843Total84,888 84,810 92,565 262,263Source: National Board of <strong>Health</strong> Human Resources Development & Empowerment, MoH RITotal
Annex 5.18RECAPITULATION OF STUDENT OF DIPLOMA IV PROGRAMBY TYPE OF EDUCATION INSTITUTION, 2007- 2009NoType of Institution2007 2008 2009(1) (2) (3) (4) (5)I NURSERYKeperawatan Medical Bedah 170 657 380Keperawatan Gawat Darurat 70 400 280Keperawatan Klinik Kemahiran 0 40 20Keperawatan Kardiovaskuler 0 40 20Keperawatan Anestesi 0 40 0Keperawatan Jiwa 0 0 20Keperawatan Intensive 0 0 20Keperawatan Anestesi Reanimasi 0 0 20Sub Total240 1177 760II MIDWIVERYBidan Pendidik 80 520 440Kebidanan Komunitas 0 0 20Sub Total80 520 440III ENVIRONMENTAL HEALTH 100 320 180100 320 180IV NUTRITION 30 580 28030 580 280V PHYSIOTHERAPY 40 80 4040 80 40VI TECHNIC ELECTROMEDIC 0 80 400 80 40VII RADIOLOGY 40 80 4040 80 40VIII HEALTH ANALYST 40 160 8040 160 80IX HEALTH PROMOTION 0 0 200 0 20X DENTAL HEALTHDental <strong>Health</strong> 0 0 60Community Dental <strong>Health</strong> 0 0 20Kesehatan Gigi Prothodansia 0 0 20Dental Bedah Mulut 0 0 20Perawat Gigi Pendidik 0 0 20Sub Total0 0 140TOTAL 570 2997 2020Source: National Board of <strong>Health</strong> Human Resources Development & Empowerment, MoH RIYear
Annex 5.19GRADUATION OF DIKNAKES POLTEKKES AND NON POLTEKKESBY TYPE OF HEALTH PERSONNEL, <strong>2010</strong>No Type of <strong>Health</strong> Personnel Poltekkes Non Poltekkes Total(1) (2) (3) (4) (5)A NURSERYSPK 1,425 1,425AKPER 4,835 30,795 35,630AKBID 4,012 13,816 17,828SPRG 0 400 400AKG 1,068 0 1,068SUB TOTAL9,915 46,436 56,351B PHARMACYSMF 0 3,320 3,320AKAFARMA 90 1,545 1,635AKFAR 439 2,740 3,179SUB TOTAL529 7,605 8,134C PUBLIC HEALTHAKL 1,157 1,020 2,177SUB TOTAL1,157 1,020 2,177D NUTRITIONAKZI 1,458 605 2,063SUB TOTAL1,458 605 2,063E PHYSICAL THERAPYAKFIS 153 1,140 1,293AOT 80 0 80ATW 60 100 160AKUPUNKTUR 0 120 120SUB TOTAL293 1,360 1,653F MEDICAL TECHNICIANSMAK 800 800AAK 772 1,545 2,317ATG 44 200 244PTTD 0 160 160ATRO 199 650 849APIKES 0 1,285 1,285ATEM 185 480 665ARO 0 720 720AOP 60 0 60KARDIOVASKULER 0 60 60SUB TOTAL1,260 5,900 7,160TOTAL14,612 62,926 77,538Source: National Board of <strong>Health</strong> Human Resources Development & Empowerment, MoH RI
Annex 5.20NUMBER OF POLTEKKES GRADUATED BY ACADEMIC FIELD/STUDI PROGRAM FROM HEALTH PERSONNEL INSTITUTION IN INDONESIAACADEMIC YEAR <strong>2010</strong>/2011Academic Field / Study ProgramNoPoltekkesNurseryMidwuferyEnvironmental <strong>Health</strong>NutritionDental<strong>Health</strong>Pharmacy<strong>Health</strong>AnalystTechnic ofElectromedicTechnic ofDiagnosticTechnic ofDentalAKAFARMAPhysiotherapyOcupationTherapyOrthoticProsteticSpeechTherapyTechnic ofRadiotherapyAcupunctureTotal(1) (2) (3) (4) (5) (6) (7) (8) (9) (10) (11) (12) (13) (14) (15) (16) (17) (18) (19) (20)1 Banda Aceh 233 82 29 100 100 5442 Medan 100 291 55 80 60 80 60 7263 Padang 225 250 125 75 60 7354 Pekanbaru 168 160 54 3825 Jambi 65 99 38 40 2426 Bengkulu 95 223 60 3787 Palembang 160 80 80 80 80 80 5608 Tanjung Karang 200 120 120 60 80 80 6609 Jakarta I 68 80 16 16410 Jakarta II 65 104 44 199 60 90 109 67111 Jakarta III 200 155 40 39512 Bandung 220 207 39 60 50 94 67013 Tasikmalaya 80 150 37 26714 Semarang 400 200 100 90 90 88015 Surakarta 110 80 102 80 60 60 49216 Yogyakarta 72 79 79 73 73 100 47617 Malang 314 300 125 73918 Surabaya 600 189 195 80 125 125 1,31419 Denpasar 101 80 17 45 21 26420 Mataram 021 Kupang 280 220 80 50 63022 Pontianak 78 185 56 56 60 56 49123 Palangkaraya 109 101 49 25924 Banjarmasin 40 40 40 40 40 40 24025 Samarinda 80 74 40 19426 Manado 80 80 80 80 80 80 48027 Palu 106 130 89 32528 Makassar 168 40 51 57 51 36729 Kendari 83 97 47 22730 Ambon 230 50 50 50 38031 Ternate 90 90 40 22032 Gorontalo 80 80 80 24033 Jayapura 0Total4,835 4,012 1,157 1,458 1,112 439 772 185 0 0 90 153 80 60 60 199 0 14,612Source: National Board of <strong>Health</strong> Human Resources Development & Empowerment, MoH RI
Annex 5.21RECAPITULATION OF GRADUATION FROM NON POLTEKKES INSTITUTION IN INDONESIA BY TYPE AND PROVINCEACADEMIC YEAR <strong>2010</strong>/2011NoProvincesNurserySPK SPRG AKPER AKBID SMFPharmacyAKAFARMAAKFARPublic<strong>Health</strong>AKLNutritionAKZITherapy(1) (2) (3) (4) (5) (6) (7) (8) (9) (10) (11) (12) (13) (14) (15) (16) (17) (18) (19) (20) (21) (23) (24) (25)1 Aceh 260 810 440 200 100 100 100 80 90 90 60 2,3302 North Sumatera 280 3,620 3,114 400 270 100 80 115 260 166 230 90 90 90 8,9053 West Sumatera 1,205 965 200 100 260 80 90 135 110 170 3,3154 Riau 682 750 180 182 90 45 104 50 2,0835 Jambi 688 400 90 105 1,2836 South Sumatera 1,060 659 135 104 70 100 80 2,2087 Bengkulu 528 400 156 1,0848 Lampung 689 600 100 90 1,4799 Bangka Belitung Island 100 725 400 1,22510 Riau Island 011 DKI Jakarta 100 200 2,499 730 436 130 160 50 130 100 130 75 90 130 100 70 90 60 5,28012 West Java 815 320 89 90 140 70 110 66 1,70013 Central Java 200 4,300 3,300 425 260 500 280 200 160 200 340 90 180 460 180 11,07514 DI Yogyakarta 818 117 90 56 105 60 79 70 1,39515 East Java 100 4,055 551 303 179 90 160 100 120 100 125 290 100 90 6,36316 Banten 550 750 1,30017 Bali 100 125 22518 West Nusa Tenggara 125 545 151 82119 East Nusa Tenggara 160 560 72020 West Kalimantan 750 130 88021 Central Kalimantan 535 100 63522 South Kalimantan 635 601 125 130 1,49123 East Kalimantan 530 88 80 69824 North Sulawesi 680 66 74625 Central Sulawesi 725 180 90526 South Sulawesi 100 100 2,009 707 150 120 57 65 60 70 100 80 3,61827 Southeast Sulawesi 702 80 56 83828 Gorontalo 029 West Sulawesi 030 Maluku 80 8031 North Maluku 032 West Papua 033 Papua 84 100 60 244Total1,425 400 30,795 13,816 3,320 1,545 2,740 1,020 605 1,140 100 120 800 200 1,545 650 720 1,285 480 160 60 62,926TechnicianAKUPUNTUAKFIS ATW SMAK ATG AAK ATRO ARORAPIKESATEMPTTDKARDIOVASKULERTotal
Annex 5.22RECAPITULATION OF HEALTH MANPOWER BY PROVINCEIN DECEMBER <strong>2010</strong>NoProvincesMedicalSpecialist Physician Dentist NurseDentalNurseMidwifePharm.Graduated &PharmacistPharmacistAssistatPublic<strong>Health</strong>GraduatedNutritionistSanitarian(1) (2) (3) (4) (5) (6) (7) (8) (9) (10) (11) (12) (13) (14) (15) (16) (17) (19) (20)1 Aceh 242 841 161 6,888 495 6,516 133 600 1,290 697 480 171 378 291 19,183 2,592 21,7752 North Sumatera 400 1,791 702 8,241 532 9,828 238 841 1,055 581 773 78 335 458 25,853 1,470 27,3233 West Sumatera 290 738 286 3,925 323 3,430 146 536 740 336 373 70 274 222 11,689 1,750 13,4394 Riau 160 779 284 4,360 257 2,818 134 336 413 208 224 43 249 86 10,351 1,836 12,1875 Jambi 161 433 102 3,109 295 1,906 127 360 531 435 165 38 126 233 8,021 1,666 9,6876 South Sumatera 60 505 93 3,129 312 3,409 99 281 1,010 504 320 69 156 96 10,043 1,655 11,6987 Bengkulu 49 377 83 2,816 132 1,950 282 270 818 726 250 52 119 96 8,020 1,560 9,5808 Lampung 130 596 171 3,342 225 2,614 112 174 516 367 196 41 87 142 8,713 1,703 10,4169 Bangka Belitung Island 16 189 46 1,320 91 519 36 101 235 96 102 17 68 53 2,889 467 3,35610 Riau Island 61 339 97 1,673 60 908 77 127 221 125 94 16 90 45 3,933 784 4,71711 DKI Jakarta 2,605 3,302 1,187 24,958 286 1,897 1,886 1,052 3,611 168 1,072 749 2,651 106 45,530 29,955 75,48512 West Java 902 2,385 1,033 14,794 1,110 9,322 273 1,070 1,214 1,140 1,028 97 586 534 35,488 10,121 45,60913 Central Java 1,053 2,716 859 14,605 1,325 11,962 377 1,320 1,323 1,104 1,122 336 1,029 883 40,014 14,165 54,17914 DI Yogyakarta 47 378 199 1,318 255 822 49 174 215 180 164 16 184 143 4,144 1,650 5,79415 East Java 693 2,377 1,124 13,713 819 11,253 306 1,269 834 1,194 1,190 167 555 811 36,305 13,994 50,29916 Banten 102 537 235 2,462 166 2,253 77 106 284 151 174 30 87 52 6,716 1,575 8,29117 Bali 343 937 312 2,745 304 1,853 63 222 309 411 281 69 169 122 8,140 4,042 12,18218 West Nusa Tenggara 69 381 100 3,129 191 2,667 109 164 431 467 669 29 146 91 8,643 2,227 10,87019 East Nusa Tenggara 25 444 131 3,936 414 2,663 116 415 402 576 323 51 144 185 9,825 1,787 11,61220 West Kalimantan 102 468 127 3,916 365 1,825 97 215 321 374 384 33 283 225 8,735 2,282 11,01721 Central Kalimantan 34 385 83 3,067 133 1,266 219 187 296 203 225 16 87 55 6,256 932 7,18822 South Kalimantan 134 539 151 3,385 171 2,097 108 421 592 213 380 23 326 100 8,640 2,169 10,80923 East Kalimantan 206 729 254 4,092 137 1,349 123 242 335 240 210 48 139 150 8,254 2,124 10,37824 North Sulawesi 44 516 45 2,949 259 1,223 90 195 293 401 332 70 8 3 6,428 724 7,15225 Central Sulawesi 88 363 92 3,029 111 1,721 163 200 730 576 190 29 124 54 7,470 1,205 8,67526 South Sulawesi 64 471 322 3,449 420 1,998 194 224 684 417 383 92 105 87 8,910 931 9,84127 Southeast Sulawesi 57 354 88 3,244 138 1,377 168 194 911 544 556 40 175 47 7,893 908 8,80129 Gorontalo 39 191 24 1,249 78 556 103 51 358 293 239 14 19 10 3,224 439 3,66328 West Sulawesi 16 168 71 1,167 45 504 51 59 159 67 61 20 30 27 2,445 220 2,66530 Maluku 36 271 73 2,407 135 1,006 58 41 163 213 258 10 25 14 4,710 705 5,41531 North Maluku 37 199 60 1,757 26 816 109 76 414 83 183 21 64 31 3,876 236 4,11232 West Papua 61 165 37 1,717 35 719 44 94 131 158 137 7 28 27 3,360 200 3,56033 Papua 77 469 99 4,183 78 1,504 97 141 525 257 285 25 253 51 8,044 1,233 9,277Total8,403 25,333 8,731 160,074 9,723 96,551 6,264 11,758 21,364 13,505 12,823 2,587 9,099 5,530 391,745 109,307 501,052Total Per Category 42,467 266,348 18,02234,869 12,823 2,587 9,099 5,530 391,745 109,307 501,052Source: National Board of <strong>Health</strong> Human Resources Development & Empowerment, MoH RINurseryPharmacyPublic <strong>Health</strong>PhysicalTherapyMedicalTechnician<strong>Health</strong>AnalystTotal of<strong>Health</strong>PersonnelTotal ofNon <strong>Health</strong>PersonnelTotal
Annex 5.23NUMBER OF HUMAN RESOURCE IN HEALTH CENTERBY TYPE AND PROVINCE, <strong>2010</strong>Number of <strong>Health</strong> PersonnelTotal of <strong>Health</strong>Pharm.GraduNon <strong>Health</strong>No ProvincesDentalPharmacist PublicPhysical Medical <strong>Health</strong>TotalCenterSpecialist Physician Dentist NurseMidwife ated &Sanitarian NutritionTotalPersonnelNurseAssistant <strong>Health</strong>Therapy Technician AnalystPharmacist(1) (2) (3) (4) (5) (6) (7) (8) (9) (10) (11) (12) (13) (14) (15) (16) (17) (18) (19) (20)1 Aceh 313 0 547 104 4,185 355 5,728 31 308 568 492 285 38 69 140 12,850 982 13,8322 North Sumatera 501 2 1,037 435 4,554 333 7,989 50 425 185 267 383 0 41 189 15,890 481 16,3713 West Sumatera 243 3 447 219 1,848 247 2,887 21 286 200 221 213 2 74 112 6,780 614 7,3944 Riau 190 5 551 192 2,465 133 2,253 36 185 117 140 127 3 73 39 6,319 369 6,6885 Jambi 165 1 273 74 1,755 229 1,608 11 166 94 220 84 15 61 123 4,714 285 4,9996 South Sumatera 300 7 365 78 2,251 273 3,204 34 197 421 334 221 11 81 59 7,536 879 8,4157 Bengkulu 170 0 217 45 1,460 94 1,736 56 112 213 208 121 2 13 39 4,316 270 4,5868 Lampung 266 3 405 135 1,943 181 2,371 25 83 187 223 114 0 14 63 5,747 423 6,1709 Bangka Belitung Island 56 0 113 32 703 67 414 3 57 65 54 64 0 14 29 1,615 158 1,77310 Riau Island 68 4 229 71 926 38 674 15 65 40 55 59 3 24 23 2,226 321 2,54711 DKI Jakarta 358 33 624 510 1,552 173 984 58 130 98 111 156 6 93 7 4,535 1,056 5,59112 West Java 1,028 11 1,726 771 7,733 937 8,502 80 615 484 833 745 8 78 273 22,796 3,691 26,48713 Central Java 876 6 1,852 648 6,505 1,092 10,960 95 644 446 766 720 63 231 393 24,421 5,396 29,81714 DI Yogyakarta 121 1 321 169 801 237 762 26 137 78 151 137 8 107 114 3,049 919 3,96815 East Java 946 23 1,682 964 7,516 718 10,287 115 730 254 798 785 19 164 495 24,550 7,609 32,15916 Banten 198 3 366 196 1,465 146 2,099 21 42 154 121 122 0 6 2 4,743 674 5,41717 Bali 114 0 341 195 1,121 230 1,360 13 104 71 231 108 1 28 32 3,835 445 4,28018 West Nusa Tenggara 150 0 239 82 2,056 166 2,311 32 96 172 364 319 5 52 29 5,923 778 6,70119 East Nusa Tenggara 301 0 302 101 2,644 361 2,314 22 255 144 467 238 12 25 121 7,006 679 7,68520 West Kalimantan 231 4 251 76 2,178 308 1,564 23 117 103 265 269 2 119 116 5,395 587 5,98221 Central Kalimantan 176 0 259 56 2,160 83 1,086 133 128 104 113 162 0 50 10 4,344 271 4,61522 South Kalimantan 219 0 335 114 1,603 92 1,668 36 240 377 129 226 0 147 1 4,968 843 5,81123 East Kalimantan 212 2 417 191 2,123 110 1,012 37 97 139 149 124 3 30 29 4,463 584 5,04724 North Sulawesi 167 2 339 37 2,023 226 1,080 31 134 127 292 249 42 1 2 4,585 110 4,69525 Central Sulawesi 160 0 183 59 1,716 83 1,442 44 89 182 277 91 1 27 21 4,215 317 4,53226 South Sulawesi 401 5 444 289 3,060 384 1,878 155 188 496 391 342 68 82 66 7,848 752 8,60027 Southeast Sulawesi 233 0 232 60 2,183 110 1,119 41 102 342 357 399 0 32 11 4,988 279 5,26728 Gorontalo 81 1 80 11 532 47 359 16 15 97 171 118 0 0 1 1,448 144 1,59229 West Sulawesi 81 0 102 45 730 36 440 23 34 92 45 46 6 7 15 1,621 76 1,69730 Maluku 155 2 188 59 1,620 126 798 16 23 30 121 171 3 5 8 3,170 209 3,37931 North Maluku 101 0 101 39 846 17 562 24 47 159 60 108 6 11 8 1,988 82 2,07032 West Papua 116 2 55 13 1,170 26 521 18 43 50 87 98 1 0 10 2,094 60 2,15433 Papua 308 0 311 70 2,788 27 1,250 27 69 108 131 161 2 98 20 5,062 180 5,242TOTAL9,005 120 14,934 6,140 78,215 7,685 83,222 1,368 5,963 6,397 8,644 7,565 330 1,857 2,600 225,040 30,523 255,563Source: National Board of <strong>Health</strong> Human Resources Development & Empowerment, MoH RI
Annex 5.24RATIO OF PHYSICIAN, DENTIST, NURSE AND MIDWIFE TO NUMBER OF HEALTH CENTERBY PROVINCE, <strong>2010</strong>NoProvincesNumber of <strong>Health</strong>CenterPhysician Dentist Nurse Midwife Ratio of Physician Ratio of Dentist Ratio of Nurse Ratio of Midwife(1) (2) (3) (4) (5) (6) (7) (8) (9) (10) (11)1 Aceh 313 547 104 4,185 5,728 1.75 0.33 13.37 18.302 North Sumatera 501 1,037 435 4,554 7,989 2.07 0.87 9.09 15.953 West Sumatera 243 447 219 1,848 2,887 1.84 0.90 7.60 11.884 Riau 190 551 192 2,465 2,253 2.90 1.01 12.97 11.865 Jambi 165 273 74 1,755 1,608 1.65 0.45 10.64 9.756 South Sumatera 300 365 78 2,251 3,204 1.22 0.26 7.50 10.687 Bengkulu 170 217 45 1,460 1,736 1.28 0.26 8.59 10.218 Lampung 266 405 135 1,943 2,371 1.52 0.51 7.30 8.919 Bangka Belitung Island 56 113 32 703 414 2.02 0.57 12.55 7.3910 Riau Island 68 229 71 926 674 3.37 1.04 13.62 9.9111 DKI Jakarta 358 624 510 1,552 984 1.74 1.42 4.34 2.7512 West Java 1,028 1,726 771 7,733 8,502 1.68 0.75 7.52 8.2713 Central Java 876 1,852 648 6,505 10,960 2.11 0.74 7.43 12.5114 DI Yogyakarta 121 321 169 801 762 265 2.65 140 1.40 662 6.62 630 6.3015 East Java 946 1,682 964 7,516 10,287 1.78 1.02 7.95 10.8716 Banten 198 366 196 1,465 2,099 1.85 0.99 7.40 10.6017 Bali 114 341 195 1,121 1,360 2.99 1.71 9.83 11.9318 West Nusa Tenggara 150 239 82 2,056 2,311 1.59 0.55 13.71 15.4119 East Nusa Tenggara 301 302 101 2,644 2,314 1.00 0.34 8.78 7.6920 West Kalimantan 231 251 76 2,178 1,564 1.09 0.33 9.43 6.7721 Central Kalimantan 176 259 56 2,160 1,086 1.47 0.32 12.27 6.1722 South Kalimantan 219 335 114 1,603 1,668 1.53 0.52 7.32 7.6223 East Kalimantan 212 417 191 2,123 1,012 1.97 0.90 10.01 4.7724 North Sulawesi 167 339 37 2,023 1,080 2.03 0.22 12.11 6.4725 Central Sulawesi 160 183 59 1,716 1,442 1.14 0.37 10.73 9.0126 South Sulawesi 401 444 289 3,060 1,878 1.11 0.72 7.63 4.6827 Southeast Sulawesi 233 232 60 2,183 1,119 1.00 0.26 9.37 4.8028 Gorontalo 81 80 11 532 359 0.99 0.14 6.57 4.4329 West Sulawesi 81 102 45 730 440 1.26 0.56 9.01 5.4330 Maluku 155 188 59 1,620 798 1.21 0.38 10.45 5.1531 North Maluku 101 101 39 846 562 1.00 0.39 8.38 5.5632 West Papua 116 55 13 1,170 521 0.47 0.11 10.09 4.4933 Papua 308 311 70 2,788 1,250 1.01 0.23 9.05 4.06TOTAL9,005 14,934 6,140 78,215 83,222 1.66 0.68 8.69 9.24Source: National Board of <strong>Health</strong> Human Resources Development & Empowerment, MoH RI
Annex 5.25RECAPITULATION OF HUMAN RESOURCE OF GOVERNMENT HOSPITAL BY PROVINCEBY TYPE AND PROVINCE, <strong>2010</strong><strong>Health</strong> PersonnelNoProvincesNumber ofHospitalSpecialist Physician Dentist NurseDentalNurseMidwifePharmPharmacistGraduated &AssistantPharmacistPublic<strong>Health</strong>Env. <strong>Health</strong>NutritionPhysicaltherapyMedicalTherapy<strong>Health</strong>AnalystTotalNon <strong>Health</strong>PersonnelTotal(1) (2) (3) (4) (5) (6) (7) (8) (9) (10) (11) (12) (13) (14) (15) (16) (17) (18) (19) (20)1 Aceh 20 240 234 45 2,380 120 643 60 176 193 80 123 131 271 126 4,822 982 5,8042 North Sumatera 29 381 467 184 3,028 161 1,322 82 227 116 108 221 75 190 149 6,711 481 7,1923 West Sumatera 21 271 250 57 1,846 65 318 75 185 142 35 102 66 186 91 3,689 614 4,3034 Riau 14 155 183 60 1,759 115 456 64 117 89 28 75 40 173 45 3,359 369 3,7285 Jambi 11 147 148 28 1,244 50 248 46 129 98 85 53 22 38 97 2,433 285 2,7186 South Sumatera 12 53 114 14 690 32 142 40 44 92 39 46 45 57 32 1,440 879 2,3197 Bengkulu 14 48 157 36 1,216 33 141 174 133 228 230 103 42 88 53 2,682 270 2,9528 Lampung 10 120 157 22 1,297 40 194 43 61 85 56 55 40 68 66 2,304 423 2,7279 Bangka Belitung Island 7 13 60 8 501 18 77 16 30 27 10 18 17 48 19 862 158 1,0<strong>2010</strong> Riau Island 7 44 80 22 623 18 164 23 37 34 12 22 13 52 21 1,165 321 1,48611 DKI Jakarta 15 2,179 659 324 8,349 112 882 361 898 234 25 189 264 629 99 15,204 1,056 16,26012 West Java 27 839 493 216 6,707 151 691 113 370 164 137 193 88 410 231 10,803 3,691 14,49413 Central Java 56 1,022 710 171 7,710 218 841 185 605 209 138 315 256 712 472 13,564 5,396 18,96014 DI Yogyakarta 3 44 36 7 438 10 31 3 19 12 2 8 7 38 19 674 919 1,59315 East Java 47 652 575 125 5,866 92 784 111 432 164 154 287 147 347 287 10,023 7,609 17,63216 Banten 4 94 115 18 917 13 114 31 52 19 11 30 26 52 45 1,537 674 2,21117 Bali 12 336 533 108 1,537 61 459 24 92 53 55 138 68 131 88 3,683 445 4,12818 West Nusa Tenggara 6 65 120 14 995 22 276 39 47 21 24 295 23 72 45 2,058 778 2,83619 East Nusa Tenggara 16 23 119 22 1,119 46 275 39 88 38 29 40 38 105 59 2,040 679 2,71920 West Kalimantan 15 97 183 40 1,668 44 216 47 65 44 39 74 30 153 97 2,797 587 3,38421 Central Kalimantan 13 32 85 14 780 38 139 46 30 26 24 34 15 28 32 1,323 271 1,59422 South Kalimantan 14 123 163 32 1,529 75 393 50 158 125 75 137 23 129 99 3,111 843 3,95423 East Kalimantan 15 204 259 46 1,869 24 298 58 123 38 25 65 45 99 116 3,269 584 3,85324 North Sulawesi 7 36 92 7 618 21 88 24 30 15 28 35 22 6 0 1,022 110 1,13225 Central Sulawesi 13 86 156 28 1,183 25 242 80 81 120 111 59 28 87 32 2,318 317 2,63526 South Sulawesi 3 19 20 5 187 8 40 14 4 39 1 17 17 13 13 397 752 1,14927 Southeast Sulawesi 13 54 106 22 983 27 207 67 59 176 66 88 39 125 24 2,043 279 2,32228 Gorontalo 7 35 90 13 618 31 171 53 25 107 75 82 14 12 6 1,332 144 1,47629 West Sulawesi 5 16 42 7 391 7 53 14 20 23 8 10 14 23 12 640 76 71630 Maluku 12 33 60 9 647 9 159 13 8 26 23 43 7 12 1 1,050 209 1,25931 North Maluku 9 36 73 12 798 9 223 57 22 66 4 51 15 50 21 1,437 82 1,51932 West Papua 3 26 23 4 131 4 39 3 9 7 3 6 0 0 4 259 60 31933 Papua 13 70 123 21 1,077 46 184 32 35 95 35 65 22 115 27 1,947 180 2,127Total473 7,593 6,685 1,741 60,701 1,745 10,510 2,087 4,411 2,925 1,775 3,079 1,699 4,519 2,528 111,998 30,523 142,521Source: National Board of <strong>Health</strong> Human Resources Development & Empowerment, MoH RI
Annex 5.26RECAPITULATION OF PHYSICIAN AS ACTIVE NON PERMANENT EMPLOYEE, <strong>2010</strong>Reguler Remote Area Very Remote AreaNoProvincesTotalTotal % Total % 6 Months 12 Months Total %(1) (2) (3) (4) (5) (6) (7) (8) (9) (10) (11)1 Aceh 10 5 63 31 4 125 129 64 2022 North Sumatera 62 39 69 44 13 14 27 17 1583 West Sumatera 5 10 24 49 6 14 20 41 494 Riau 26 43 23 38 0 12 12 20 615 Jambi 12 18 28 42 0 26 26 39 666 South Sumatera 0 0 16 100 0 0 0 0 167 Bengkulu 0 0 32 54 0 27 27 46 598 Lampung 5 7 46 64 0 21 21 29 729 Bangka Belitung Island 0 0 7 70 0 3 3 30 1010 Riau Island 1 5 3 15 0 16 16 80 2011 DKI Jakarta 12 100 0 0 0 0 0 0 1212 West Java 37 100 0 0 0 0 0 0 3713 Central Java 57 100 0 0 0 0 0 0 5714 DI Yogyakarta 11 100 0 0 0 0 0 0 1115 East Java 73 100 0 0 0 0 0 0 7316 Banten 4 100 0 0 0 0 0 0 417 Bali 17 100 0 0 0 0 0 0 1718 West Nusa Tenggara 1 2 24 57 0 17 17 40 4219 East Nusa Tenggara 0 0 23 7 17 308 325 93 34820 West Kalimantan 0 0 27 24 0 86 86 76 11321 Central Kalimantan 0 0 23 33 0 47 47 67 7022 South Kalimantan 0 0 45 41 0 64 64 59 10923 East Kalimantan 5 8 26 40 0 34 34 52 6524 North Sulawesi 0 0 27 26 0 76 76 74 10325 Central Sulawesi 0 0 22 24 31 39 70 76 9226 South Sulawesi 12 15 48 59 6 15 21 26 8127 Southeast Sulawesi 1 1 11 8 18 110 128 91 14028 Gorontalo 0 0 19 33 0 38 38 67 5729 West Sulawesi 0 0 8 18 14 22 36 82 4430 Maluku 1 1 0 0 137 0 137 99 13831 North Maluku 0 0 5 10 44 0 44 90 4932 West Papua 0 0 5 4 112 0 112 96 11733 Papua 0 0 9 7 113 0 113 93 122Total352 13 633 24 515 1,114 1,629 62 2,614Source: Bureau of Personnel, MoH RI
Annex 5.27RECAPITULATION OF DENTIST AS ACTIVE NON PERMANENT EMPLOYEE, <strong>2010</strong>RegulerRemote AreaVery Remote AreaNoProvincesTotalTotal % Total % 6 Months 12 Months Total %(1) (2) (3) (4) (5) (6) (7) (8) (9) (10) (11)1 Aceh 0 0 3 5 7 45 52 95 552 North Sumatera 11 32 13 38 1 9 10 29 343 West Sumatera 1 3 12 40 5 12 17 57 304 Riau 1 4 16 59 0 10 10 37 275 Jambi 0 0 4 24 0 13 13 76 176 South Sumatera 0 0 6 86 0 1 1 14 77 Bengkulu 0 0 1 7 0 14 14 93 158 Lampung 7 28 6 24 0 12 12 48 259 Bangka Belitung Island 0 0 4 57 0 3 3 43 710 Riau Island 0 0 4 33 0 8 8 67 1211 DKI Jakarta 0 0 0 0 0 0 0 0 012 West Java 19 100 0 0 0 0 0 0 1913 Central Java 7 100 0 0 0 0 0 0 714 DI Yogyakarta 7 100 0 0 0 0 0 0 715 East Java 52 100 0 0 0 0 0 0 5216 Banten 3 100 0 0 0 0 0 0 317 Bali 6 100 0 0 0 0 0 0 618 West Nusa Tenggara 1 8 5 38 0 7 7 54 1319 East Nusa Tenggara 0 0 1 1 14 83 97 99 9820 West Kalimantan 0 0 3 11 0 25 25 89 2821 Central Kalimantan 0 0 2 13 0 13 13 87 1522 South Kalimantan 0 0 5 12 0 36 36 88 4123 East Kalimantan 2 6 6 17 0 27 27 77 3524 North Sulawesi 0 0 1 14 0 6 6 86 725 Central Sulawesi 0 0 1 6 9 8 17 94 1826 South Sulawesi 2 4 18 40 6 19 25 56 4527 Southeast Sulawesi 0 0 1 2 7 39 46 98 4728 Gorontalo 0 0 0 0 0 16 16 100 1629 West Sulawesi 0 0 0 0 4 15 19 100 1930 Maluku 0 0 1 2 46 0 46 98 4731 North Maluku 0 0 1 4 24 0 24 96 2532 West Papua 0 0 2 15 11 0 11 85 1333 Papua 0 0 1 10 9 0 9 90 10Total119 15 117 15 143 421 564 71 800Source: Bureau of Personnel, MoH RI
Annex 5.28RECAPITULATION OF MIDWIFE AS ACTIVE NON PERMANENT EMPLOYEE, <strong>2010</strong>Reguler Remote Area Very Remote AreaNoProvincesTotalTotal % Total % Total %(1) (2) (3) (4) (5) (6) (7) (8) (9)1 Aceh 216 7 2,662 90 76 3 2,9542 North Sumatera 2,128 46 2,509 54 3 0 4,6403 West Sumatera 1,167 73 429 27 0 0 1,5964 Riau 350 29 872 71 0 0 1,2225 Jambi 168 20 681 80 0 0 8496 South Sumatera 322 62 194 38 0 0 5167 Bengkulu 33 7 406 91 6 1 4458 Lampung 1,182 80 296 20 1 0 1,4799 Bangka Belitung Island 53 83 11 17 0 0 6410 Riau Island 52 26 149 74 1 0 20211 DKI Jakarta 0 0 0 0 0 0 012 West Java 1,837 85 324 15 2 0 2,16313 Central Java 4,543 100 4 0 0 0 4,54714 DI Yogyakarta 214 100 0 0 0 0 21415 East Java 2,850 95 132 4 4 0 2,98616 Banten 629 69 281 31 0 0 91017 Bali 314 96 12 4 0 0 32618 West Nusa Tenggara 166 51 151 46 9 3 32619 East Nusa Tenggara 3 1 337 97 8 2 34820 West Kalimantan 3 1 366 88 49 12 41821 Central Kalimantan 1 2 45 94 2 4 4822 South Kalimantan 2 2 83 98 0 0 8523 East Kalimantan 73 70 32 30 0 0 10524 North Sulawesi 1 5 18 95 0 0 1925 Central Sulawesi 4 2 198 98 1 0 20326 South Sulawesi 464 58 331 42 1 0 79627 Southeast Sulawesi 7 2 324 98 0 0 33128 Gorontalo 3 25 7 58 2 17 1229 West Sulawesi 3 1 349 99 0 0 35230 Maluku 1 1 89 79 23 20 11331 North Maluku 0 0 57 76 18 24 7532 West Papua 0 0 32 100 0 0 3233 Papua 0 0 0 0 0 0 0Total16,789 59 11,381 0 206 1 28,376Source: Bureau of Personnel, MoH RI
Annex 5.29RECAPITULATION OF PHYSICIAN RECRUITMENT AS ACTIVE NON PERMANENT EMPLOYEE, <strong>2010</strong>Reguler Remote Area Very Remote AreaNoProvincesTotalTotal % Total % Total %(1) (2) (3) (4) (5) (6) (7) (8) (9)1 Aceh 10 4 80 34 148 62 2382 North Sumatera 1 1 105 66 54 34 1603 West Sumatera 0 0 28 45 34 55 624 Riau 5 10 29 59 15 31 495 Jambi 0 0 35 52 32 48 676 South Sumatera 0 0 28 93 2 7 307 Bengkulu 0 0 38 56 30 44 688 Lampung 0 0 50 67 25 33 759 Bangka Belitung Island 0 0 8 67 4 33 1210 Riau Island 0 0 7 26 20 74 2711 DKI Jakarta 0 0 0 0 0 0 012 West Java 1 100 0 0 0 0 113 Central Java 0 0 0 0 0 0 014 DI Yogyakarta 0 0 0 0 0 0 015 East Java 2 100 0 0 0 0 216 Banten 0 0 0 0 0 0 017 Bali 0 0 0 0 0 0 018 West Nusa Tenggara 0 0 27 61 17 39 4419 East Nusa Tenggara 0 0 23 6 388 94 41120 West Kalimantan 0 0 31 26 88 74 11921 Central Kalimantan 0 0 29 35 54 65 8322 South Kalimantan 0 0 51 43 69 58 12023 East Kalimantan 0 0 34 47 38 53 7224 North Sulawesi 0 0 32 28 81 72 11325 Central Sulawesi 0 0 24 15 141 85 16526 South Sulawesi 0 0 59 64 33 36 9227 Southeast Sulawesi 0 0 24 12 181 88 20528 Gorontalo 0 0 20 33 41 67 6129 West Sulawesi 0 0 13 16 66 84 7930 Maluku 0 0 0 0 340 100 34031 North Maluku 0 0 6 5 105 95 11132 West Papua 0 0 8 3 259 97 26733 Papua 0 0 20 5 368 95 388TotalSource: Bureau of Personnel, MoH RINotes:*Compilation between Recruitment + New Recruitment19 1 809 23 2,633 76 3,461
Annex 5.30RECAPITULATION OF DENTIST RECRUITMENT AS ACTIVE NON PERMANENT EMPLOYEE, <strong>2010</strong>Reguler Remote Area Very Remote AreaNoProvincesTotalTotal % Total % Total %(1) (2) (3) (4) (5) (6) (7) (8) (9)1 Aceh 0 0 4 6 61 94 652 North Sumatera 0 0 16 52 15 48 313 West Sumatera 0 0 14 39 22 61 364 Riau 0 0 16 57 12 43 285 Jambi 0 0 6 29 15 71 216 South Sumatera 0 0 7 70 3 30 107 Bengkulu 0 0 1 6 15 94 168 Lampung 0 0 7 30 16 70 239 Bangka Belitung Island 0 0 4 57 3 43 710 Riau Island 0 0 7 47 8 53 1511 DKI Jakarta 0 0 0 0 0 0 012 West Java 0 0 0 0 0 0 013 Central Java 0 0 0 0 0 0 014 DI Yogyakarta 0 0 0 0 0 0 015 East Java 0 0 0 0 0 0 016 Banten 0 0 0 0 0 0 017 Bali 0 0 0 0 0 0 018 West Nusa Tenggara 0 0 5 42 7 58 1219 East Nusa Tenggara 0 0 1 1 131 99 13220 West Kalimantan 0 0 4 13 27 87 3121 Central Kalimantan 0 0 2 12 15 88 1722 South Kalimantan 0 0 5 11 41 89 4623 East Kalimantan 0 0 10 26 28 74 3824 North Sulawesi 0 0 1 11 8 89 925 Central Sulawesi 0 0 1 3 39 98 4026 South Sulawesi 0 0 18 37 31 63 4927 Southeast Sulawesi 0 0 0 0 69 100 6928 Gorontalo 0 0 0 0 13 100 1329 West Sulawesi 0 0 1 4 23 96 2430 Maluku 0 0 1 1 111 99 11231 North Maluku 0 0 1 2 55 98 5632 West Papua 0 0 2 5 42 95 4433 Papua 0 0 1 3 30 97 31TotalSource: Bureau of Personnel, MoH RINotes:*Compilation between Recruitment + New Recruitment0 0 135 14 840 86 975
Annex 5.31RECAPITULATION OF MIDWIFE RECRUITMENT AS ACTIVE NON PERMANENT EMPLOYEE, <strong>2010</strong>RegulerRemote AreaNoProvincesTotalTotal % Total %(1) (2) (3) (4) (5) (6) (7)1 Aceh 60 5 1,165 95 1,2252 North Sumatera 643 40 965 60 1,6083 West Sumatera 667 70 290 30 9574 Riau 85 20 350 80 4355 Jambi 89 18 408 82 4976 South Sumatera 327 75 110 25 4377 Bengkulu 24 11 188 89 2128 Lampung 494 70 210 30 7049 Bangka Belitung Island 19 86 3 14 2210 Riau Island 33 31 75 69 10811 DKI Jakarta 0 0 0 0 012 West Java 702 84 132 16 83413 Central Java 1,548 99 10 1 1,55814 DI Yogyakarta 36 100 0 0 3615 East Java 871 95 45 5 91616 Banten 314 76 97 24 41117 Bali 79 88 11 12 9018 West Nusa Tenggara 119 53 104 47 22319 East Nusa Tenggara 0 0 241 100 24120 West Kalimantan 0 0 237 100 23721 Central Kalimantan 0 0 37 100 3722 South Kalimantan 0 0 52 100 5223 East Kalimantan 54 76 17 24 7124 North Sulawesi 0 0 12 100 1225 Central Sulawesi 0 0 190 100 19026 South Sulawesi 491 59 340 41 83127 Southeast Sulawesi 0 0 219 100 21928 Gorontalo 0 0 9 100 929 West Sulawesi 0 0 259 100 25930 Maluku 0 0 75 100 7531 North Maluku 0 0 63 100 6332 West Papua 0 0 32 100 3233 Papua 0 0 0 0 0TotalSource: Bureau of Personnel, MoH RINotes:*Compilation between Recruitment + New Recruitment6,655 53 5,946 47 12,601
Annex 5.33RECAPITULATION OF PHYSICIAN RECRUITMENT AS NON PERMANENT EMPLOYEE<strong>2010</strong>April June SeptemberNeed Realization Percentage Need RealizationPercentageNeed RealizationPercentageNoProvincesCriteriaCriteriaCriteriaCriteriaCriteriaCriteriaCriteriaCriteriaCriteriaTotalTotalTotalTotalTotalTotalTotalTotalTotalRA VRA RA VRA RA VRA RA VRA RA VRA RA VRA RA VRA RA VRA RA VRA(1) (2) (3) (4) (5) (6) (7) (8) (9) (10) (11) (12) (13) (14) (15) (16) (17) (18) (19) (20) (21) (22) (23) (24) (25) (26) (27) (28) (29)1 Aceh 29 27 56 29 27 56 100 100 100 20 13 33 16 13 29 80 100 88 13 7 20 13 7 20 100 100 1002 North Sumatera 22 4 26 22 4 26 100 100 100 30 5 35 27 5 32 90 100 91 13 8 21 13 8 21 100 100 1003 West Sumatera 7 8 15 7 8 15 100 100 100 9 8 17 9 8 17 100 100 100 8 7 15 8 7 15 100 100 1004 Riau 5 2 7 5 2 7 100 100 100 7 3 10 7 3 10 100 100 100 7 4 11 7 4 11 100 100 1005 Jambi 10 5 15 10 5 15 100 100 100 12 3 15 12 3 15 100 100 100 7 4 11 7 4 11 100 100 1006 South Sumatera 7 0 7 7 0 7 100 0 100 10 1 11 10 1 11 100 0 100 11 0 11 11 0 11 100 0 1007 Bengkulu 13 11 24 13 11 24 100 100 100 16 6 22 11 6 17 69 100 77 10 3 13 10 3 13 100 100 1008 Lampung 14 5 19 14 5 19 100 100 100 23 8 31 18 8 26 78 100 84 15 2 17 15 2 17 100 100 1009 Bangka Belitung Island 3 1 4 3 1 4 100 100 100 4 2 6 4 2 6 0 100 100 0 1 1 0 1 1 0 0 010 Riau Island 2 4 6 2 4 6 100 100 100 1 3 4 1 3 4 100 100 100 3 2 5 3 2 5 100 100 10011 DKI Jakarta 0 0 0 0 0 0 0 0 0 0 0 0 0 0 0 0 0 0 0 0 0 0 0 0 0 0 012 West Java 0 0 0 0 0 0 0 0 0 0 0 0 0 0 0 0 0 0 0 0 0 0 0 0 0 0 013 Central Java 0 0 0 0 0 0 0 0 0 0 0 0 0 0 0 0 0 0 0 0 0 0 0 0 0 0 014 DI Yogyakarta 0 0 0 0 0 0 0 0 0 0 0 0 0 0 0 0 0 0 0 0 0 0 0 0 0 0 015 East Java 0 0 0 0 0 0 0 0 0 0 0 0 0 0 0 0 0 0 0 0 0 0 0 0 0 0 016 Banten 0 0 0 0 0 0 0 0 0 0 0 0 0 0 0 0 0 0 0 0 0 0 0 0 0 0 017 Bali 0 0 0 0 0 0 0 0 0 0 0 0 0 0 0 0 0 0 0 0 0 0 0 0 0 0 018 West Nusa Tenggara 10 5 15 10 5 15 100 100 100 7 2 9 7 2 9 100 100 100 9 0 9 9 0 9 100 0 10019 East Nusa Tenggara 6 71 77 6 71 77 100 100 100 7 77 84 7 77 84 100 100 100 4 65 69 4 65 69 100 100 10020 West Kalimantan 5 12 17 5 12 17 100 100 100 17 23 40 8 23 31 47 100 78 12 4 16 12 4 16 100 100 10021 Central Kalimantan 9 19 28 9 19 28 100 100 100 4 5 9 4 5 9 100 100 100 11 5 16 11 5 16 100 100 10022 South Kalimantan 19 9 28 19 9 28 100 100 100 13 12 25 12 12 24 92 100 96 13 8 21 13 8 21 100 100 10023 East Kalimantan 8 8 16 8 8 16 100 100 100 11 5 16 11 5 16 100 100 100 10 4 14 10 4 14 100 100 10024 North Sulawesi 15 12 27 15 12 27 100 100 100 7 8 15 5 8 13 71 100 87 4 15 19 4 15 19 100 100 10025 Central Sulawesi 9 15 24 9 15 24 100 100 100 11 22 33 7 22 29 64 100 88 8 12 20 8 12 20 100 100 10026 South Sulawesi 27 10 37 27 10 37 100 100 100 24 4 28 12 4 16 50 100 57 13 4 17 13 4 17 100 100 10027 Southeast Sulawesi 11 34 45 11 34 45 100 100 100 11 28 39 4 28 32 36 100 82 7 19 26 7 19 26 100 100 10028 Gorontalo 9 3 12 9 3 12 100 100 100 14 7 21 8 7 15 57 100 71 3 6 9 3 6 9 100 100 10029 West Sulawesi 7 10 17 7 10 17 100 100 100 3 8 11 3 8 11 100 100 100 3 10 13 3 10 13 100 100 10030 Maluku 0 20 20 0 20 20 0 100 100 0 49 49 0 49 49 0 100 100 0 34 34 0 34 34 0 100 10031 North Maluku 4 6 10 4 6 10 100 100 100 1 20 21 1 20 21 100 100 100 0 16 16 0 16 16 0 100 10032 West Papua 0 42 42 0 42 42 0 100 100 2 33 35 2 33 35 0 100 100 0 36 36 0 36 36 0 100 10033 Papua 10 57 67 10 57 67 100 100 100 6 58 64 4 55 59 67 95 92 0 54 54 0 54 54 0 100 100Total261 400 661 261 400 661 100 100 100 270 413 683 210 410 620 78 99 91 184 330 514 184 330 514 100 100 100Source: Bureau of Personnel, MoH RINotes:*percentage is comparison between Realization with Necessity
Annex 5.32ACTIVE PHYSICIAN/DENTIST AS NON PERMANENT EMPLOYEE IN MINISTRY OF HEALTHUNTIL DECEMBER <strong>2010</strong>NOProvincesR RA VRA Total R RA VRA Total R RA VRA Total R RA VRA Total R RA VRA Total R RA VRA Total R RA VRA Total R RA VRA Total R RA VRA(1) (2) (3) (4) (5) (6) (7) (8) (9) (10) (11) (12) (13) (14) (15) (16) (17) (18) (19) (20) (21) (22) (23) (24) (25) (26) (27) (28) (29) (30) (31) (32) (33) (34) (35) (36) (37) (38) (39) (40) (41)1 Aceh 0 0 0 0 0 0 0 0 0 0 0 0 0 0 0 0 0 0 0 0 0 1 0 1 0 0 0 0 0 0 0 0 0 1 0 0 2 0 22 North Sumatera 3 0 0 3 2 0 0 2 0 0 0 0 0 0 0 0 0 0 0 0 0 1 0 1 0 0 0 0 0 0 0 0 0 1 1 5 2 1 83 West Sumatera 0 0 0 0 0 0 0 0 0 0 0 0 0 0 0 0 0 0 0 0 0 0 0 0 0 0 0 0 0 0 0 0 0 0 0 0 0 0 04 Riau 0 0 0 0 0 0 0 0 0 0 0 0 0 0 0 0 0 0 0 0 0 1 0 1 0 0 0 0 0 1 0 1 0 0 0 0 2 0 25 Jambi 0 0 0 0 0 0 0 0 0 0 0 0 0 0 0 0 0 0 0 0 0 0 0 0 0 0 0 0 0 0 0 0 0 0 0 0 0 0 06 South Sumatera 0 0 0 0 0 0 0 0 0 0 0 0 0 0 0 0 0 0 0 0 0 0 0 0 0 0 0 0 0 0 0 0 0 0 0 0 0 0 07 Bengkulu 0 0 0 0 0 0 0 0 0 0 0 0 0 0 0 0 0 0 0 0 0 0 0 0 0 0 0 0 0 0 0 0 0 0 0 0 0 0 08 Lampung 0 0 0 0 0 0 0 0 0 0 0 0 0 0 0 0 0 0 0 0 0 1 0 1 0 0 0 0 0 0 0 0 0 2 0 0 3 0 39 Bangka Belitung Island 0 0 0 0 0 0 0 0 0 0 0 0 0 0 0 0 0 0 0 0 0 0 0 0 0 0 0 0 0 0 0 0 0 0 0 0 0 0 010 Riau Island 0 0 0 0 0 0 0 0 0 0 0 0 0 0 0 0 0 0 0 0 0 1 0 1 0 0 0 0 0 0 0 0 0 0 0 0 1 0 111 DKI Jakarta 0 0 0 0 0 0 0 0 0 0 0 0 0 0 0 0 0 0 0 0 0 0 0 0 0 0 0 0 0 0 0 0 0 0 0 0 0 0 012 West Java 0 0 0 0 0 0 0 0 0 0 0 0 0 0 0 0 0 0 0 0 0 0 0 0 0 0 0 0 0 0 0 0 0 0 0 0 0 0 013 Central Java 0 0 0 0 0 0 0 0 0 0 0 0 0 0 0 0 0 0 0 0 0 0 0 0 0 0 0 0 0 0 0 0 0 0 0 0 0 0 014 DI Yogyakarta 0 0 0 0 0 0 0 0 0 0 0 0 0 0 0 0 0 0 0 0 0 0 0 0 0 0 0 0 0 0 0 0 0 0 0 0 0 0 015 East Java 0 0 0 0 0 0 0 0 0 0 0 0 0 0 0 0 0 0 0 0 0 0 0 0 0 0 0 0 0 0 0 0 1 0 0 1 0 0 116 Banten 0 0 0 0 0 0 0 0 0 0 0 0 0 0 0 0 0 0 0 0 0 0 0 0 0 0 0 0 0 0 0 0 0 0 0 0 0 0 017 Bali 0 0 0 0 0 0 0 0 0 0 0 0 0 0 0 0 0 0 0 0 0 0 0 0 0 0 0 0 0 0 0 0 0 0 0 0 0 0 018 West Nusa Tenggara 0 0 0 0 0 0 0 0 0 0 0 0 0 0 0 0 0 0 0 0 0 1 0 1 0 0 0 0 0 0 0 0 0 0 0 0 1 0 119 East Nusa Tenggara 0 0 0 0 0 0 0 0 0 0 0 0 0 0 0 0 0 0 1 1 0 1 0 1 0 1 0 1 0 0 0 0 0 0 2 0 2 3 520 West Kalimantan 0 0 0 0 0 0 0 0 0 0 0 0 0 0 0 0 0 0 0 0 0 0 0 0 0 0 0 0 0 0 0 0 0 2 0 0 2 0 221 Central Kalimantan 0 0 0 0 0 0 0 0 0 0 0 0 0 0 0 0 0 0 0 0 0 0 0 0 1 0 0 1 1 1 0 2 0 0 0 2 1 0 322 South Kalimantan 0 0 0 0 0 0 0 0 0 0 0 0 0 0 0 0 0 0 0 0 0 0 0 0 0 0 0 0 0 0 0 0 0 1 0 0 1 0 123 East Kalimantan 1 0 0 1 1 0 0 1 1 0 0 1 0 0 0 0 0 0 0 0 0 0 0 0 0 0 0 0 0 0 0 0 1 0 0 4 0 0 424 North Sulawesi 0 0 0 0 0 0 0 0 0 0 0 0 0 0 0 0 0 0 0 0 0 1 0 1 0 0 0 0 0 2 0 2 0 1 0 0 4 0 425 Central Sulawesi 0 0 0 0 0 0 0 0 0 0 0 0 0 0 0 0 0 0 1 1 0 0 2 2 0 0 0 0 0 0 0 0 0 0 0 0 0 3 326 South Sulawesi 0 0 0 0 1 0 0 1 0 0 0 0 0 0 0 0 0 0 0 0 0 0 0 0 0 0 0 0 0 0 0 0 0 1 0 1 1 0 227 Southeast Sulawesi 0 0 0 0 0 0 0 0 0 0 0 0 0 0 0 0 0 0 0 0 0 0 0 0 0 0 0 0 0 0 0 0 0 0 0 0 0 0 028 Gorontalo 0 0 0 0 0 0 0 0 1 0 0 1 0 0 0 0 0 0 0 0 0 0 0 0 0 0 0 0 0 0 0 0 0 0 0 1 0 0 129 West Sulawesi 0 0 0 0 0 0 0 0 0 0 0 0 0 0 0 0 0 0 0 0 0 0 0 0 0 0 0 0 0 0 0 0 0 0 0 0 0 0 030 Maluku 0 0 0 0 0 0 0 0 0 0 0 0 0 0 0 0 0 0 0 0 0 0 0 0 0 0 0 0 0 0 0 0 0 0 1 0 0 1 131 North Maluku 0 0 0 0 0 0 0 0 0 0 0 0 0 0 0 0 0 0 0 0 0 0 0 0 0 0 0 0 0 0 0 0 0 0 0 0 0 0 032 West Papua 0 0 0 0 0 0 0 0 0 0 0 0 0 0 0 0 0 0 0 0 0 0 0 0 0 0 0 0 0 2 0 2 0 0 2 0 2 2 433 Papua 0 0 0 0 0 0 0 0 0 0 0 0 0 0 0 0 0 0 0 0 0 0 0 0 0 0 0 0 0 2 0 2 0 0 0 0 2 0 2TOTALSource: Bureau of Personnel, MoH RIAprilRecruitment 2008JuneRecruitment 2009April June SeptemberRecruitment <strong>2010</strong>June4 0 0 4 4 0 0 4 2 0 0 2 0 0 0 0 0 0 2 2 0 8 2 10 1 1 0 2 1 8 0 9 2 9 6 14 26 10 50AprilSeptemberPERPANJANGAN, <strong>2010</strong>RRATotalVRA Total
Annex 5.34RECAPITULATION OF DENTIST RECRUITMENT AS NON PERMANENT EMPLOYEE<strong>2010</strong>AprilJuneSeptemberNecessity RealizationPercentageNecessity Realization Percentage NecessityRealization PercentageNoProvincesCriteriaCriteriaCriteriaCriteriaCriteriaCriteriaCriteriaCriteriaCriteriaTotalTotalTotalTotalTotalTotalTotalTotalTotalRA VRA RA VRA RA VRA RA VRA RA VRA RA VRA RA VRA RA VRA RA VRA(1) (2) (3) (4) (5) (6) (7) (8) (9) (10) (11) (12) (13) (14) (15) (16) (17) (18) (19) (20) (21) (22) (23) (24) (25) (26) (27) (28) (29)1 Aceh 32 26 58 0 7 7 0 27 12 17 27 44 0 12 12 0 44 27 17 9 26 1 2 3 6 22 122 North Sumatera 33 6 39 6 3 9 18 50 23 25 10 35 3 3 6 12 30 17 17 9 26 2 4 6 12 44 233 West Sumatera 12 8 20 2 4 6 17 50 30 9 7 16 2 4 6 22 57 38 11 5 16 8 5 13 73 100 814 Riau 6 1 7 5 1 6 83 100 86 4 2 6 4 2 6 100 100 100 5 3 8 5 3 8 100 100 1005 Jambi 9 5 14 2 3 5 22 60 36 19 5 24 0 1 1 0 20 4 10 9 19 2 5 7 20 56 376 South Sumatera 5 0 5 2 0 2 40 0 40 9 2 11 3 1 4 33 50 36 8 1 9 1 0 1 13 0 117 Bengkulu 19 11 30 1 6 7 5 55 23 9 9 18 0 2 2 0 22 11 11 6 17 0 3 3 0 50 188 Lampung 19 7 26 4 6 10 21 86 38 20 10 30 0 2 2 0 20 7 18 3 21 1 3 4 6 100 199 Bangka Belitung Island 3 2 5 0 2 2 0 100 40 3 1 4 2 1 3 67 100 75 3 0 3 2 0 2 67 0 6710 Riau Island 2 9 11 1 4 5 50 44 45 2 5 7 2 0 2 100 0 29 3 8 11 0 2 2 0 25 1811 DKI Jakarta 0 0 0 0 0 0 0 0 0 0 0 0 0 0 0 0 0 0 0 0 0 0 0 0 0 0 012 West Java 0 0 0 0 0 0 0 0 0 0 0 0 0 0 0 0 0 0 0 0 0 0 0 0 0 0 013 Central Java 0 0 0 0 0 0 0 0 0 0 0 0 0 0 0 0 0 0 0 0 0 0 0 0 0 0 014 DI Yogyakarta 0 0 0 0 0 0 0 0 0 0 0 0 0 0 0 0 0 0 0 0 0 0 0 0 0 0 015 East Java 0 0 0 0 0 0 0 0 0 0 0 0 0 0 0 0 0 0 0 0 0 0 0 0 0 0 016 Banten 0 0 0 0 0 0 0 0 0 0 0 0 0 0 0 0 0 0 0 0 0 0 0 0 0 0 017 Bali 0 0 0 0 0 0 0 0 0 0 0 0 0 0 0 0 0 0 0 0 0 0 0 0 0 0 018 West Nusa Tenggara 12 2 14 2 1 3 17 50 21 7 6 13 0 4 4 0 67 31 6 3 9 1 0 1 17 0 1119 East Nusa Tenggara 10 66 76 0 29 29 0 44 38 0 51 51 0 17 17 0 33 33 1 38 39 0 18 18 0 47 4620 West Kalimantan 5 15 20 1 6 7 20 40 35 9 17 26 1 3 4 11 18 15 7 13 20 2 2 4 29 15 2021 Central Kalimantan 14 17 31 1 8 9 7 47 29 1 4 5 0 1 1 0 25 20 7 9 16 0 1 1 0 11 622 South Kalimantan 15 6 21 1 5 6 7 83 29 13 12 25 1 8 9 8 67 36 11 9 20 2 7 9 18 78 4523 East Kalimantan 14 7 21 2 7 9 14 100 43 11 6 17 4 4 8 36 67 47 7 7 14 2 5 7 29 71 5024 North Sulawesi 12 11 23 1 3 4 8 27 17 10 10 20 0 2 2 0 20 10 12 10 22 0 0 0 0 0 025 Central Sulawesi 12 24 36 0 6 6 0 25 17 6 16 22 1 8 9 17 50 41 5 10 15 0 2 2 0 20 1326 South Sulawesi 17 11 28 4 10 14 24 91 50 18 5 23 4 5 9 22 100 39 19 5 24 5 5 10 26 100 4227 Southeast Sulawesi 6 23 29 0 18 18 0 78 62 7 20 27 0 9 9 0 45 33 3 19 22 0 15 15 0 79 6828 Gorontalo 10 4 14 0 2 2 0 50 14 3 7 10 0 1 1 0 14 10 5 6 11 0 3 3 0 50 2729 West Sulawesi 8 3 11 0 3 3 0 100 27 1 7 8 0 4 4 0 57 50 1 7 8 0 5 5 0 71 6330 Maluku 3 10 13 1 10 11 33 100 85 0 11 11 0 9 9 0 82 82 0 5 5 0 5 5 0 100 10031 North Maluku 3 9 12 1 8 9 33 89 75 0 11 11 0 11 11 0 100 100 3 5 8 0 5 5 0 100 6332 West Papua 4 7 11 0 7 7 0 100 64 2 4 6 1 4 5 50 100 83 1 3 4 1 3 4 100 100 10033 Papua 3 4 7 0 2 2 0 50 29 7 16 23 1 3 4 14 19 17 3 14 17 0 5 5 0 36 29Total285 290 575 37 159 196 13 55 34 212 281 493 29 121 150 14 43 30 194 216 410 35 108 143 18 50 35Source: Bureau of Personnel, MoH RINotes:*percentage is comparison between Realization with Necessity
Annex 5.35NoTraining and Education InstitutionTrainingInvolved Level (Frequency)Frequencies I II III IV VNot Clear(1) (2) (3) (4) (5) (6) (7) (8) (9)1 Pusdiklat SDM Kesehatan 74 0 0 2 10 58 42 BBPK Cilandak 33 0 0 1 32 0 03 BPPK Ciloto 46 1 1 1 0 42 14 Bapelkesnas Lemahabang 16 0 1 2 8 5 05 Bapelkesnas Salaman Magelang 19 0 0 3 10 6 06 Bapelkesnas Makasar 19 0 0 0 0 19 0Sub Total207 1 2 9 60 130 57 BLTKM Jantho 25 23 0 0 2 0 08 Bapelkes Province of South Sumatera 36 0 0 0 30 6 09 Bapelkes Province of West Sumatera 87 63 1 2 14 7 010 Bapelkes Province of Riau 15 4 0 5 3 3 011 Bapelkes Province of Jambi 40 1 18 13 8 0 012 Bapelkes Province of Bengkulu 52 37 2 3 9 0 113 Bapelkes Province of Lampung 28 0 0 22 5 1 014 Bapelkes Province of South Sumatera 41 7 0 0 23 11 015 BPTKM Dinkes Province of West Java 62 62 0 0 0 0 016 BPTPK Gombong 22 0 0 0 22 0 017 Bapelkes Yogyakarta 21 5 0 1 8 7 018 Bapelkes Bendul Merisi Murnajati 61 26 2 1 30 2 019 UPTD BPKKTK Province of Bali 25 17 0 4 3 0 120 Bapelkes Mataram 62 50 0 0 8 1 321 UPTD Pel. Tenaga Kes Kupang 28 13 6 4 5 0 022 Upelkes Province of West Kalimantan 41 29 0 0 1 8 323 Bapelkes Province of Central Kalimantan 24 7 0 3 14 0 024 Bapelkes Province of East Kalimantan 35 6 1 17 8 1 225 Bapelkes Province of South Kalimantan 28 20 0 2 3 3 026 Bapelkes Province of North Sulawesi 33 24 0 5 4 0 027 Bapelkes Palu 29 9 1 0 1 18 028 Bapelkes Province Southeast Sulawesi 20 2 3 7 8 0 029 Bapelkes Province of Maluku 11 0 0 0 10 1 030 Bapelkes Province of Papua 19 13 0 0 0 6 0Sub Total845 418 34 89 219 75 10Total1,052 419 36 98 279 205 15Percentage100 39.8 3.4 9.3 26.5 19.5 1.4Source: National Board of <strong>Health</strong> Human Resources Development & Empowerment, MoH RIDISTRIBUTION OF INVOLVED LEVEL FROM HEALTH EDUCATION INSTITUTION IN INDONESIAIN TRAINING AND EDUCATION INSTITUTION, 2009
Annex 5.36DISTRIBUTION OF WIDYAISWARA FROM TRAINING AND EDUCATION INSTITUTION IN INDONESIABY AGE GROUP, 2009No Training and Education Institution TotalAge Groups< 40 41 - 50 51 - 60 > 60Not Clear(1) (2) (3) (4) (5) (6) (7) (8)1 Pusdiklat SDM Kesehatan 14 0 2 10 2 02 BBPK Cilandak 11 0 0 7 4 03 BPPK Ciloto 7 2 2 3 0 04 Bapelkesnas Lemahabang 8 0 3 5 0 05 Bapelkesnas Salaman Magelang 12 0 5 6 1 06 Bapelkesnas Makasar 6 0 0 3 3 0Sub Total58 2 12 34 10 07 BLTKM Jantho 1 0 0 1 0 08 Bapelkes Province of South Sumatera 9 2 5 2 0 09 Bapelkes Province of West Sumatera 5 0 0 4 1 010 Bapelkes Province of Riau 5 0 3 2 0 011 Bapelkes Province of Jambi 3 0 0 3 0 012 Bapelkes Province of Bengkulu 3 0 0 3 0 013 Bapelkes Province of Lampung 10 2 1 6 0 114 Bapelkes Province of South Sumatera 3 0 1 1 1 015 BPTKM Dinkes Province of West Java 9 0 2 5 2 016 BPTPK Gombong 5 0 0 0 0 517 Bapelkes Yogyakarta 10 0 1 6 3 018 Bapelkes Bendul Merisi Murnajati 7 1 4 1 1 019 UPTD BPKKTK Province of Bali 2 0 0 2 0 020 Bapelkes Mataram 11 0 4 6 1 021 UPTD Pel. Tenaga Kes Kupang 6 2 1 3 0 022 Upelkes Province of West Kalimantan 1 0 0 1 0 023 Bapelkes Province of Central Kalimantan 2 1 1 0 0 024 Bapelkes Province of East Kalimantan 4 1 1 2 0 025 Bapelkes Province of South Kalimantan 6 4 2 0 0 026 Bapelkes Province of North Sulawesi 5 1 3 1 0 027 Bapelkes Palu 2 0 0 2 0 028 Bapelkes Province Southeast Sulawesi 2 0 1 1 0 029 Bapelkes Province of Maluku 1 0 0 0 1 030 Bapelkes Province of Papua 2 0 0 0 1 1Sub Total114 14 30 52 11 7Total172 16 42 86 21 7Source: National Board of <strong>Health</strong> Human Resources Development & Empowerment, MoH RI
Annex 5.37DISTRIBUTION OF TRAINING FREQUENCY AND NUMBER OF PARTICIPANTS IN HEALTH TRAINING AND EDUCATION IN INDONESIABY TYPE OF TRAINING AND EDUCATION INSTITUTION, 2009NoTraining and Education InstitutionTotal Pre Post (Prajabatan )Grading(Penjenjangan)Management Technic Functional OthersFrequency Total Frequency Total Frequency Total Frequency Total Frequency Total Frequency Total Frequency Total(1) (2) (3) (4) (5) (6) (7) (8) (9) (10) (11) (12) (13) (14) (15) (16)1 Pusdiklat SDM Kesehatan 74 2385 22 752 6 204 10 453 14 396 18 557 4 232 BBPK Cilandak 33 1093 9 356 5 171 0 0 18 514 0 0 1 523 BPPK Ciloto 46 3438 16 2001 0 0 1 25 18 944 3 110 8 3584 Bapelkesnas Lemahabang 16 1325 6 758 0 0 0 0 9 537 1 30 0 05 Bapelkesnas Salaman Magelang 19 1549 0 0 0 0 0 0 0 0 0 0 19 15496 Bapelkesnas Makasar 19 779 1 58 0 0 0 0 15 568 3 153 0 0Sub Total 207 10569 54 3925 11 375 11 478 74 2959 25 850 32 19827 BLTKM Jantho 25 3854 1 60 0 0 6 225 18 3569 0 0 0 08 Bapelkes Province of South Sumatera 36 1099 2 77 0 0 6 150 27 842 1 30 0 09 Bapelkes Province of West Sumatera 87 3014 2 56 3 151 25 1239 32 913 3 78 22 57710 Bapelkes Province of Riau 15 439 5 69 0 0 2 60 4 120 0 0 4 19011 Bapelkes Province of Jambi 40 906 0 0 0 0 25 575 11 236 3 75 1 2012 Bapelkes Province of Bengkulu 52 1827 0 0 1 40 9 290 24 829 0 0 18 66813 Bapelkes Province of Lampung 28 2749 0 0 0 0 2 60 25 2399 1 290 0 014 Bapelkes Province of South Sumatera 41 1420 4 198 0 0 1 30 34 1132 2 60 0 015 BPTKM Dinkes Province of West Java 62 2355 16 961 0 0 0 0 41 1235 0 0 5 15916 BPTPK Gombong 22 1165 0 0 0 0 12 860 7 204 3 101 0 017 Bapelkes Yogyakarta 21 816 1 50 0 0 0 0 20 766 0 0 0 018 Bapelkes Bendul Merisi Murnajati 61 3327 5 401 1 42 11 606 34 1661 10 617 0 019 UPTD BPKKTK Province of Bali 25 1033 3 89 0 0 1 30 12 551 0 0 9 36320 Bapelkes Mataram 62 1947 0 0 0 0 12 385 37 1157 1 30 12 37521 UPTD Pel. Tenaga Kes Kupang 28 666 0 0 0 0 8 209 20 457 0 0 0 022 Upelkes Province of West Kalimantan 41 1974 0 0 0 0 36 1782 0 0 3 112 2 8023 Bapelkes Province of Central Kalimantan 24 923 0 0 0 0 3 140 3 160 18 623 0 024 Bapelkes Province of East Kalimantan 35 757 0 0 1 35 15 387 16 195 1 30 2 11025 Bapelkes Province of South Kalimantan 28 1417 1 161 0 0 2 145 24 1088 1 23 0 026 Bapelkes Province of North Sulawesi 33 1070 2 86 2 115 2 71 27 798 0 0 0 027 Bapelkes Palu 29 1014 0 0 0 0 1 85 22 649 2 102 4 17828 Bapelkes Province Southeast Sulawesi 20 565 0 0 0 0 0 0 14 394 6 171 0 029 Bapelkes Province of Maluku 11 356 0 0 0 0 0 0 11 356 0 0 0 030 Bapelkes Province of Papua 19 874 0 0 1 93 2 60 15 691 1 30 0 0Sub Total 845 35,567 42 2,208 9 476 181 7,389 478 20,402 56 2,372 79 2,720Total 1,052 46,136 96 6,133 20 851 192 7,867 552 23,361 81 3,222 111 4,702Source: National Board of <strong>Health</strong> Human Resources Development & Empowerment, MoH RI
Annex 5.38ALLOCATION AND REALIZATION MINISTRY OF HEALTHBY ECHELON I, <strong>2010</strong>Budget of Ministry of <strong>Health</strong>No.Echelon I UnitCentral OfficeLocal/Provincial Office Deconsentration Budget Supporting Task Budget (Tugas Pembantuan )Allocation (Rp) Realization (Rp) % Allocation (Rp) Realization (Rp) % Allocation (Rp) Realization (Rp) % Allocation (Rp) Realization (Rp) %Total of Allocation (Rp)Total of Realization(Rp)(1) (2) (3) (4) (5) (6) (7) (8) (9) (10) (11) (12) (13) (14) (15) (16)1 General Secretary 2,734,841,910,000 2,037,415,851,004 74.50 36,668,106,000 30,749,597,527 83.86 114,936,100,000 101,520,431,987 88.33 122,680,000,000 105,371,462,863 85.89 3,009,126,116,000 2,275,057,343,3812 General Inspectorate 76,977,600,000 60,730,486,059 78.89 0 0 0 0 0 0 0 0 0 76,977,600,000 60,730,486,0593 DG of Community <strong>Health</strong> 1,626,575,397,000 1,348,283,872,638 82.89 59,150,725,000 53,383,588,780 90.25 573,306,908,000 466,844,747,815 81.43 7,000,000,000 6,923,437,760 98.91 2,266,033,030,000 1,875,435,646,9934 DG of Medical Care 4,911,288,035,000 4,673,933,560,560 95.17 6,604,289,127,000 6,018,876,798,657 91.14 6,600,000,000 6,072,395,985 92.01 1,683,200,000,000 1,582,016,309,281 93.99 13,205,377,162,000 12,280,899,064,4835 DG of Disease Control and Environmental <strong>Health</strong> 1,858,133,435,000 1,605,706,258,864 86.42 395,548,915,000 358,991,405,357 90.76 60,974,545,000 52,926,067,513 86.80 115,587,826,000 92,581,830,665 80.10 2,430,244,721,000 2,110,205,562,3996 DG of Pharmaceutical and Medical Device 954,304,590,000 914,389,369,109 95.82 0 0 0 16,500,000,000 15,161,018,191 91.88 0 0 0 970,804,590,000 929,550,387,3007 Badan Penelitian dan Pengembangan Kesehatan 308,837,205,000 265,619,517,518 86.01 110,804,579,000 101,722,631,561 91.80 0 0 0 0 0 0 419,641,784,000 367,342,149,0798National Board of <strong>Health</strong> Human Resources Development &Empowerment1,531,081,712,000 1,373,952,080,563 89.74 1,313,084,861,000 1,179,451,452,695 89.82 52,432,419,000 43,834,163,375 83.60 0 0 0 2,896,598,992,000 2,597,237,696,633Ministry of <strong>Health</strong>14,002,039,884,000 12,280,030,996,315 87.70 8,519,546,313,000 7,743,175,474,577 90.89 824,749,972,000 686,358,824,866 83.22 1,928,467,826,000 1,786,893,040,569 92.66 25,274,803,995,000 22,496,458,336,327Source: Bureau of Keuangan dan BMN, MoH
Annex 5.39DATA OF HEALTH INSURANCE PARTICIPANT, <strong>2010</strong>NoProvinceParticipant of <strong>Health</strong> Insurance (person)Population Number JamkesmasAskes PNSOther PrivateJamsostek Insurance Companydan TNI PolriInsuranceJamkesda Total of Insurance%(1) (2) (3) (4) (5) (6) (7) (8) (9) (10) (11)1 Aceh 4,670,647 2,682,285 524,638 5,550 - - 1,731,925 4,944,398 105.862 North Sumatera 13,042,317 4,124,247 908,884 100,207 - - 565,473 5,698,811 43.693 West Sumatera 4,697,764 1,361,281 535,646 98,829 - - 279,272 2,275,028 48.434 Riau 5,422,961 1,230,911 299,421 42,669 - - 2,042,651 3,615,652 66.675 Jambi 2,840,265 784,842 247,420 49,196 - - 534,471 1,615,929 56.896 South Sumatera 7,288,591 2,793,317 487,956 - - - 4,016,349 7,297,622 100.127 Bengkulu 1,717,789 632,098 181,481 13,488 - - 147,857 974,924 56.758 Lampung 8,129,250 3,146,184 416,025 199,512 - - 339,594 4,101,315 50.459 Bangka Belitung Island 1,135,891 116,726 85,602 23,333 - - 621,230 846,891 74.5610 Riau Island 1,711,972 277,589 86,169 151,213 - - 1,002,000 1,516,971 88.6111 DKI Jakarta 9,146,181 675,718 857,007 1,560,213 - - 341,000 3,433,938 37.5512 West Java 42,693,951 10,700,175 2,357,903 414,243 - - 5,002,792 18,475,113 43.2713 Central Java 32,770,455 11,715,881 2,096,440 214,304 - - 1,172,875 15,199,500 46.3814 DI Yogyakarta 3,434,533 942,129 392,563 68,223 - - 204,157 1,607,072 46.7915 East Java 37,432,020 10,710,051 051 2,189,495 698,482 - - 1,291,881 14,889,909 909 39.7816 Banten 10,579,005 2,910,506 421,326 560,648 - - 37,978 3,930,458 37.1517 Bali 3,516,000 548,617 356,332 88,954 - - 2,535,886 3,529,789 100.3918 West Nusa Tenggara 4,434,012 2,028,491 297,138 7,844 - - 572,976 2,906,449 65.5519 East Nusa Tenggara 4,540,053 2,798,871 363,699 5,877 - - 545,375 3,713,822 81.8020 West Kalimantan 4,319,142 1,584,451 310,171 2,484 - - 405,231 2,302,337 53.3121 Central Kalimantan 2,236,278 763,556 218,143 - - - 421,962 1,403,661 62.7722 South Kalimantan 3,588,444 843,837 323,033 47,624 - - 980,848 2,195,342 61.1823 East Kalimantan 3,016,800 910,925 325,820 285,758 - - 1,072,627 2,595,130 86.0224 North Sulawesi 2,228,856 485,084 272,336 62,771 - - 114,210 934,401 41.9225 Central Sulawesi 2,396,224 851,027 254,125 14,849 - - 333,057 1,453,058 60.6426 South Sulawesi 7,868,358 2,449,737 751,549 86,233 - - 4,601,568 7,889,087 100.2627 Southeast Sulawesi 1,953,478 1,144,447 220,191 87 - - 89,643 1,454,368 74.4528 Gorontalo 1,143,645 431,299 92,379 9,024 - - - 532,702 46.5829 West Sulawesi 1,163,342 473,817 88,550 - - - 14,500 576,867 49.5930 Maluku 2,498,581 840,680 178,562 4,040 - - 714,969 1,738,251 69.5731 North Maluku 1,046,951 302,436 102,951 4,040 - - 170,649 580,076 55.4132 West Papua 729,962 521,558 80,962 - - - - 602,520 82.5433 Papua 2,640,760 1,943,517 185,494 12,608 - - - 2,141,619 81.10Central - 2,673,710 854,854 - 15,351,532 2,856,539 - 21,736,635 9.21NATIONAL236,034,478 76,400,000 17,364,265 4,832,303 15,351,532 2,856,539 31,905,006 148,709,645 63.00%32.37 7.36 2.05 6.50 1.21 13.52 63.00Source: Center for <strong>Health</strong> Financing and Insurance, MoH
Annex 5.40DISTRIBUTION OF MOH EMPLOYEE IN CENTRAL OFFICE, TECHNICAL IMPLEMENTATION UNIT AND DPK/DPBDETAILS BY EDUCATION STRATA IN DECEMBER, <strong>2010</strong>Education StrataStatus ofNoOrganizationSpecialistTotalEmployeeSenior High Junior High PrimaryS3S2S1D IIID I1/2/AVShool School School(1) (2) (3) (4) (5) (6) (7) (8) (9) (10) (11) (12) (13)I General Secretary 0Central Office PNS 9 261 11 361 247 4 478 45 50 1,466CPNS 0 12 0 82 45 0 0 0 0 139Technical Implementation Unit PNS 0 6 0 112 84 0 28 2 2 234CPNS 0 0 14 25 0 0 0 0 0 39DPK/DPB 0 675 29 37 220 11 64 4 0 1,040SUBTOTAL 9 954 54 617 596 15 570 51 52 2,918II General InspectoratePNS 0 128 2 69 11 0 24 0 2 236CPNS 0 9 0 31 2 0 0 0 0 42SUBTOTAL 0 137 2 100 13 0 24 0 2 278III DG of Community <strong>Health</strong> CareCentral Office PNS 2 156 1 107 47 0 76 14 11 414CPNS 0 6 0 23 5 0 0 0 0 34Technical Implementation Unit PNS 0 88 15 88 177 1 115 12 6 502CPNS 0 7 0 22 24 0 0 0 0 53SUBTOTAL 2 257 16 240 253 1 191 26 17 1,003IV DG of Medical CareCentral Office PNS 2 153 3 140 51 0 137 4 9 499CPNS 0 0 0 10 2 0 0 0 0 12Technical Implementation Unit PNS 21 1,711 1,515 3,789 10,685 277 10,782 1,296 689 30,765CPNS 0 263 0 437 1,677 13 9 0 0 2,399SUBTOTAL 23 2,127 1,518 4,376 12,415 290 10,928 1,300 698 33,675V DG of Disease Control and Environmental <strong>Health</strong>Central Office PNS 3 201 1 195 61 7 151 14 18 651CPNS 0 11 0 21 7 0 0 0 0 39Technical Implementation Unit PNS 4 367 22 828 1,107 122 789 74 64 3,377CPNS 0 18 0 76 313 0 0 0 0 407SUBTOTAL 7 597 23 1,120 1,488 129 940 88 82 4,474VI DG of Pharmaceutical and Medical Device 0PNS 0 109 0 29 36 0 38 1 0 213CPNS 0 10 0 4 2 0 0 0 0 16SUBTOTAL 0 119 0 33 38 0 38 1 0 229VII National Board of <strong>Health</strong> Research and DevelopmentCentral Office PNS 23 189 7 208 62 1 239 36 40 805CPNS 0 16 0 58 25 0 0 0 0 99Technical Implementation Unit PNS 1 59 0 142 115 4 78 16 20 435CPNS 0 10 0 51 36 0 0 0 0 97SUBTOTAL 24 274 7 459 238 5 317 52 60 1,436VIIINational Board of <strong>Health</strong> Human Resources Development &EmpowermentCentral Office PNS 0 99 1 172 45 0 156 19 24 516CPNS 0 5 0 26 6 0 0 0 0 37Technical Implementation Unit PNS 17 1,974 36 2,895 944 48 1,886 386 330 8,516CPNS 0 19 0 255 206 0 0 0 0 480SUBTOTAL 17 2,097 37 3,348 1,201 48 2,042 405 354 9,549TOTAL82 6,306 1,655 10,160 16,191 488 14,988 1,922 1,263 53,055Source: Bureau of Personnel, MoH RI
Annex 6.1DEMOGRAPHY IN ASEAN AND SEARO MEMBER STATES<strong>2010</strong>NoCountriesPopulation(million)Mid <strong>2010</strong>Density(per SquareKilometer)UrbanPopulation(%)PopulationGrowth Rate2000-2009(%)PopulationAged 0-14(%)PopulationAged 0-14(%)PopulationAged 0-14(%)DependencyRatio (%)GNI PPP percapita (US$),2008(1) (2) (3) (4) (5) (6) (7) (8) (9) (10) (11)1 Brunei Darussalam 0.4 66 72 2.3 27 70 3 43 50,2002 Philippines 94.0 313 63 2.1 33 63 4 59 3,9003 Cambodia 15.1 83 20 1.9 35 62 3 61 1,8204 Lao PDR 6.4 27 27 2.0 39 57 4 75 2,0605 Malaysia 28.9 87 63 2.1 32 63 5 59 13,7406 Sinapore 5.1 7,526 100 2.1 18 73 9 37 47,9407 Viet Nam 88.9 268 28 1.4 25 67 8 49 2,7008 <strong>Indonesia</strong> 235.5 * 124 43 1.4 28 66 6 52 3,8309 Myanmar 53.4 79 31 0.8 27 70 3 43 1,29010 Thailand 68.1 133 31 1.0 22 71 7 41 5,99011 Bangladesh 164.4 1,142 25 1.6 32 64 4 56 1,44012 Bhutan 0.7 15 32 2.5 31 64 5 56 4,88013 India 1188.8 362 29 1.6 32 63 5 59 2,96014 Korea DPR 22.8 189 60 0.5 22 69 9 45 -15 Maldives 0.3 1,070 35 1.4 30 65 5 54 5,28016 Nepal 28.0 191 17 2.1 37 59 4 69 1,12017 Sri Lanka 20.7 315 15 0.8 26 68 6 47 4,48018 Timor Leste 1.2 77 22 3.7 45 52 3 92 4,690Sumber : - World Population Data Sheet, USAID, <strong>2010</strong>- The State of The Worlds Children, 2011: Population Growth RateNote: *) Population Census <strong>2010</strong> : 237.6 million
Annex 6.2BIRTH RATE, MORTALITY RATE AND HUMAN DEVELOPMENT INDEXIN ASEAN & SEARO MEMBER STATESNoCountriesHuman Life Expectancy at BirthCrude Birth Rate Crude Death Infant Mortality Rate Under five Mortality RateTotal FertilityHDI Rank Development(Eo)per 1000 Rate per 1000(IMR)(U5MR)Rate (TFR)IndexPopulation PopulationM F M+F M F M+F M F M+F2009 <strong>2010</strong> <strong>2010</strong> 20092008HumanDevelopmentIndexMaternal MortalityRate per 100,000 livebirths(1) (2) (3) (4) (5) (6) (7) (8) (9) (10) (11) (12) (13) (14) (15) (16) (17) (18)1 Brunei Darussalam 0.804 37 0.805 75 80 77 1.7 16 3 6 5 5 7 6 7 21 [13 - 34]2 Philippines 0.635 97 0.638 70 74 72 3.2 26 5 29 23 26 36 30 33 94 [61 - 140]3 Cambodia 0.489 124 0.494 59 63 61 3.3 25 8 75 61 68 95 80 88 290 [180 - 480]4 Lao PDR 0.490 122 0.497 63 66 65 3.5 28 7 52 40 46 62 55 59 580 [320 - 1000]5 Malaysia 0.739 57 0.744 72 77 74 2.6 21 5 6 5 6 7 5 6 31 [14 - 68]6 Sinapore 0.841 27 0.846 79 84 81 1.2 10 4 3 2 2 3 2 3 9 [8 - 10]7 Viet Nam 0.566 113 0.572 72 76 74 2.1 17 5 19 20 19 25 23 24 56 [27 - 120]8 <strong>Indonesia</strong> 0.593 108 0.600 69 73 71 * 2.4 20 6 33 27 30 * 42 35 39 * 240 [140 - 380] *9 Myanmar 0.444 132 0.451 56 60 58 2.4 20 11 61 47 54 79 63 71 240 [140 - 410]10 Thailand 0.648 92 0.654 66 72 69 1.8 15 9 13 10 12 15 12 13 48 [32 - 68]11 Bangladesh 0.463 129 0.469 65 67 66 2.4 22 7 44 39 41 53 51 52 340 [170 - 660]12 Bhutan - - - 67 68 68 3.1 25 8 57 48 52 84 73 79 200 [110 - 370]13 India 0.512 119 0.519 63 65 64 2.6 23 7 50 51 50 62 70 66 230 [150 - 350]14 Korea DPR - - - 61 66 63 2.0 15 10 28 25 26 35 31 33 250 [84 - 690]15 Maldives 0.595 107 0.602 72 74 73 2.5 22 3 12 10 11 14 11 13 37 [21 - 64]16 Nepal 0.423 138 0.428 64 65 64 3.0 28 8 38 39 39 49 48 48 380 [210 -650]17 Sri Lanka 0.653 91 0.658 72 76 74 2.4 19 7 15 11 13 18 13 16 39 [26 - 57]18 Timor Leste 0.497 120 0.502 60 62 61 5.7 41 10 54 42 48 64 49 56 370 [150 - 860]Source: - World Population Data Sheet, USAID, <strong>2010</strong>- Human Development Report <strong>2010</strong>: Human Development Index- World <strong>Health</strong> Statistics 2011 WHO: U5MR, Maternal Mortality Rate
Annex 6.3POPULATION USING CLEAN WATER SOURCE AND HYGIENIC SANITATION FACILITIESIN ASEAN & SEARO, 2008NoUrban Rural Total Urban Rural Total(1) (2) (3) (4) (5) (6) (7) (8)1 Brunei Darussalam2 Philippines3 Cambodia4 Lao PDR5 Malaysia6 Sinapore7 Viet Nam8 <strong>Indonesia</strong>9 Myanmar10 Thailand11 Bangladesh12 Bhutan13 India14 Korea DPR15 Maldives16 Nepal17 Sri Lanka18 Timor LesteCountriesSource: The State of The Worlds Children, 2011(%) PopulationUsing Clean Water Source(%) PopulationUsing Hygienic Sanitation Facilities- - - - - -93 87 91 80 69 7681 56 61 67 18 2972 51 57 86 38 53100 99 100 96 95 96100 - 100 100 - 10099 92 94 94 67 7589 71 80 67 36 5275 69 71 86 79 8199 98 98 95 96 9685 78 80 56 52 5399 88 92 87 54 6596 84 88 54 21 31100 100 100 - - -99 86 91 100 96 9893 87 88 51 27 3198 88 90 88 92 9186 63 69 76 40 50
Annex 6.4TUBERCULOSIS IN ASEAN AND SEARO MEMBER STATES2008/2009Prevalence ofIncidence ofIncidence of Tuberculosis per 100,000 Proportion of Tuberculosis Cases through DOTSTuberculosisTuberculosisNoCountriesPopulationper 100,000 Population per 100,000 PopulationCase Detection Rate Succes Rate20092008 2009 2009 2008(1) (2) (3) (4) (6) (7) (8) (9)1 Brunei Darussalam 72 [21-124] 60 [53-69] 4,2 1,7 [1,4-2,2] 89 [77-100] 872 Philippines 520 [486-554] 280 [228-338] 52 35 [23-49] 57 [47-70] 883 Cambodia 693 [316-1115] 442 [377-512] 79 71 [50-95] 60 [52-70] 954 Lao PDR 131 [54-221] 89 [72-107] 32 12 [6,8-19] 68 [57-84] 935 Malaysia 109 [47-173] 83 [75-90] 15 8,6 [6,4-11] 76 [70-84] 786 Sinapore 43 [13-74] 36 [32-42] 2,5 2,3 [1,9-3,0] 89 [77-100] 817 Viet Nam 333 [143-580] 200 [151-256] 34 36 [21-56] 54 [42-72] 928 <strong>Indonesia</strong> 285 [120-482] 189 [154-228] 27 27 [16-41] 67 [56-83] 919 Myanmar 597 [266-995] 404 [328-487] 57 59 [36-87] 64 [53-78] 8510 Thailand 189 [84-315] 137 [111-165] 19 18 [11-27] 69 [57-85] 8211 Bangladesh 425 [197-697] 225 [183-271] 50 51 [37-68] 44 [37-54] 9112 Bhutan 179 [46-313] 158 [132-186] 15 8,3 [4,5-17] 100 [87-120] 9113 India 249 [105-419] 168 [137-202] 23 23 [14-36] 67 [56-83] 8714 Korea DPR 423 [126-739] 345 [294-400] 39 25 [13-45] 93 [80-110] 8915 Maldives 47 [14-81] 39 [33-45] 2,9 2,6 [1,4-4,6] 83 [72-96] 4516 Nepal 240 [97-408] 163 [133-197] 22 21 [13-24] 73 [60-89] 8917 Sri Lanka 101 [41-172] 66 [54-80] 9,6 9,2 [5,3-15] 70 [58-85] 8518 Timor Leste 744 [294-1285] 498 [406-601] 83 66 [36-107] 84 [70-100] 85Source: World <strong>Health</strong> Statistics 2011, WHONote: - CDR = Case Detection Rate- SR = Succes Rate
Annex 6.5ESTIMATION OF HIV/AIDS IN ASEAN AND SEARO MEMBER STATES20091. HIV Estimation2. Deaths related to AIDSNoCountriesAdults and Children Teenagers (15+) Adults (15–49) Rate (%) Women (15+)Adults and ChildrenEstimation (low - high estimation) Estimation (low - high estimation) Estimation(low - highestimation)Estimation(low - highestimation)Estimation(low - highestimation)(1) (2) (3) (4) (5) (6) (7) (8) (9) (10) (11) (12)1 Brunei Darussalam … … … … … … … … … …2 Philippines 8,700 [ 6.100 - 13.000 ] 8,600 [ 6.000 - 13.000 ]
Annex 6.6NUMBER OF VACCINE-PREVENTABLE DISEASESIN ASEAN AND SEARO MEMBER STATES<strong>2010</strong>No Countries DiphteriaPertussis TetanusTetanusNeonatorumMeasles Polio(1) (2) (3) (4) (5) (6) (7) (8)1 Brunei Darussalam 0 1 0 0 0 02 Philippines - - - - - -3 Cambodia 3 372 - 19 1156 04 Lao PDR 34 6 14 7 153 05 Malaysia 3 41 28 10 73 06 Sinapore 0 8 0 0 50 07 Viet Nam 6 81 196 35 2,809 08 <strong>Indonesia</strong> 385 - 137 137 16,529 09 Myanmar 4 0 96 19 190 010 Thailand 65 6 172 4 2,534 011 Bangladesh 27 17 710 117 788 012 Bhutan 0 0 - 0 97 013 India 3,123 38,493 1,574 373 29,760 4314 Korea DPR - 80 - - - 015 Maldives 0 0 0 0 0 016 Nepal 146 2,293 547 13 190 617 Sri Lanka 0 2 11 1 79 018 Timor Leste 0 0 9 7 50 -A S E A NS E A R O500 515 643 231 23,494 03,750 40,891 3,256 671 50,217 49Source: WHO vaccine-preventable diseases monitoring system, 2011 global summary (1 June 2011 updated: http://apps.who.int/immunization_monitoring/en/globalsummary/countryprofileselect.cfm)
Annex 6.7BASIC IMMUNIZATION TO INFANTSIN ASEAN & SEARO, 2009No Countries BCG (%) DPT3 (%) Polio3 (%) Measles (%) Hepatitis B3 (%)(1) (2) (3) (4) (5) (6) (7)1 Brunei Darussalam 99 99 99 99 992 Philippines 90 87 86 88 853 Cambodia 98 94 95 92 914 Lao PDR 67 57 67 59 675 Malaysia 98 95 95 95 956 Sinapore 99 97 97 95 977 Viet Nam 97 96 97 97 948 <strong>Indonesia</strong> 93 82 89 82 829 Myanmar 93 90 90 87 9010 Thailand 99 99 99 98 9811 Bangladesh 99 94 94 89 9512 Bhutan 96 96 96 98 9613 India 87 66 67 71 2114 Korea DPR 98 93 98 98 9215 Maldives 99 98 98 98 9816 Nepal 87 82 82 79 8217 Sri Lanka 98 97 97 96 9718 Timor Leste 71 72 78 70 72Source: WHO Immunization Summary, 2011: A Statistical Reference Containing Data through 2009
Annex 6.8HEALTH EFFORTS IN ASEAN AND SEARO MEMBER STATES2000 - <strong>2010</strong>NoCountriesMarried women aged 15-49years using contraceptive (%)Antenatal Care (4th Visit)Delivery assisted by skilledhealth assistantsInfants breastfed exclusively(6 months)<strong>2010</strong> 2000 - <strong>2010</strong> 2000 - <strong>2010</strong> 2000 - <strong>2010</strong>(1) (2) (3) (4) (5) (6)1 Brunei Darussalam - - 100 -2 Philippines 34 78 62 343 Cambodia 27 27 44 664 Lao PDR 29 - 20 265 Malaysia - - 100 -6 Sinapore 55 - 100 -7 Viet Nam 69 29 88 178 <strong>Indonesia</strong> 57 82 73 329 Myanmar 33 43 37 3110 Thailand 70 80 99 1511 Bangladesh 48 21 18 4312 Bhutan 31 - 72 1013 India 49 50 47 4614 Korea DPR 58 95 97 6515 Maldives 27 85 95 4816 Nepal 44 29 19 5317 Sri Lanka 53 93 99 7618 Timor Leste 21 55 30 52Source: - World <strong>Health</strong> Statistics 2011, WHO- World Population Data Sheet, USAID, <strong>2010</strong> : Percentage of married women aged 15-49 using contraceptive
Annex 6.9HEALTH EXPENDITURES IN ASEAN AND SEARO MEMBER STATES2008NoCountriesTotal expenditure on healthas % of gross domesticproductGeneral governmentexpenditure on health as %of total expenditure onhealthPrivate expenditure onhealth as % of totalexpenditure on healthGeneral governmentexpenditure on health as %of total governmentexpenditurePer capita total expenditureon health (PPP int. $)(1) (2) (3) (4) (5) (6) (7)1 Brunei Darussalam 2,3 85,5 14,5 7,0 9672 Philippines 3,7 34,7 65.3 6,1 453 Cambodia 5,7 23,8 76,2 9,0 284 Lao PDR 4,0 17,6 82,4 3.7 155 Malaysia 4,3 44,1 55,9 6.9 2746 Sinapore 3,3 34,1 65,9 7,8 6257 Viet Nam 7,2 38,5 61,5 9,3 778 <strong>Indonesia</strong> 2,3 54,4 45,6 6.2 499 Myanmar 2,3 7,5 92,5 0,7 210 Thailand 4,1 74,3 25,7 14,2 24411 Bangladesh 3,3 31,4 68,6 7,4 1412 Bhutan 5,5 82,5 17,5 13,0 21713 India 4,2 32,4 67,6 4,4 4014 Korea DPR - - - - -15 Maldives 13,7 61,2 38,8 13,8 47016 Nepal 6,0 37,7 62,3 11,3 2517 Sri Lanka 4,1 43,7 56,3 7,9 8218 Timor Leste 13,9 82,9 17,1 11,9 93Source: World <strong>Health</strong> Statistics 2011, WHO