Box-and-Whisker Plots
Box-and-Whisker Plots
Box-and-Whisker Plots
- No tags were found...

You also want an ePaper? Increase the reach of your titles
YUMPU automatically turns print PDFs into web optimized ePapers that Google loves.
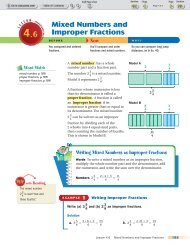
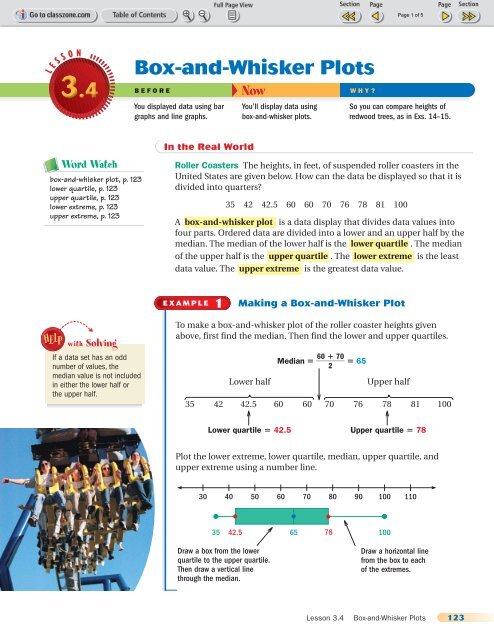
with NotetakingAs you go through thelesson, remember to makelabeled diagrams to helpyou underst<strong>and</strong> key terms.Interpreting a <strong>Box</strong>-<strong>and</strong>-<strong>Whisker</strong> Plot A box-<strong>and</strong>-whisker plothelps to show how varied, or spread out, the data are.The large box represents about half ofthe data. Each small box representsabout one quarter of the data.Each whisker represents aboutone quarter of the data.EXAMPLE 2 Interpreting a <strong>Box</strong>-<strong>and</strong>-<strong>Whisker</strong> PlotWatches The prices of the watches at a store are displayed in thebox-<strong>and</strong>-whisker plot below.10 30 50 70 90 110 1301631 4571120a. If all of the watches under $31 are on clearance, then about whatfraction of the watches are on clearance?b. If all of the watches from $31 to $71 are on sale, then about whatfraction of the watches are on sale?Solutiona. The watches less than $31 are about the same as the number in oneof the whiskers, which represents about one quarter of the watches.b. The watches between $31 <strong>and</strong> $71 are about the same as thenumber in the large box of the plot, which represents about half ofthe watches.Your turn nowComplete the following exercises.1. A movie theater recorded the number of tickets sold for eachshowing of a movie during its opening weekend. Make a box-<strong>and</strong>whiskerplot of the ticket data listed below.497 429 746 469 504 464 326 302 509 467 401 4992. Use the box-<strong>and</strong>-whisker plot from Exercise 1 to make a conclusionabout the data.3. In Example 2, is the number of watches between $71 <strong>and</strong> $120greater than the number of watches between $16 <strong>and</strong> $31?124 Chapter 3 Data <strong>and</strong> Statistics
Practice <strong>and</strong> Problem Solvingwith HomeworkExample Exercises1 7–10, 14, 172 11–123 13, 187. Choose the set of data that is displayedin the box-<strong>and</strong>-whisker plot.A. 1, 30, 39, 12, 13, 20, 11, 22, 29B. 12, 28, 13, 10, 1, 39, 30, 20, 220 10 20 30 40111 20 29 39Online ResourcesCLASSZONE.COM• More Examples• eTutorial PlusMake a box-<strong>and</strong>-whisker plot of the data.8. Hourly rates of pay: 8.75, 7.50, 9, 8, 6.50, 8, 6.50, 7, 6, 7, 6.259. Pages per chapter in a book: 21, 25, 20, 14, 15, 19, 14, 14, 10, 2510. Ages of roller rink employees: 24, 22, 30, 18, 29, 38, 33, 17, 22, 25, 16, 41Fuel Economy The box-<strong>and</strong>-whisker plots show the average miles pergallon of gasoline used in city driving for 2002 models of small cars<strong>and</strong> sport utility vehicles.10 20 30 40 50 60Small cars1923 25 2961ScienceSport utility vehicles10 14 16 19 2511. Compare the number of small cars that get less than 25 miles pergallon with those that get more than 25 miles per gallon.12. About what fraction of the sport utility vehicles get less than 14 milesper gallon?13. Writing Make a conclusion comparing the two groups of vehicles.Trees In Exercises 14 <strong>and</strong> 15, use the heights, to the nearest foot, ofcoastal redwood trees known to be over 340 feet tall listed below.359, 361, 363, 358, 368, 361, 366, 360, 358, 359, 358, 366, 363, 364, 358, 36314. Make a box-<strong>and</strong>-whisker plot of the data.■Redwood TreesSuppose the arch in aredwood tree is 2.1 metershigh. Can a truck that is260 centimeters tall passthrough the arch?15. Suppose the tallest tree is struck by lightning <strong>and</strong> its height is reducedto 352 feet. Make a box-<strong>and</strong>-whisker plot for the new data. How doesthis plot differ from the one that you made in Exercise 14?16. Critical Thinking Suppose you have to make a box-<strong>and</strong>-whisker plotfor an unordered data set with 50 values. Explain how a stem-<strong>and</strong>-leafplot of the data can help you make the box-<strong>and</strong>-whisker plot.126 Chapter 3 Data <strong>and</strong> Statistics